Introduction
Polycystic ovary syndrome (PCOS) is a multifactorial endocrine disorder. It affects approximately 4–18% of women of reproductive age (Moran et al., Reference Moran, Hutchison, Norman and Teede2011). Patients with PCOS are mostly infertile with anomalies of oestrogen and progesterone secretion (De Leo et al., Reference De Leo, Musacchio, Cappelli, Massaro, Morgante and Petraglia2016). Clinically, the main cause of infertility and the metabolic anomalies are hyperandrogenism due to the disruption of the hypothalamic–pituitary–ovarian axis (Umayal et al., Reference Umayal, Chandrasekharan, Wijesundera and Wijeyaratne2018). Furthermore, insulin secretion and insulin resistance have been shown to play a role in the development of PCOS (Umayal et al., Reference Umayal, Chandrasekharan, Wijesundera and Wijeyaratne2018).
The underlying molecular mechanism of PCOS is still unclear. In addition to the environmental factors, genetic factors are believed to take a part in the pathogenesis of PCOS (Makker et al., Reference Makker, Goel and Mahdi2014). Due to the complicated and heterogeneous characteristics of PCOS, the treatment strategies are also complex. The typical treatment strategies are directed to treat the infertility and to lower the risk of insulin resistance in patients with PCOS. Metformin and clomiphene citrate are the two most commonly used drugs for regulating the insulin sensitivity of the ovaries by controlling the uptake of glucose (Nestler, Reference Nestler2008; Pernicova and Korbonits, Reference Pernicova and Korbonits2014; Naderpoor et al., Reference Naderpoor, Shorakae, de Courten, Misso, Moran and Teede2015). Metformin, an oral biguanide insulin-sensitizing agent, has been used in the treatment of metabolic diseases such as diabetes mellitus type 2 as well as PCOS. Metformin may increase insulin sensitivity by blocking gluconeogenesis and improve the uptake of glucose by utilization in liver, skeletal muscles, adipocytes and ovaries (Foretz et al., Reference Foretz, Guigas, Bertrand, Pollak and Viollet2014; Sivalingam et al., Reference Sivalingam, Myers, Nicholas, Balen and Crosbie2014). Furthermore, metformin regulates androgen production in theca cells during oogenesis by directly inhibiting androgen production (Brewer et al., Reference Brewer, Acharya, Thake, Tang and Balen2010). As such, metformin has been suggested to prevent 17-hydroxylase expression and inhibit androstenedione and testosterone production. Similar to metformin, clomiphene citrate has also been suggested to lower CYP17 activity and the production of androgen (Attia et al., Reference Attia, Rainey and Carr2001). Studies have also suggested that metformin may have a positive effect on endometrial receptivity and better vascularization of the endometrium (Jakubowicz et al., Reference Jakubowicz, Seppälä, Jakubowicz, Rodriguez-Armas, Rivas-Santiago, Koistinen, Koistinen and Nestler2001; Palomba et al., Reference Palomba, Russo, Orio, Falbo, Manguso, Cascella, Tolino, Carmina, Colao and Zullo2006; Li et al., Reference Li, Guo, Lin, Feng, Billig and Shao2014). Furthermore, metformin has an effect on mTOR inhibition by lowering the insulin receptor/IGF1 receptor and Akt (Memmott et al., Reference Memmott, Mercado, Maier, Kawabata, Fox and Dennis2010). The insulin receptor is involved in activation of downstream pathways, including the PI3K/AKT pathway. This pathway is involved in the regulation of metabolic insulin action and also regulates many downstream mechanisms controlling cell proliferation and survival. Kinase inhibitors and isoforms of PI3K and AKT that regulate this pathway may play a fundamental role in the control of metabolic events (Cho et al., Reference Cho, Mu, Kim, Thorvaldsen, Chu, Crenshaw, Kaestner, Bartolomei, Shulman and Birnbaum2001; Manning and Cantley, Reference Manning and Cantley2007; Vanhaesebroeck et al., Reference Vanhaesebroeck, Guillermet-Guibert, Graupera and Bilanges2010; Schultze et al., Reference Schultze, Jensen, Hemmings, Tschopp and Niessen2011). In this pathway, the catalytic subunit of PI3K is activated when phosphotyrosines in IRS bind to the SH2 domain of the regulatory subunit of PI3K. Following this activation, PIP2 is converted to PIP3 and AKT is activated by upstream kinases. PDPK1 functions in the phosphorylation of Thr308 of the AKT catalytic domain that activates these kinases (Cho et al., Reference Cho, Mu, Kim, Thorvaldsen, Chu, Crenshaw, Kaestner, Bartolomei, Shulman and Birnbaum2001; Manning and Cantley, Reference Manning and Cantley2007; Vanhaesebroeck et al., Reference Vanhaesebroeck, Guillermet-Guibert, Graupera and Bilanges2010; Schultze et al., Reference Schultze, Jensen, Hemmings, Tschopp and Niessen2011).
The aim of this study was to investigate using mouse models the involvement of the PI3K/AKT pathway in the molecular regulation of PCOS. More specifically, expression levels of Irs, Akt1 and Akt2, mTor and Pdpk1 in ovarian tissues obtained from mouse models of PCOS were correlated with the control group. Furthermore, the effects of metformin, clomiphene citrate and pioglitazone on gene expression levels of Pi3k, Irs, Akt1 and Akt2, mTor and Pdpk1 in ovarian tissue samples were investigated.
Materials and methods
PCOS mouse model
Ethical approval was granted by Manisa Celal Bayar University (77.637.435-42). Female PCOS mouse models were generated at Manisa Celal Bayar University. This project was funded by Near East University (SAG-2019-1-038).
Experimental design and PCOS mouse model
Here, 27 female, 21-day-old, prepubertal BALB/c mice were used in this study. Mice were bred in polycarbonate cages with an automatic 12 h/12 h light/dark cycle (light period: 06.00–18.00 h) and ad libitum access to water and food. Mice were divided randomly into four groups; in which Group 1 (n = 4) included mice with no injections (control group), Group 2 (n = 8) was the PCOS group, in which DHEA (Merck Millipore) (6 mg/100g) was dissolved in 0.01 ml of 96% ethanol and mixed with 0.09 ml sesame oil (total volume: 0.1 ml) and was injected subcutaneously to each mouse for 20 days consecutively. Group 3 (n = 7) included the PCOS + CC group, in which DHEA (6 mg/100g) was injected subcutaneously to each mouse for 20 days consecutively and then clomiphene citrate (1.5 mg/kg, CC) was dissolved in 0.2 ml saline and was administrated by gavage for 5 days consecutively. Group 4 (n = 8) was the PCOS + clomiphene citrate + metformin + pioglitazone group, in which DHEA (6 mg/100 g) was subcutaneously injected to each mouse for 20 days consecutively and then clomiphene citrate (0.15 mg/100 g), metformin (1.2 mg/100 g) and pioglitazone (0.02 mg/100 g) were dissolved in 0.2 ml saline and was injected by gavage for 5 days consecutively.
Cytology of vaginal smear
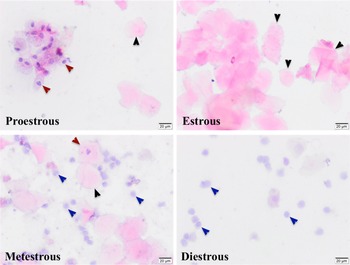
Vaginal smears were obtained on the first and last days of DHEA treatment to determine the stage of the estrous cycle. The vaginal smear samples were stained with haematoxylin and eosin. The estrous cycle was observed and assessed under a light microscope (Olympus BX43, Tokyo, Japan). Proestrus was characterized by the presence of mostly nucleated and some cornified epithelial cells, estrous as mostly cornified cells, metestrus as mostly leukocytes and some cornified epithelial cells, and diestrous as many leukocytes and a few nucleated epithelial cells (Kauffman et al., Reference Kauffman, Thackray, Ryan, Tolson, Glidewell-Kenney, Semaan, Poling, Iwata, Breen, Duleba, Stener-Victorin, Shimasaki, Webster and Mellon2015).
Body weight
Mice from all groups were weighed every day and, depending on the weight of mice, the DHEA doses were calculated (Kauffman et al., Reference Kauffman, Thackray, Ryan, Tolson, Glidewell-Kenney, Semaan, Poling, Iwata, Breen, Duleba, Stener-Victorin, Shimasaki, Webster and Mellon2015).
Glucose tolerance test
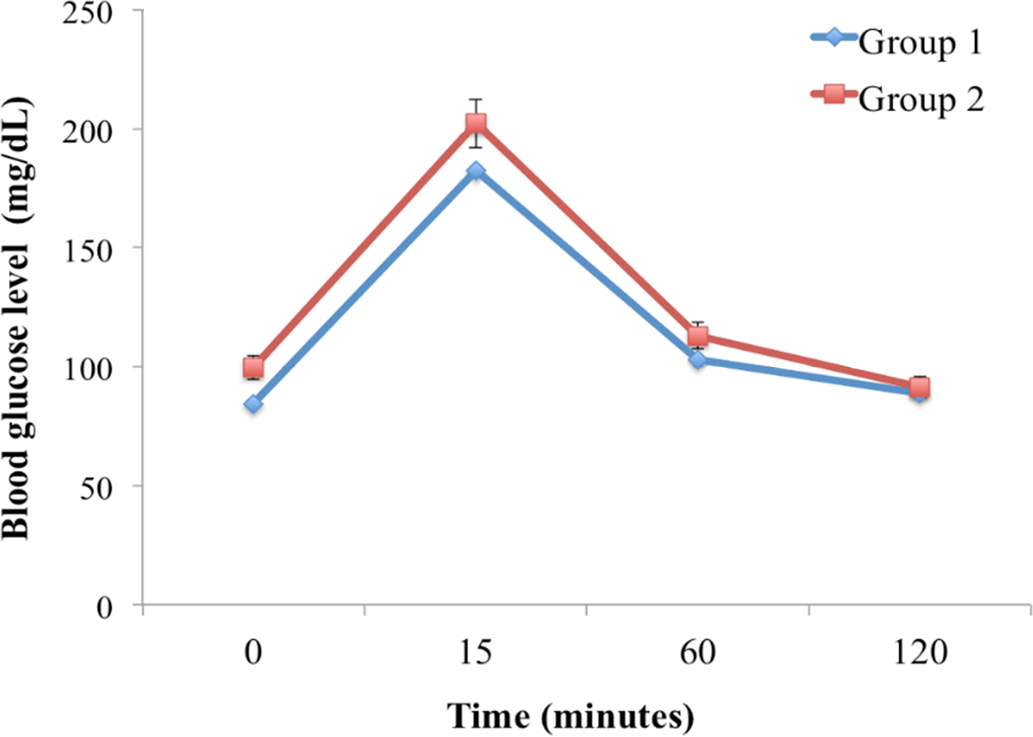
Glucose tolerance test (GTT) was performed in control and PCOS groups. Mice were fasted for 6 h with free access to water. Blood glucose was measured using a glucometer (Accu-Check, Roche) just before (time 0) a single intraperitoneal injection of glucose was administered (2 g/kg body weight in sterile saline) and at 15, 60, and 120 min post injection (Kauffman et al., Reference Kauffman, Thackray, Ryan, Tolson, Glidewell-Kenney, Semaan, Poling, Iwata, Breen, Duleba, Stener-Victorin, Shimasaki, Webster and Mellon2015).
Histochemical analyses
Ovarian samples were fixed in 10% formalin solution for 48 h and then dehydrated through a graded alcohol series, cleared in xylene and embedded in paraffin. Serial sections (5 μm) were stained following a routine haematoxylin and eosin staining protocol. General histological structure of the ovary, follicles in the cortex and stroma of the medulla were evaluated under a light microscope (Olympus BX-43, Tokyo, Japan).
RNA isolation
Total RNA was extracted from paraffin block samples. Here, 20-µm sections of paraffin blocks were used for the RNA extraction using the FFPE RNA Purification kit (Norgen, Biotek Corporation) and following the manufacturer’s protocol. Total RNA was eluted in RNase-free TE buffer. The quality of the RNA was assessed using a NanoDrop ND-1000 spectrophotometer (Thermo Scientific, USA).
cDNA synthesis and real-time PCR analysis
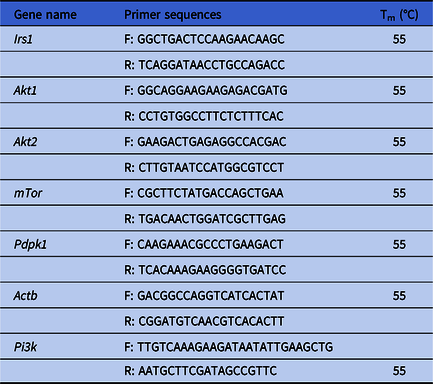
cDNA synthesis was performed using the Transcriptor First Strand cDNA Synthesis Kit (Roche, USA) and following the manufacturer’s protocol. For synthesis, both anchored-oligo(dT)18 primer and random hexamer primers were used. Briefly, the template and primer mixture were denatured at +65°C for 10 min followed by the synthesis reaction as recommended by the manufacturer. Gene expression analyses for Irs, Akt1, Akt2, mTor, Pdpk1 and Actb were carried out using real-time PCR (SYBR Green The LightCycler® 480, USA). Primers were designed using the Primer3 tool and flanking exon–exon junctions (Untergasser et al., Reference Untergasser, Cutcutache, Koressaar, Ye, Faircloth, Remm and Rozen2012). Primer sequences are listed in Table 1. Each PCR was performed with a negative control in the absence of any cDNA. The Rotar Gene software (Qiagen) program was used to obtain the Cq values. The comparative ΔΔCq method was used to investigate the expression levels of mRNAs (Tulay et al., Reference Tulay, Naja, Cascales-Roman, Doshi, Serhal and SenGupta2015). Normalization was performed using the housekeeping gene Actb.
Primer sequences. Forward (F) and reverse (R) primer sequences and melting temperatures are listed

Statistical analysis
GraphPad Prism v.8 was used for all statistical analyses. Differences in the expression levels of each group were investigated using one-way analysis of variance (ANOVA) followed by Dunnett’s correction and unpaired two-tailed Student’s T-test.
Results
Expression levels of the selected genes, Pi3k, Irs, Akt1 and Akt2, mTor and Pdpk1, involved in the PIK3K/AKT pathway were evaluated in the ovarian tissue samples obtained from the control and PCOS mouse model groups. Furthermore, expression levels of these mRNAs were analyzed in relation to the effect of different treatment strategies.
Morphological evaluation of ovaries and vaginal smear cytology evaluation
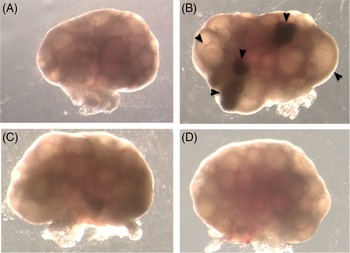
In Group 1, morphological evaluation under a stereomicroscope revealed that ovarian surfaces were smooth and ovarian follicles of different sizes were observed (Fig. 1A). In Group 2, ovarian surfaces had indented protrusions and follicles of different sizes as well as cystic structures were detected (Fig. 1B). In Group 3 and Group 4, ovaries had smooth surfaces and follicles of different sizes with cystic follicles in some locations (Fig. 1C, D). The vaginal smear cytology evaluation revealed that the oestrus cycle of the DHEA-treated group was irregular (Fig. 2). Furthermore, faster weight gain in the group treated with DHEA compared with without DHEA was observed when mice were weighed daily. Basal glucose level was higher in Group 2 than Group 1 and also, we observed impaired glucose tolerance (Fig. 3).
Stereomicroscope images of ovaries. Group 1 (A), Group 2 (B), Group 3 (C), Group 4 (D). Arrowheads: cystic follicles. Original magnification: ×60.

Cytological assessment of vaginal smear and phase of estrous cycle in mice. Red arrowheads: nucleated epithelial cells; black arrowheads: cornified squamous epithelial cells; blue arrowheads: leukocytes. Scale: 20 μm.

Impaired glucose tolerance test and elevated basal glucose leves and significant delays in glucose clearance after intraperitoneal injection in Group 1 and Group 2 (n = 8).

Histological evaluation of ovaries
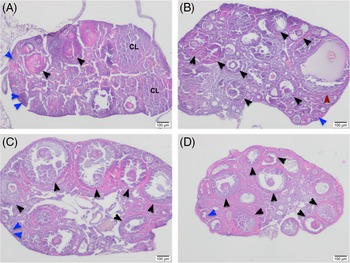
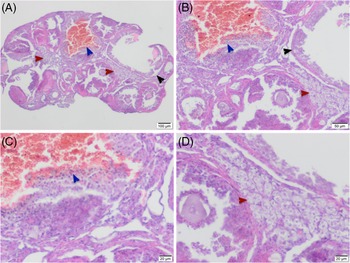
In Group 1, the cortex and medulla were evaluated as normal. In the cortex, primordial follicles surrounded by monolayer squamous epithelium, primary follicles consisting of monolayer and multilayer granulosa cells, secondary follicles with newly developed or developed antrum, cumulus cells surrounding oocyte and tertiary follicles with large antria were observed (Fig. 4). Corpora lutea were also observed. Blood vessels and small amounts of loose connective tissue were observed in the medulla (Fig. 4A). In Group 2, the ovarian cortex was filled with developing follicles containing immature oocytes, cystic follicles were present and atretic follicles were found (Fig. 5). In Group 2, developing follicles, cystic follicles were observed in the cortex. In some follicles, the blood supply was increased. The granulosa cell layer was thin in large follicles. Lipid accumulation was detected in the granulosa cell cytoplasm of atretic follicles, as well as luteinization due to lipid accumulation in the ovarian stromal cell cytoplasm (Figs 4B and 5).
Haematoxylin–eosin staining of ovary sections. Group 1 (A), Group 2 (B), Group 3 (C) and Group 4 (D). Blue arrowheads: primordial follicle, primary follicle; black arrowheads: secondary follicle; red arrowhead: cystic follicle. Scale: 100 μm.

DHEA-treated mouse ovarian morphology. Impaired ovarian morphology, atretic follicles, follicular cysts and luteinization areas was observed. Black arrowheads: follicular cyst; red arrowheads: luteinization areas; blue arrowheads: follicular cysts. Scale: (A) 100 μm; (B) 50 μm; (C, D) 20 μm.

In Groups 3 and 4, follicles were observed in the process of differentiation, there were no follicles with large and increased blood supplies and they were similar to Group 1 (Fig. 4C, D, respectively). Granulosa and theca cells in follicles were found to be compatible with normal follicle differentiation process. Blood vessels and small amounts of connective tissue were detected in the medulla (Fig. 4C, D, respectively).
Gene expression analysis
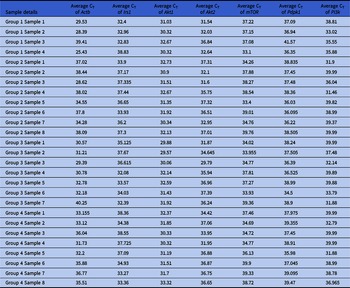
mRNA expression was successfully analyzed in ovarian tissues obtained from, in total, four mice in Group 1, eight mice in Group 2, seven mice in Group 3 and eight mice in Group 4 (Table 2). An endogenous housekeeping gene, Actb, was used for each mRNA analysis. All the genes investigated were expressed in the ovarian tissues of mice from the PCOS models as well as in the controls. The results of this study showed that the expression level of Akt1 was significantly different (P < 0.0001) between the ovarian samples of the control and the PCOS group, in which Akt1 was expressed at significantly higher levels in the control group. Furthermore, significant differences in the expression levels of Akt1 were also observed between the control group and both treatment groups, showing significantly higher expression in the control group (Group 3 and Group 4; P < 0.0001). Although there was no substantial difference between the expression levels of mTor in the control group and the PCOS mouse model, significantly higher expression levels of mTor were observed in the control group compared with the treatment group given the combination of metformin, pioglitazone and clomiphene citrate (Group 4). Significant differences in the expression levels of Pi3k between the control group and PCOS group (Group 2) and the treatment group given the combination of metformin, pioglitazone and clomiphene citrate (Group 4) were observed. In more detail, expression levels of Pi3k were higher in the control group compared with the treatment group (Group 4). There was no meaningful difference among the expression levels of Akt2, Irs and Pdpk1 in any of the groups analyzed (P > 0.05).
Real-time PCR results in terms of average CT values for each gene analyzed in each sample belonging to each group

Discussion
Polycystic ovary syndrome is a complex endocrine and metabolic disorder. Both environmental and genetic factors are believed to play a role in the pathogenesis of PCOS. Different pathways, such as AKT/PIK3 and AMPK, are believed to be involved in the development of PCOS. This study investigated the expression levels of genes involved in the PI3K/AKT signalling pathway in ovarian tissues obtained from mouse models of PCOS. Furthermore, the effects of metformin, pioglitazone and clomiphene citrate on the expression of these genes were also analyzed in ovarian tissues from the PCOS mouse models.
Cellular processes, including proliferation, survival, motility and other metabolic events, are controlled by many signalling pathways, such as the PI3K/AKT signalling pathway. Many receptor tyrosine kinases (RTK) have been shown to activate PI3K. Phosphorylation of PIP2 to PIP3 is catalyzed by PI3K, which then activates downstream kinases of Akt and Pdk1 to the membrane. Pdpk1 is involved in the phosphorylation and activation of Akt, which then promotes downstream mechanisms including BAX, BAD and p53 (Brown et al., Reference Brown, LaRocca, Pietruska, Ota, Anderson, Smith, Weston, Rasoulpour and Hixon2010; McLaughlin et al., Reference McLaughlin, Patrizio, Kayisli, Luk, Thomson, Anderson, Telfer and Johnson2011). The mTOR pathway is activated by Akt, which then induces synthesis of protein and growth of the cell (Wullschleger et al., Reference Wullschleger, Loewith and Hall2006). The PI3K/AKT pathway has been suggested to play a role in the migration of primordial germ cells during embryogenesis (Farini et al., Reference Farini, La Sala, Tedesco and De Felici2007; Gu et al., Reference Gu, Runyan, Shoemaker, Surani and Wylie2011). Furthermore, PI3K/AKT is important in primordial follicle development. PDK1 signalling has been shown to be important in the maintenance of primordial follicle growth (Reddy et al., Reference Reddy, Adhikari, Zheng, Liang, Hämäläinen, Tohonen, Ogawa, Noda, Volarevic, Huhtaniemi and Liu2009). Pdpk1 deletion led to lower levels of PDK1/AKT signalling mechanisms in oocytes that caused a decrease in the number of primordial follicles leading to premature ovarian failure (Reddy et al., Reference Reddy, Liu, Adhikari, Jagarlamudi, Rajareddy, Shen, Du, Tang, Hämäläinen, Peng, Lan, Cooney, Huhtaniemi and Liu2008). The fertility of Akt1 −/− mice has been shown to be lower due to the reduced granulosa cell proliferation or higher numbers of atretic follicles. Akt1 −/− mouse ovaries were shown to have multi-ovulatory follicles with higher estradiol levels and may indicate that it can have a role in cyst breakdown (Markholt et al., Reference Markholt, Grøndahl, Ernst, Andersen, Ernst and Lykke-Hartmann2012). Furthermore, Akt1 −/− mice had more atretic follicles with degenerate oocytes (Brown et al., Reference Brown, LaRocca, Pietruska, Ota, Anderson, Smith, Weston, Rasoulpour and Hixon2010). The results of this study showed that Akt1 expression was altered between the control mice and the PCOS mouse model, in which lower levels of Akt1 were expressed in the PCOS group. In more detail, significant differences following the treatment with metformin, pioglitazone and clomiphene citrate were shown to alter the expression levels of Akt. Furthermore, in the PCOS group (Group 2), cystic and atretic follicles were detected. Therefore, as in previously published studies, this suggested that the fertility issues in patients with PCOS could be due to abnormal Akt regulation, leading to the inability for granulosa cell proliferation and atresia of the follicles. One characteristic of PCOS is to have multiple follicles that are stimulated and arrested at the pre-antral stage; studies in mice have suggested that knockdown of Akt is associated with the presence of multi-ovulatory follicles (Markholt et al., Reference Markholt, Grøndahl, Ernst, Andersen, Ernst and Lykke-Hartmann2012). Altogether, the results of this study, as well as previously published studies, suggested that Akt may be involved in the anomalies of follicular development in patients with PCOS.
Few studies have investigated the expression levels of genes following PCOS treatment in mouse models. The division of oocytes, actin cap formation and the cortical granule free domain were all shown to change following rapamycin treatment. The localization of mTOR protein was reported to be around the spindle and in the cytoplasm of oocytes following this treatment (Lee et al., Reference Lee, Sun, Choi, Uhm and Kim2012). The results of this study showed that mTor expression levels differed between the control group and both treatment groups given metformin only (Group 3) or a combination of metformin, pioglitazone and clomiphene citrate (Group 4). In more detail, considerable differences in the expression levels of mTor between the control group and the PCOS mouse model and significantly higher expression levels of mTor were observed in the control group compared with the treatment group given the combination of metformin, pioglitazone and clomiphene citrate (Group 4). Similar results were also observed for Pi3k expression levels, in which significantly higher expression levels of Pi3k were observed in the control group relative to the treatment groups in Group 3 and Group 4, respectively.
Previously published data have shown that drugs, such as metformin, may have a inhibitory role on mTOR through modulating the insulin receptor/IGF1 receptor and Akt (Memmott et al., Reference Memmott, Mercado, Maier, Kawabata, Fox and Dennis2010). It is a possibility that Pi3k expression levels are changed due to drug administration. Therefore, differences in the expression levels of Pi3k may affect downstream targets, including Akt that may further alter the expression of mTor. Akt may be used as a target in the treatment of PCOS, as it has a direct effect on gluconeogenesis. Therefore, metformin, pioglitazone and clomiphene citrate seem to alter mTor expression levels and alter the downstream pathway including the Akt gene expression level. Therefore, extrapolation of these data may indicate that these treatment strategies have direct effects on the molecular regulation of PCOS through influencing the Pi3k, Akt and mTor expression patterns and it has the ability to directly affect follicular development.
To our knowledge, this is the first study to investigate the expression levels of a selected group of genes involved in the PI3K/AKT signalling pathway in mouse models of PCOS following different treatment regimens. Our study shed light into possible underlying mechanisms of PCOS and how different drugs may affect treatment modalities at the molecular level. Further studies on the molecular mechanisms investigating the same pathway are planned to further analyze epigenetic, as well as non-coding RNA, mechanisms.
Funding
This research project was funded by Near East University (SAG-2019-1-038).