


Introduction
Knowledge of glacier–climate relations is pertinent to several important questions. One is what historical glacier conditions indicate about past climates. Another is how glaciers might change under postulated future climates. The predicted global warming during the next decades is expected to have pronounced effects on glaciers and ice caps and lead to major changes in runoff magnitude and seasonality from glacierized areas (Reference Hock, Jansson, Braun, Huber, Bugmann and ReasonerHock and others, 2005). Many glaciers and ice caps in the Nordic countries are projected to almost disappear during the next 100–200 years (Reference JóhannessonJóhannesson and others, 2004).
Glaciers cover about 1% of the land in Norway, and many are situated in regions with considerable hydropower potential. Their importance for hydropower is reflected in the extensive measurement record. Mass-balance measurements have been conducted at 42 glaciers (Reference Andreassen, Elvehøy, Kjøllmoen, Engeset and HaakensenAndreassen and others, 2005). In southern Norway, eight of the glaciers have been measured continuously since at least 1988.
A model using upper-air wind, humidity and temperature was calibrated for ten glaciers in Norway and two in Sweden (Reference Rasmussen and ConwayRasmussen and Conway, 2005). The obtained model parameters are used here with US National Centers for Environmental Prediction and US National Center for Atmospheric Research (NCEP/NCAR) re-analysis data (Reference KalnayKalnay and others, 1996; Reference KistlerKistler and others, 2001). The re-analysis database is global in extent, has 6 hour temporal resolution, is free from missing observations and is maintained as an integral part of an ongoing major scientific enterprise. The mass-balance model was developed with data from South Cascade Glacier, Washington, USA, (48.4˚ N, 121.1˚ W), first for winter balance b w (Reference Rasmussen and ConwayRasmussen and Conway, 2001), then for summer balance b s (Reference Rasmussen and ConwayRasmussen and Conway, 2003).
The primary purpose of this analysis is to reconstruct the mass-balance record of each of seven glaciers in southern Norway prior to when it was measured back to 1949 and to estimate the uncertainty in the reconstructed values. We use an average of regression with the Storbreen record, which itself began in 1948, and results of the model using upper-air data. Another purpose is to determine the principal sub-periods of the full 1949–2005 series and to make a rudimentary comparison of the long-term changes with gross geometry of the glaciers.
Longer series of mass balance might be useful in estimating the influence a glacier had on stream-flow from 1948 until mass-balance measurements began. Because the series are constructed without using data from weather stations, they might be useful in investigating the relation between mass balance and those data. A third use might be as input to a glacier flow model that needs to include a longer series of mass balance in its calculations.
The re-analysis data begin on 1 January 1948, so 1949 is the first balance year that can be modeled from them. The 1949 b n is the change of mass from the end of summer 1948 until the end of summer 1949. Thus the 1949–2005 cumulative b n is the change of mass from 1948 to 2005.
Study Glaciers
The eight glaciers used in this study are all in southern Norway (Fig. 1) and have long-term mass-balance series (continuously at least from 1988). They constitute a west– east profile extending from the maritime Ålfotbreen to the continental Gråsubreen. There is a strong gradient in both summer and winter values along this profile (Table 1), with glaciers close to the coast in the west having much higher mass turnover than those farther inland. Mean winter (summer) balance of Gråsubreen is only one-fifth (one-third) of that of Ålfotbreen.
Locations of the eight glaciers (shaded in white) in southern Norway with long mass-balance records. See Table 1 for names.

Glacier area, altitude range, accumulation-area ratio, mean balance components over 1949–2005, and year of beginning of observations t 0

Mass-Balance Measurements
Mass balance is calculated by the stratigraphic method (Reference Østrem and BrugmanØstrem and Brugman, 1991), that is, between successive ‘summer surfaces’. Consequently, measurements describe the state of the glacier after the end of melting and before fresh snow starts to fall. Methods used to measure mass balance have changed little over the years. Winter balance, which is the accumulated snow during the winter season, is measured each spring by probing to the previous year’s summer surface at typically 50–150 sites on each glacier. Snow density is measured at one or two points. Summer balance is obtained from measurements at typically 5– 15 stakes. Further description of the methods and results from the Norwegian mass-balance measurements can be found in Reference Andreassen, Elvehøy, Kjøllmoen, Engeset and HaakensenAndreassen and others (2005) and in the annual Norwegian Water Resources and Energy Directorate (NVE) reports (e.g. Reference Kjøllmoen, Andreassen, Engeset, Elvehøy, Jackson and GiesenKjøllmoen and others, 2006).
Upper-Air Mass-Balance Model
Precipitation flux F is defined here as the product URH at 850 hPa, in which 0 ≤ RH ≤ 1 is relative humidity and U is the component of the wind in a specified critical direction ϕ ′. If U ≤ 0, then F is taken to be zero. Snow flux f equals F if the temperature interpolated at the altitude of the glacier terminus is less than +2˚C, and is zero if it is greater. Both F and f have units meters per second. Winter balance is estimated from

in which  is the October–May average of f. The * superscript distinguishes the model estimate from the observed quantity. Summer balance is estimated from

in which the June–September average of f is  , and that of temperature interpolated at the equilibrium-line altitude (ELA), considering only T > 0˚C, is
 . Averages in Equations (1) and (2) are formed by using the NCEP/NCAR values every 6 hours during the season. The model estimate of net balance is

For each glacier, 𝜙′ and linear regression coefficients α
w, γ
w, β
s and γ
s are determined to give the best match to observed b
w and b
s over the period of record of observations. The coefficient αs is set to  , where
 is the mean of
 over that period. Details are given in Reference Rasmussen and ConwayRasmussen and Conway (2005). Upper-air data are taken from the NCEP/NCAR re-analysis gridpoint nearest the glacier. Here we use 𝜙′ and the coefficients for each glacier with upper-air data prior to the calibration period to obtain
 back to 1949.
Reconstructed Balance Series
Reconstructed b n series consist of measured values for years when they exist, up to 2005, and estimated values when they do not, back to 1949. The estimated value is the average of the model estimate (Equation (3)) and the estimate from linear correlation with Storbreen, for which the observational record extends back to 1948. Over the observational record of each of the seven other glaciers, correlation with Storbreen estimates b n more accurately than the upper-air model does for four of them (3–5 and 7) and less accurately for three of them (1, 2 and 8). In all seven cases, however, an average of the two is more accurate than either of them alone (Table 2), and the average is used to reconstruct the b n series of all seven back to 1949.
Percent rand rms error Δm of upper-air model in estimating net balance. Error in estimating bn from linear correlation with Storbreen b n is Δ6 and from averaging it with the model estimate is Δm, 6. Correlations r 1 and r 2 are between combined reconstructed–observed b n(t) over 1949–2005 with principal components 1 and 2 of the eight series. Estimates Δ in ma–1w.e. Boldface r, r 2 significant at 99%

Cumulative balance before 2005 (Fig. 2) is defined by:
Cumulative net balance prior to 2005. Vertical scale is in water equivalent meters, and the error band is ±2. The pair of light vertical lines marks the 1989–95 period. The heavy vertical line indicates the beginning of observations. Glaciers 1–8 (see Table 1 for names) are numbered from west to east.


Here bj is the value of b n in year j, and B 2005 is defined to be zero. Cumulative series prior to 1963, all from reconstructed values except for Storbreen, are shown in more detail in Figure 3.
Cumulative net balance prior to 1963. Vertical scale is in water equivalent meters. Glaciers 1–8 (see Table 1 for names) are numbered from west to east.

As superbly analyzed by Reference Elsberg, Harrison, Echelmeyer and KrimmelElsberg and others (2001), a series formed by integrating each year’s mass-balance profile over that year’s glacier geometry combines the effects of both climate variations and geometry changes. To determine the effect of climate by correlating a published balance record with meteorological data requires removing the effect of changing geometry. This analysis is only slightly affected because the geometry of the glaciers here has changed little. For Storbreen, when the mean 1950–2002 b n(z) profile is integrated over hypsometries for 1997 and 1951 (Reference AndreassenAndreassen, 1999), the effect of the changing geometry is only 3.5 mma–1, or 0.2 m over 1948–2005, which is small compared with the total –15m change.
Reference Andreassen, Elvehøy and KjøllmoenAndreassen and others (2002) found that measured mass balances agreed with volume change determined from vertical aerial photography within a mean of 0.1mw.e. over the 30 year period ending in the mid-1990s for glaciers 5–7 and 0.2mw.e. for glacier 8. Because discrepancies of opposite sign tend to cancel out in forming multi-year means, the larger value Δobs = 0:3 is used for the uncertainty in individual years. For years when b n was measured, uncertainty Δ is taken to be Δobs mw.e., and for years when it was not,

in which Δm, 6 (Table 2) is the rms error of the estimate furnished by the average of the upper-air model and the Storbreen correlation.
On the assumption that errors in the combined reconstructed–observed series are uncorrelated from year to year, the uncertainty in the cumulative value Bj is

The cumulative curves in Figure 2 are shown with a ±2σband. If there are systematic errors in the b n series, however, the error in Bj will be larger.
There are three distinct sections in the combined reconstructed–observed series: prior to 1989; during 1989– 95, when the North Atlantic Oscillation (NAO) index was strongly positive; and after 1995. The NAO (Reference HurrellHurrell, 1995) is the normalized sea-level pressure difference between two stations, one in Iceland and one in the Azores or in Spain. Its principal characteristic is the latitudinal shift of the storm tracks and moisture transport over the North Atlantic (Reference Nesje, Lie and DahlNesje and others, 2000). In positive index modes, their path is across northern Europe and Scandinavia; in negative index modes, they have a more southerly path.
Means for these three sections of the combined series b w, b n and b s compared with the means over the full 1949–2005 period are shown for all eight glaciers in Figure 4. Means in the first section differ little from the 1949–2005 means because it is such a large part of the full period. During 1989–1995, the mean of b n was anomalously positive because b s was less negative than normal and because b w was much more positive than normal, reflecting increased accumulation and decreased ablation. Since 1995, the mean of b n was anomalously negative because the mean of b s was, whilst that of b w was nearly normal. The central period was chosen because measured mass balance was anomalously positive then (Reference Andreassen, Elvehøy, Kjøllmoen, Engeset and HaakensenAndreassen and others, 2005).
Departure from 1949–2005 mean of means in indicated sub-periods for the eight 1949–2005 reconstructed–observed b n series. For each component, for each sub-period, dots represent values for the eight glaciers. Long horizontal line is the mean departure of the glaciers (1, 3 and 5) with positive 1948–2005 cumulative change; short horizontal line is mean for the five glaciers with negative cumulative change. The 1949–2005 b n series measures the change from 1948 to 2005 because a year’s b n measures the change from the previous year. For the 1996–2005 b n the two means are the same.

Correlation of October–May NAO with b w is strong (Reference Rasmussen and ConwayRasmussen and Conway, 2005), with 42 < r 2 < 81% for western glaciers 1–5 and 22 < r 2 < 28% for eastern glaciers 6–8. Correlation of June–September NAO with b s, however, is negligible. Strongly negative b s after 1996 was concurrent with summer temperatures at four weather stations in southern Norway that were 0.8˚C higher than over 1970–96 (Fig. 5).
Mean May–September temperature averaged from four weather stations in southern Norway. Horizontal lines are mean values over three periods in Figure 4.

There is a general west to east variation of cumulative 1948–2005 mass change (Fig. 2), with the western, more maritime glaciers having gained mass, and more continental ones having lost it. Exceptions to this pattern are the western glacier Hansebreen (2) and the central glacier Austdalsb-reen (4). Hansebreen and Ålfotbreen (1) are adjacent, yet over 1948–2005 Ålfotbreen gained mass and Hansebreen lost mass.
What distinguishes the glaciers that gained mass (1, 3, 5) from the others is their contrasting geometries (Fig. 6). Gråsubreen (8), which is not used in the fit, is unusual; distributions of both accumulation and ablation are strongly dependent on glacier geometry and the mean db w/dz < 0 (Reference Rasmussen and AndreassenRasmussen and Andreassen, 2005). Glaciers losing mass had a disproportionately large area at the lower end of their altitude ranges, where the most negative part of the b n(z) profile operates. They also had shallower surface slope there, perhaps as an expression of the bed topography, which at most of the glaciers has not been determined. If true, because thickness is inversely related to surface slope, there would have been a disproportionately greater thickness there at the end of the Little Ice Age, so it would take longer to dispose of it.
1948–2005 cumulative change of eight reconstructed– observed b n series vs accumulation-area ratio (AAR). The straight line, which has rms = 4.3mw.e., is fit to only points 1–7. See Table 1 for glacier names.

The contrast between adjacent glaciersÅlfotbreen (1) and Hansebreen (2) is illustrated in Figure 7. Accumulation-area ratio (AAR) is 0.64 for Ålfotbreen and 0.29 for Hansebreen. The fraction δS of area in the lowest tenth of the altitude range is 0.7% for Ålfotbreen and 2.7% for Hansebreen. An additional difference between the two glaciers (Reference Elvehøy, Haakensen, Kennett, Kjøllmoen, Kohler and TvedeElvehøy and others, 1997) is that Ålfotbreen receives much more blown snow than Hansebreen. They are both north-facing outlet glaciers from the same ice cap. Because the ice cap is broader and has shallower slope above Ålfotbreen than above Hansebreen, more snow is available to blow onto Ålfotbreen than onto Hansebreen.
Area vs altitude and mean b n(z) profiles (Reference Rasmussen and AndreassenRasmussen and Andreassen, 2005) for Ålfotbreen (light lines; AAR = 0.64) and Hansebreen (heavy lines; AAR = 0.29). Circles indicate mean ELA.

In principal-components analysis of the eight 1949–2005 b n(t) series, the first component explained 78% of the variance, and the second 12%. Correlations of individual b n(t) with these components are shown in Table 2. The cumulative of the first component (Fig. 8) shows a moderate decline in the period prior to 1989, followed by a strong increase during 1989–95, when the NAO index was especially strong, and then a sharp decline after 1995.
Cumulative of first principal component of the eight 1949– 2005 reconstructed–observed b n series. No scale.

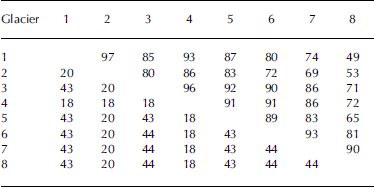
Despite the dissimilarity in 1948–2005 mass changes of the eight glaciers, their b n(t) series are strongly positively correlated (Table 3). This is because adding a constant to all members of a series does not change its correlation with another series. That is, if a series with zero mean has a constant added to all its members to create a second series, and a constant subtracted from all its members to create a third, the second and third series will be perfectly correlated, yet the cumulative of the second will have an increasing trend whilst that of the third will have a decreasing trend.
Glacier-to-glacier correlation r (%) of observed net balance b n (above diagonal), and number of years of common record (below). All r significant at 99%. See Table 1 for glacier names and period of observations
Conclusions
Applicability of the upper-air model to glaciers in southern Norway is consistent with its success in other regions: four glaciers in northern Norway and Sweden (Reference Rasmussen and ConwayRasmussen and Conway, 2005), five in Iceland (Reference RasmussenRasmussen, 2005), four in western North America (Reference Rasmussen and ConwayRasmussen and Conway, 2004) and three in Spitsbergen (Reference Rasmussen and KohlerRasmussen and Kohler, in press).
The principal finding of the reconstruction is that the period 1949–62 prior to mass-balance observations was statistically similar to the ensuing period 1963–88 up until the period of strongly positive NAO index. For none of the eight glaciers was there a significant difference in mean of b n, b w or b s between the two periods prior to 1989.
Records for all glaciers, observed for Storbreen and reconstructed–observed for the other seven, reflect remarkable coherence. The period of strongly positive NAO, 1989– 95, had anomalously positive b n due to weak b s and to strong b w. The period after that, 1996–2005, had anomalously negative b n due to strong b s, whereas b w was similar to prior to 1989.
In addition, 1948–2005 cumulative change was influenced by glacier hypsometry. Although glacier-to-glacier correlation of b n is strongly positive, for both the reconstructed series and also over the period of observations, the cumulative balance increased at three glaciers and decreased at five. At the three where it increased, AAR ≥ 0.64, whereas at the other five AAR ≤ 0.46.
Acknowledgements
This work was funded from US National Science Foundation grant OPP-0240861. We are grateful to A. Arendt, R. Hock and T. Jóhannesson for numerous suggestions, which led to a much improved paper. T. Tonning and Ø. Andersen made Figure 1.



