


1. Introduction
In the polar regions relatively small changes in thermal forcing can result in appreciable changes of sea ice in extent, concentration and thickness due to feedbacks associated with the coupled atmosphere and sca-icc effects such as winds, albedo and heat exchange between the ocean and atmosphere, and the way in which changes of sea ice in turn affect the climate regionally and globally. Observations have shown that a small but significant global warming occurred over the past century, possibly due to the increase ofgreenhouse gases (Reference Houghton, Callander and VarneyHoughton and others, 1996). The global sea-ice distribution and its variations have also been as-sessed since the beginning of the satellite era (1960s). However, although some sea-ice data were available over the longer time-scale from ship and aircraft observations and from coastal and island stations, the Antarctic sea-ice distribution was not well known prior to the 1960s (Reference ParkinsonParkinson, 1990), particularly because of its high inter-annual variability. Many modelling studies with coupled atmosphere-occan-sea-iee models have suggested that global warming due to the increase of greenhouse gases could be enhanced in polar regions because of feedback between climate and sea ice (e.g. Reference Manabe, Spelman and StoufferManabe and others, 1992; Reference CubaschCubasch and others, 1995; Reference MurphyMurphy, 1995). It is expected that sea ice may have been significantly more extensive, thicker and more compact a century ago than at present because of the slightly cooler climate at dial time. The atmospheric circulation could also differ from thai of the present, because the interactions between ice, atmosphere and ocean are the primary additional factors determining the climate and climatic change in the two polar regions, and thin ice and open water cause interactions between the ocean and atmosphere to be much more vigorous. A number of fully coupled atmosphere-ocean-sca-icc model simulations have been carried out to examine the global climate response to increasing green-bouse gases since last ccnturyfHoughton and others, 1996).
There are still a number of problems with the fully coupled model runs carried out so far. These include the need to include ocean-surface heat-flux corrections to avoid climatic drift; the problem of obtaining an accurate simulation of the present sea-ice distribution; and the long computation time which makes it difficult to carry out a large number of repeat simulations for sensitivity studies. in order to examine the roles öf the various individual components of the climate system in the possible changes over the recent period of increasing greenhouse gases, we use the results of a fully coupled model run (including the ocean) together with a large number of separate simulations with individual components prescribed to determine the effects of those different components alone. in this study we use the results from a long continuous transient simulation with the Common-wealth Scientific and Industrial Research Organisation fully coupled atmosphere-ocean sea-ice (CSIRO-AOS) model, from last century (1880) to the present, with increasing greenhouse gases, to assess the changes simulated in the Antarctic sea ice. Although this coupled model produces a reasonable representation of the present climate, a slight deficiency which is relevant to this study is that the amplitude of the annual cycle of the Antarctic sea ice in the model is too small, with too much sea ice remaining in summer. in order to assess the possible influence of this deficiency on the transient simulation of changes from last century, a series to separate sensitivity tests has been carried out, using the Melbourne University atmosphere sea-ice model (MUAS) (which produces a realistic seasonal cycle for the Antarctic sea ice) with prescribed sea-surface temperatures (outside the sea-ice zone). This allows us to assess the impact of the simulated change in sea-surface temperature alone on the change in sea-ice cover associated with the warming and the atmospheric circulation changes. The possible changes and feedbacks of other factors in the CSIRO-AOS model are also discussed to investigate the way in which global warming for the past century and possibly changes in the Antarctic sea ice may influence, and interact with the Antarctic and global climates.
2. Model Description
The atmospheric model we used here is the Melbourne University 21 wave (R21) 9 (sigma) level general circulation model (GCM). It has been shown to produce creditable simulations of climate both globally and in the polar regions (Reference SimmondsSimmonds, 1990).
The thermodynamic representation of the sea-ice model is similar to that of the Parkinson and Washington (1979) model or the Reference SemtnerSemtner (1976) “zero-layer” version model. There is one mixed layer in the ocean (50 m), one ice layer, one snow layer, and the atmospheric boundary layer is the lowest layer of the GCM. The boundary layer scheme is based on Monin-Obukhov similarity theory as described by Simmonds (1985). The application of this formulation to an ice-ocean mixture including the treatment of separate radiation balances for ice and water is given by Simmonds and Budd (1990). Changes of ice thickness and concentration in sea ice and/or snow are based on energy balances at the surface, ice/water interface and the leads area of the ice. A novel leads paramctcrisation for sea-ice freezing or melting was introduced, and the albedo for ice and snow is para-meterised as a function of ice thickness, snow depth and surface temperature (Wu and others, 1997 a). This scheme performs well in comparison with observations of Antarctic sea-ice albedo (e.g. Reference Allison, Brandt and WarrenAllison and others, 1993). The snow-accumulation rale is a function of solid precipitation, evaporation and melting, involving the surface air temperature of the GCM based on the method of Reference Legates and WillmottLegates and Willmott (1990) who estimated snow accumulation over the continents. in our atmosphere sea-ice model a simple ocean mixed-layer paramctcrisation is used over the sea-ice zone and neighbouring ocean gridpoints (Wu and others, 1997a).
The dynamics of the sea-ice model are similar to but slightly simpler than the “cavitating-fluid” version of the Reference Flato and HiblerFlato and Hibler (1992) model, with only the compressive stresses effective in the sea ice. At low ice concentration (for which the ice floes do not interact), the sea ice moves in free drift from atmospheric wind forcing, the 2% rule is applied (the Nansen rule for free ice drift) and a turning angle of 25° is incorporated which is to the left in the Southern Hemisphere (SH). The resistance of sea ice is considered at high concentrations of sea ice, and we include a parameterisation of the rafting processes, which is ice-thickness and open-water-fraction dependent (Reference Worby and WuWorby and Wu, 1998). This is modified from the model of Wu and others (1997a) in which the raiting processes are only open-water-fraction dependent.
The ice-model physical grid is identical to the physical grid of the Melbourne University GCM. Its resolution is approximately 3.3° x 5.6°. The simulated sea-ice distribution, including ice extent, concentration and thickness through the annual cycle, from the MU-AS model is quite reasonable compared to observations (Wu and others, 1997a). The model has also been used to demonstrate the response of the sea ice to different wind and thermodynamic forcing and to the recovery of the climate from imposed large sea-ice anomalies (Wu and others, 1996a, b, 1997b). in these experiments the sea-surface temperatures (SSTs) out-side the sea-ice zone are prescribed from climatology, and the sea-ice edge and concentration are derived from the heat balance including the sea ice with dynamics and the ocean mixed layer as described by Wu and others (1997a).
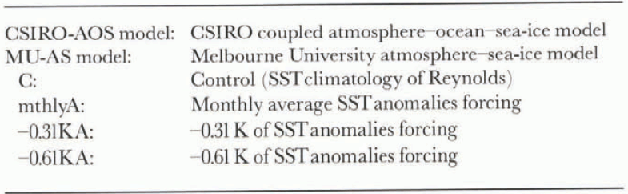
Models and experiments list
3. Numerical Experiments and Results
3.1. Experiments
In this study we examine the influence of global SST changes alone on the Antarctic sea ice for the past century. Using the current climatological SST distribution of Reynolds (1988) as forcing, a reasonable simulation of the Antarctic sea-ice distribution and global climate for the present was obtained. Further experiments were carried out as given in Table 1 with imposed global SSTanomalies, derived from the changes simulated by the CSIRO-AOS model (Reference Hirst, Gordon and O'FarrellHirst and others, 1996; Reference Gordon and O'FarrellGordon and O'Farrell, 1997), in which the equivalent CO2 is forced by the scenario of IS92a (Houghton and others, 1992) for the increase of total greenhouse gases, with starting value of 330 ppm (equivalent CO2 at 1880). Although the global and Southern Ocean temperature changes simulated by the CSIRO-AOS model, from last century to the present, were similar to the observed temperature changes, there is concern regarding the simulated changes of the Antarctic sea ice, because the model control climate resulted in too much sea ice remaining in summer. We therefore use the MU-AS model, which has a more realistic annual cycle, to examine the sea-ice changes to be expected from the temperature changes simulated by the CSIRO-AOS model. It is expected that a positive SSTanomaly may slow ice formation, and a negative SSTanomaly will speed up sea-ice formation, because of the interactions between the atmosphere and ocean. in our simulations the coupled atmosphere-sea-ice model was forced with
-
(1) the current climatological SSTs of Reynolds (1988) for the control climate (hereafter C)
-
(2) imposed global SSTanomalies from the present for the first decade following 1880 of the monthly average SSTanomalies (hereafter mthlyA), -0.31 K, the zonal-mean annual average anomaly which occurs at 57.5° S, just north of the sea-ice zone of the Southern Ocean (hereafter -0.31KA), and -0.61 K, the zonal-mean annual average anomaly at 59.6” S which is the averaged latitude for the sea-ice edge in September for the SH (about maximum in sea-ice coverage) simulated from the CSIRO-AOS model for the present (hereafter -0.61KA).
The value -0.61 is close to the observed global SST anomaly of the 1900s relative to 1990 (Houghton and others, 1996, p. 142, fig. 3.2). The GISST (U.K. Meïerological Office global sea-ice and SST) data (Reference Parker, Jackson and HortonParker and others, 1995) give -0.33 Κ for the mean SH SSTanomalies of 1881-90 relative to 1981-90 (without considering the sea-ice surface temperature change). It should be noted that when SST anomalies are applied, the SST is not allowed to be cooler than 271.2 Κ (the freezing point of sea water), i.e. no supercooled water is allowed in the model. If the imposed SSTanomaly derived a SST which is colder than 271.2 K, the SST is set at 271.2 Κ. All experiments were integrated for 6 years with the same initial conditions from an early quasi-cquilibrium simulation. The first 2 years' results are treated as adjustment, so the results shown here are from the 4 year average from year 3 to year 6.
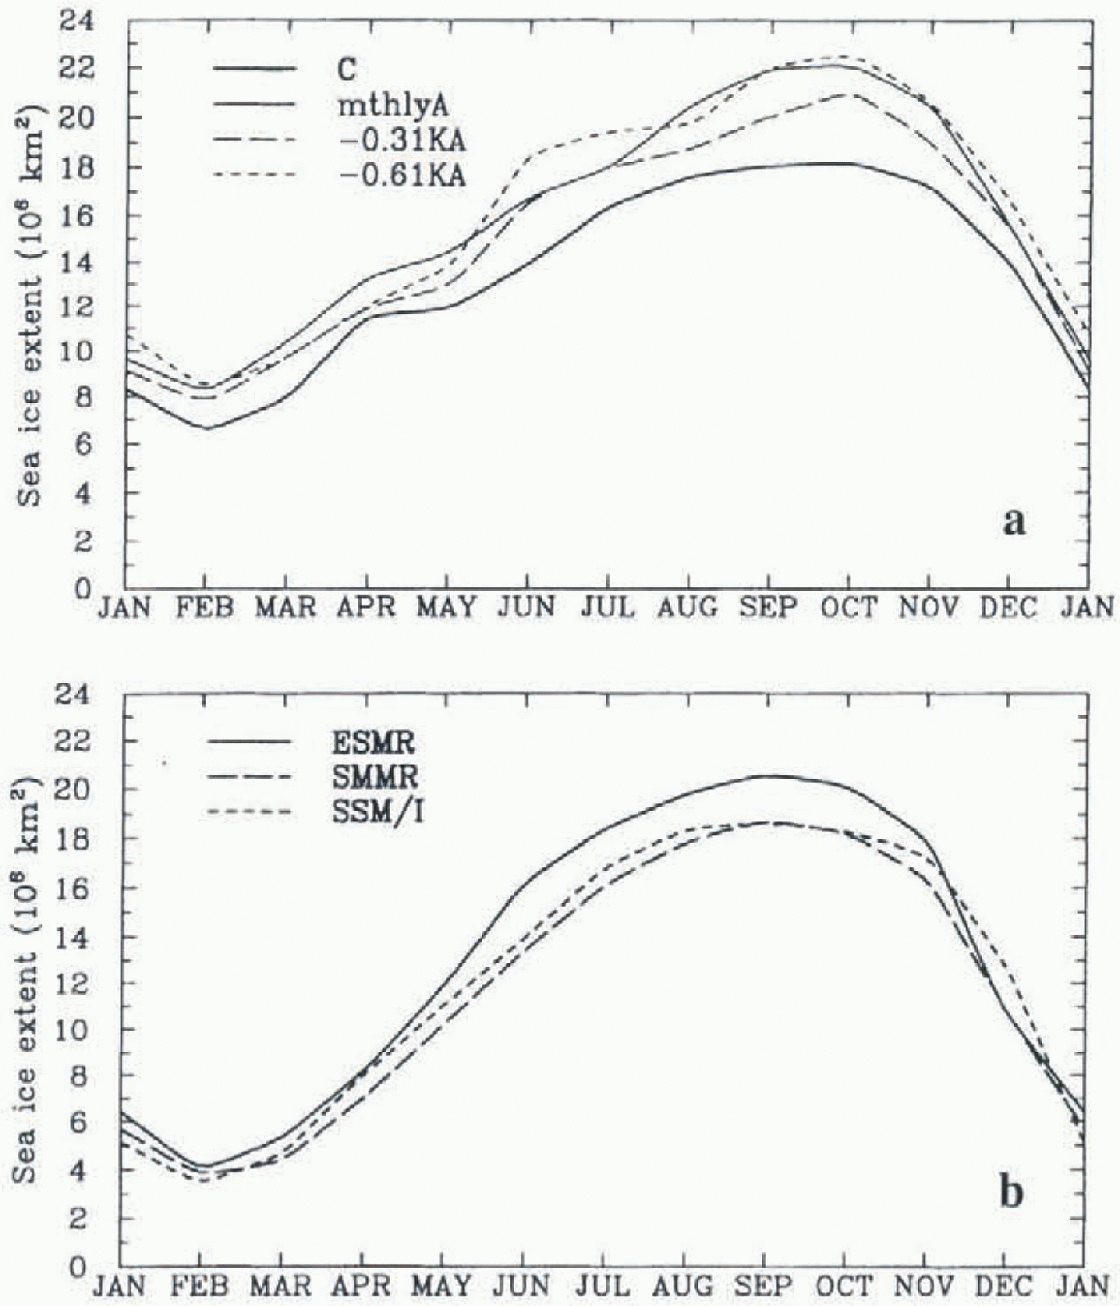
The seasonal cycle of (a) the simulated and (b) the observed sea-ice extent. The simulation is for the present control climate (C) and the imposed sea-surface temperature anomalies of (I) monthly mean (mthlyA), (2) -0.31 Κ (-0.31KA) and (3) 0.61 Κ (-0.61 KA).
3.2. Results
Figure la shows the seasonal cycle of the simulated sea-ice extent, which is defined as the area with sea ice present (including open water) for which each gridcell has at least 15% sea-ice concentration, for the SH. The observed sea-ice extent is shown in Figure lb from satellite observations of the electrically scanning microwave radiometer (ESMR; 1973-76) (Reference Zwally, Comiso, Parkinson, Campbell, Carsey and GloersenZwally and others, 1983), the scanning multichannel microwave radiometer (SMMR; 1978-87) (Reference Gloersen, Campbell, Cavalieri, Comiso, Parkinson and ZwallyGloersen and others, 1992) and the special sensor microwave imager (SSM/I; 1988-95) (Reference Watkins and SimmondsWatkins and Simmonds, 1998). It can be seen that the model produces a reasonable sea-ice coverage for Antarctic sea ice throughout the year in C compared with observations, apart from the slightly more extensive summer sea-ice extent. When the SST anomalies are imposed, sea ice becomes more extensive for all seasons, with a maximum increase in winter of about 4 X 10⁶ km2 (or 2° lat.), and a smaller corresponding increase in summer of about 2 x 10⁶ km2 (or 1° lat.), compared to that for the present climate simulation. The observed sca-icc extent shows some variations between the 1970s and 1980s or 1990s, but changes in the satellite systems and the ice-concentration algorithms over this period should also be kept in mind. Reference Jacka and BuddJacka and Budd (1998) and H.J. Zwally (personal communication, 1997) have concluded that the trend in Antarctic sea-ice extent over the period 1973-94 is close to zero, after correction for all factors affecting the derived sea-ice concentration. However, some studies have suggested possible sea-ice reduction from prior to the 1960s to recent times (e.g. Parkinson 1990; Reference De la MareDe la Mare, 1997). Parkinson (1990) made an assessment of the early-18th-19th-century ship observations in comparison with the ESMR epoch 1973-76. The results showed most observations fell with in the range expected from the ESMR epoch data, but with more cases showing greater than showing less exlent. A recent study, using data from the whaling records, by De la Marc (1997) suggested that although the sea-ice extent has not been reduced since 1973, there was a major reduction in average ice extent of about 5.5 x 10⁶ km2 (or 2.8°lat.) from the early 1950s to the mid-1970s. Given the uncertainty in these determinations and the high variability, the simulated changes in sea-ice extent are compatible with the reduction from those studies.
The seasonal cycle of the simulated (a) sea-ice concentration, (b) sea-ice thickness, and (c) sea-ice volume over sea-ice-covered areas of the present simulation for C, mthlyA, -0.31 KA and-0.61 h A.

Sea-ice thickness from the simulations in September for (a) Cand (b) mthlyA. Contours are in metres of 0.2,0.4,0.7, 1.0,1.5,2.0 and 3.0.

The annual cycle of the averaged sea-ice concentration, thickness and volume for C, mthlyA, -0.31KA and -0.61KA over the sea-icc-covered area of the control simulation is shown in Figure 2 for concentration (fig. 2a), thickness (fig. 2b) and volume (fig. 2c). Sea ice is more compact (by 5-10%) and thicker (by 10-15cm) in the simulation for a century ago than at present. Hence, sea-ice volume decreases in the model for all seasons over the past century, more in winter than in summer. The spatial distribution of sea-ice thickness in September (about maximum in sea-ice coverage) is shown in figure 3a for C and in figure 3b for mthlyA. It can be seen that the simulation is reasonable in C compared with the limited observations available (e.g. Reference Wadhams, Lange and AckleyWadhams and others, 1987), although sea ice may be loo thick over some coastal areas (such as East Antarctic). Sea ice is more extensive and thicker for mthlyA than for C.
With regard to the changes for sea-ice concentration, thickness and volume, the observational basis is even more inadequate to detect changes. First, the decrease in ice thickness from the modelling varies systematically with changes in the ice edge for the zonal mean and overall average around 10 15 cm, but the observational uncertainty for the present is still as large. For the ice concentration the uncertainly in the modern satellite-derived concentrations is about 5%. Furthermore, diere are problems in relating the satellite-derived concentrations to those compiled from ship- and aircraft-based observations. Nevertheless, the compilations from the U.S. Navy (Reference DanielDaniel, 1957) and the Russians (Reference TreshnikovTreshnikov, 1967) each show much larger fractions of the ice pack at maximum with concentrations greater than 90% compared with the concentrations derived from the satellite data. The question is whether this represents a real concentration difference or a difference due to the observational techniques.
Although there are many uncertainties from observations for sea-ice concentration, thickness and volume, the reasonable reduction of sea-ice extent simulated in the model gives us some confidence in the corresponding simulated change for sea-ice concentration, thickness and volume which influence the surface water balance. The reduction of sea-ice volume (due to the reduction of sea-ice extent, ice concentration and thickness) in the model is significant, with about 1-1.5 x 10¹²m3 (relative to 4 x 10¹² m3) in summer, and about 2-3 x 10¹² m3 (relative to 19 x 1012 m3) in winter.
Modelled changes in the zonal-mean annual average temperature structure of the atmosphere for (a) C relative to mthlyA from the MU-AS model with SST forcing and (b) 1981-90 relative to 1881-90 from the CSIRO-AOS model with greenhouse-gas forcing. The contour interval is 0.2 K.

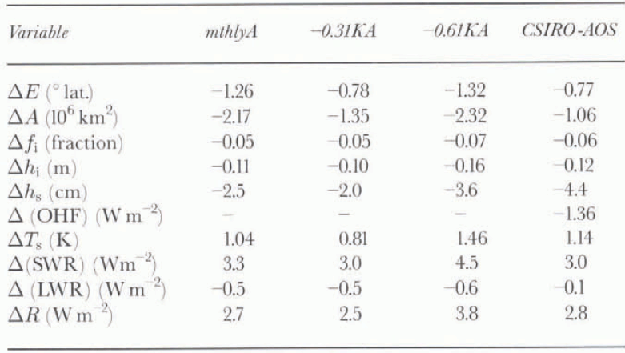
The change (Δ) of annually averaged (12 monthly mean) sea-ice extent (E), sea-ice area ( A), sea-ice concentration (f1), sea-ice thickness (hi), snow thickness (hs), oceanic heal flux (OHF), surface temperature Ts) shortwave radiation absorbed at surface (SWR), net longwave radiation at surface (LWR) and net radiation at surface (R) over the sea-ice-covered area (including leads) for the present relative to a century ago from the SST forcing of mthlyA, -0.31 KA and -0.61KA using the MU-AS model compared to that from the CSIRO-AOS model under greenhouse forcing
These changes have implications for climate change over the past century, since the change of sea ice affects the interaction between ocean and atmosphere, the atmospheric and oceanic circulation, including the Antarctic Bottom Water formation, and the ihermohaline circulation.
The modelled changes in the zonal-mean annual average temperature structure of the atmosphere for C from mthlyA are shown in figure 4a. Significant tropospheric warming is simulated from our model over the past century; slight cooling in the stratosphere has also been simulated but is primarily confined to the polar regions. The corresponding changes for the CSIRO-AOS model with green-house-gas increases is shown in figure 4b. This shows a similar tropospheric warming, but a universal cooling in the stratosphere. Observations have shown that for the past few decades the tropospheric warming and stratospheric cooling are evident (Houghton and others, 1996, p. 428, fig. 87(c)). These results provide additional support for the attribution of the observed changes to the increase in greenhouse gases. Although the reduction in stratospheric ozone as observed has been shown to result in stratospheric cooling, this is also primarily concentrated in the polar regions (Reference SanterSanter and others, 1996). Without greenhouse-gas changes, the observed universal stratospheric cooling cannot readily be reproduced in the climate model. The zonal componen! of the wind shows a slight reduction from last century to the present in the model for latitudes 5(J-70°S, but an increase between 30° and 50° S associated with the imposed SST warming for C relative to mthlyA. The change in the wind influences the sca-icc advection, but is small and only contributes slightly to the sea-ice change.
A summary of some of the most important changes from last century to the present obtained from the simulations with the M I -AS model with SST forcing is given inTable 2, which can be compared with the results from the CSIRO-AOS model under greenhouse forcing. The values of the variables from each of the models for the present climate are shown in Table 3.
The results are computed as annual means over the domain covered by the sea ice for the present regime as the sea-ice extent varies through the annual cycle. It can be seen that in most cases the responses of the sea ice are greatest for -0.61KA and smallest for -0.31 ΚA. in the MU-AS model simulation the change in mean extent of the sea ice (E) for the different simulations tends to vary in approximate proportionality with the changes in the mean surface temperature over the sea-ire region (Ts). This proportionality is about I° lat. Κ−1 which is close to the mean value obtained for observed inter-annual fluctuations of temperature and sea ice around Antarctica by Budd (1975). The changes are similar between the CSIRO-AOS simulation and mthlyA, except for sea-ice extent and area which are less for the CSIRO-AOS simulation. This might be partly due to the flux adjustment prescribed in the CSIRO-AOS model, seasonally and spatially varying but then maintained at those values for the climatic change simulations. The annual mean flux correction under the sea-ice zone for the CSIRO-AOS model is about 25 wm 2, which prevents climate drift but may also affect the rate of change of the sea-ice extent. For example, in the CSIRO-AOS model, too much sea ice remained in summer, and not enough in winter, and the seasonal cycle was slightly delayed in phase compared to observations not shown). The annual cycle amplitude of sea-ice extent is larger in the MU-AS model (closer to observations than that in the CSIRO-AOS model), and this is largely attributed to the combination of two particular paramctcrisation schemes, i.e. the partitioning scheme and the prognostic albedo scheme (Wu and others, 1997). This may also contribute to a greater sensitivity of the sea-ice coverage change to temperature change. Other differences in the models, including changes in oceanic heat flux (OHF), CO2 and cloud in the CSIRO-AOS model, which are all fixed in the MU-AS model, may also contribute small amounts to the difference in the sea-ice coverage change, and these effects are estimated below.
The values of the key variables in the two models for the present climate (from which the changes from last century to the present, shown in Table 2, were computed) are shown in Table 3. Generally, they show quite close agreement, considering the uncertainty in observed values.
In order to assess the sea-ice changes from the simulations in the MU-AS model, it is also necessary to consider the feedback effect of changes in the OH F and cloud which are kept fixed in the MU-AS model but vary interactively in the CSIRO-AOS model.
First, the effects of changing cloud in the CSIRO-AOS model were small. The annual mean cloud amount changed very little (<0.6%). However, there was a significant small average reduction during winter, with a corresponding small increase in summer. These changes,contributc a slight negative feedback to the warming in the CSIRO-AOS model, but with magnitudes small compared with the effects of the changes in temperature and sea ice.
Table 2. As in Table 2 but for present climate (12 monthly mean) from the MU-AS model and the CSIRO-AOS model

Secondly, the effect of the change in OHF, -1.36 Wm 2, in the CSIRO-AOS model, although small, cannot be neglected. Additional sensitivity studies show that this will cause an increase in annual mean ice extent of 0.08° in latitude, 0.4% in ice concentration and 0.03 m in ice thickness.
Finally, the relative effect on the sea-ice changes of changes in other factors such as surface pressure and winds was found to be very small.
Taking account of the effects of changing cloud and OHF in the CSIRO-AOS model, our best estimate for the expected mean change of sea-ice extent from last century is about 0.7-1.2° lat., most of which would have occurred over the last 40 years, which is compatible with but smaller than the sea-ice extent reduction derived from the whaling records by De la Marc (1997).
For the temperature changes, the CSIRO-AOS model shows larger increases from 1880 to the present over the Antarctic continent and the sea-ice zone (about 1.2 K) than for the Southern Ocean region further north (about 0.6 K). Meteorological station data for the Antarctic region over this period are limited. The records from the South Orkneys (on Laurie Island; 60°45'S, 315°17'E) go back to 1904. Laurie Island is located in the sea-ice zone, and in spite of very large inter-annual variability shows a warming of about 1.5 K, most of which has taken place over the last 40 years. The Antarctic station data primarily cover the period from the International Geophysical year (1957-58) to the present. Jacka and Budd (1991) found a mean rate of change for the Antarctic coastal stations (from a regression of the annual means) over the period to the late-1980s of 1.3 Κ (100 a−1). This was compared with a smaller rate of change for the mean of the Southern Ocean islands of 0.8 (K 100a−1). These differential rates of change for the different domains, the Southern Ocean, the sea-ice zone and the Antarctic continent, show reasonable agreement between the observations and the CSIRO-AOS model.
4. Conclusions and Outlook
The CSIRO-AOS model gives an increase in global mean surface temperature, due to increasing greenhouse gases, from last century to the present, of 0.7 Κ (0.6 Κ over the ocean including sea ice), which is comparable to the observed changes. The modelled temperature changes were less over the Southern Ocean (north of the sea ice) and more over the Antarctic continent and sea-ice regions, which is also in agreement with observations (Jacka and Budd, 1991). The CSIRO-AOS model simulation gave reductions in the mean Antarctic sea-ice cover as follows: approximately 0.8° lat. in extent, about 12 cm in ice thickness and about 6% in ice concentration. The CSIRO-AOS model, however, in its control climate, simulated somewhat too much Antarctic sea ice in summer and slightly less sea ice in winter, and hence has an annual cycle amplitude of sea-ice extent which is smaller than, and lagged behind, the observed. The MU-AS model, which simulates the annual cycle of sea-ice extent and concentration quite well, was used to examine the changes in sea ice from last century to the present, using the same SST changes, as derived by the AOS model, imposed as forcing. The resultant sea-ice changes gave reductions in mean extent of about 0.7-1.2° lat., ice thickness of about 7-13 cm and ice concentration of about 5-7%. The effect of additional feedbacks with in the CSIRO-AOS model, but not included in the MU-AS model, was found to be relatively insignificant except for OHF. This decreased with the warming from last century to the present by about 1.36 Wm % and the effect of this change on the sea ice has been assessed by independent sensitivity experiments. The differences between the simulations in sea-ice extent appear to be either due to the flux adjustments prescribed in the CSIRO-AOS model, which are fixed for the climatic-change simulations, or due to the larger annual cycle amplitude of sea-ice extent in the MU-AS model (closer to observations). This larger annual amplitude in the MU-AS model is largely attributed to the combination of two particular paramctcrisation schemes, including the partitioning scheme for ice freezing/melting in leads and the prognostic albedo scheme, both of which contribute to a greater sensitivity in sea-ice coverage change. Observations of sea-ice changes from last century to the present are hampered by the high variability of the sea ice and by the differences in techniques used to determine the climatological mean icc-cdgc locations. The simulated reduction in sea-ice extent is compatible with but smaller than that from a recent study of the change in sea-ice extent derived from whialing records by De la Marc (1997). Ice-thickness data are completely inadequate to assess changes of the order of 10 cm. For ice concentration the data are also very limited, but the model-derived reductions are not incompatible with the observations which provide some indication of a slight reduction but still with in the background variability and uncertainty of the data. Nevertheless the simulated changes are significant, and if they have occurred but have not been detected, due to the inadequacy of the data available, ihey may also have contributed to the climate change over the past century through the larger temperature changes over the Antarctic region than over the Southern Ocean.
Finally, for the simulation of future climate regimes the CSIRO-AOS model with greenhouse gases increasing according to the Intergovernmental Panel on Climate Change specification IS92a(Houghton and others, 1992) gives, by the end of next century, a reduction in Antarctic sca-icc volume of more than 50%. With the greater sensitivity for the decrease of Antarctic sea-ice extent obtained with the MU-AS model, the decrease of Antarctic sea-ice extent and volume by that time could be expected to be even larger along with the consequential similar larger reductions in salt flux and the production of Antarctic Bottom Water.
Acknowledgements
We would like to thank members of the Climate Modelling Program at the CSIRO Division of Atmospheric Research for developing the CSIRO fully coupled model and making it available to us, with particular thanks to A. C. Hirst and S. P. O'Farrell for assistance with running the model. Comments from N. L. Bindoff andJ.-O. Wolff at Antarctic CRC and two anonymous referees helped us to improve the paper.



