




No CrossRef data available.
Article contents
Homebodies and army brats: Some effects of early linguistic experience and residential history on dialect categorization
Published online by Cambridge University Press: 01 March 2004
Abstract
Early linguistic experience has been shown to affect speech perception in a variety of ways. The present experiment investigated the effects of early linguistic experience on dialect perception. Two groups of participants listened to sentences read by talkers from six American English dialects and were asked to identify where they thought the talkers were from using a forced-choice categorization task. We found that “army brats,” who had lived in at least three different states, performed better than “homebodies,” who had lived only in Indiana, in terms of overall categorization accuracy. Army brats who had lived in a given region also categorized talkers from that region more accurately than army brats who had not lived there. Clustering analyses on the stimulus-response confusion matrices revealed significant differences in the perceptual similarity spaces for the two listener groups. These results suggest that early exposure to linguistic variation affects how well listeners can identify where unfamiliar talkers are from.This work was supported by the NIH-NIDCD R01 research grant DC00111 and the NIH-NIDCD T32 training grant DC00012 to Indiana University. We would like to thank Caitlin Dillon for her assistance in selecting the talkers, Luis Hernandez for his technical advice and support, Robert Nosofsky for his assistance with the clustering analysis, and Adam Tierney and Jeffrey Reynolds for their help in collecting the data.
Information
- Type
- Research Article
- Information
- Copyright
- © 2004 Cambridge University Press
INTRODUCTION
Research in the fields of first- and second-language acquisition have repeatedly revealed the important relationship between speech perception and early linguistic experience (Bohn, 2000; Strange, 1995). Studies of infant speech perception have shown that children under six months of age are able to discriminate phonemic contrasts that are not present in their ambient language (Jusczyk, 1997). For example, 6-month-old infants who were raised in English-speaking environments could discriminate Czech alveolar trills and palato-alveolar fricatives (Eilers, Gavin, & Oller, 1982), Swedish front rounded and unrounded vowels (Kuhl, Williams, Lacerda, Stevens, & Lindblom, 1992), and Salish glottalized velar and uvular stops (Werker & Tees, 1984). Native English-speaking adults, however, have more difficulty making these discriminations (Polka, 1992, 1995) and infants appear to lose their ability to discriminate many nonnative contrasts in the first year of life (Aslin & Pisoni, 1980; Kuhl, 1993; Werker & Tees, 1984).
As a child is exposed to her native language, her perceptual abilities become tuned to the relevant phonological contrasts in that language. According to the attunement theory of language development, children are born with the basic sensory capacities to discriminate all possible phonemic contrasts in any language, but early linguistic experience shapes their perceptual abilities to enhance the relevant contrasts in their native language and attenuate the irrelevant contrasts (Aslin & Pisoni, 1980). The result of this process of attunement is that by one year of age, the child performs like adults on nonnative phoneme discrimination tasks and finds it extremely difficult to make phonemic contrasts that are not present in her first language (Flege, 1995; Polka, 1992, 1995). Kuhl (1993) has described this process of attunement as the result of a perceptual magnet effect in which children carve out phonetic categories based on their native language phonemic inventory and simultaneously become less sensitive to contrasts outside that inventory.
In contrast to these native-language constraints on the development of perceptual categories, early exposure to multiple languages has been shown to have long-lasting effects on adult speech perception. Polka (1992) conducted a study to assess the generalization of featural contrasts to nonnative segment contrasts. She found that early bilingual Farsi speakers were able to generalize the uvular-velar place distinction found in Farsi voiced stops to the same place distinction in Salish voiceless glottalized stops. Neither monolingual English speakers nor late bilingual Farsi speakers could discriminate the same pair of segments. These results suggest that mere exposure to multiple languages early in life may produce effects on speech perception abilities later in adulthood.
Early linguistic experience with a specific nonnative language may also produce lasting effects on perceptual abilities for phonemic contrasts in that language. Tees and Werker (1984) investigated the discrimination of the Hindi voiceless retroflexed stop and voiceless dental stop contrast in a number of different populations of listeners. They found that native English-speaking participants who had been exposed to Hindi in the first two years of life displayed high levels of discrimination accuracy, like native English infants and native English-speaking adults with five years of experience speaking Hindi. Native English-speaking adults with only one year of experience speaking Hindi and native English-speaking adults who received laboratory training on the contrast demonstrated performance at floor levels. Tees and Werker concluded from these results that early exposure to a specific linguistic contrast leads to the maintenance of the ability to perceive the contrast, even in the absence of further exposure or reinforcement. This conclusion is also consistent with Aslin and Pisoni's (1980) theory of perceptual attunement, which permits the maintenance of a perceptual ability even in the absence of any feedback.
Most of the research on the effects of linguistic experience on speech perception has investigated the perception of individual segmental contrasts. However, Allen (1983) showed that the effects of linguistic experience are present in prosodic development, as well. He obtained both cross-sectional and longitudinal evidence for the loss of the perceptual ability to detect lexical stress distinctions in certain trisyllabic forms by French-speaking 4- and 5-year-olds. German- and Swedish-speaking children of the same age showed no such loss in discrimination ability. The critical difference between the French children and the German and Swedish children was that the stress contrast under examination occurs in German and Swedish, but not in French. Once again, these results reveal that children lose the ability to make distinctions that are not relevant in their native language as a normal part of development.
In addition to these studies, other researchers have shown that cultural experience shapes the perception of personality traits in vocal features (Peng, Zebrowitz, & Lee, 1993). Peng et al. found that American listeners rated American talkers who spoke faster as more powerful and more competent than talkers who spoke slower. Korean listeners, on the other hand, rated Korean talkers with tense voices as more powerful than talkers with more relaxed voices. Korean listeners in the United States, however, rated louder American talkers as more competent, and tense Korean voices as more powerful.
These results reveal that exposure to linguistic and cultural associations with voice types has an effect on the perception of indexical properties of speech, such as personality traits. Spoken language perception and linguistic experience seem to be intimately linked at various levels of language processing, from linguistic properties like features (Polka, 1992), segments (Tees & Werker, 1984), and suprasegmentals (Allen, 1983), to indexical properties of the talker (Peng et al., 1993). The goal of the present study was to examine the relationship between early linguistic experience and the perception of another indexical property of speech, dialect variation. In particular, this study investigated the role of residential history on the perception of regional dialect variation in American English.
Dialect categorization has been studied by sociolinguists, and more recently by speech perception researchers, using a number of different methodologies and stimulus materials. In one recent study, Purnell, Idsardi, and Baugh (1999) used the matched-guise technique to investigate the racial and ethnic dialect identification abilities of landlords in the San Francisco area. They found that the landlords were able to identify the dialect of the talker, based only on a short answering machine message over the telephone. Preston (1993) used a matching task to explore regional dialect identification by Michigan and Indiana adults. The stimulus materials in his study were short samples of spontaneous speech from nine middle-aged male talkers representing nine different cities on a north-south continuum between Michigan and Alabama. Preston found that his listeners were able to make only broad distinctions between northern and southern talkers.
Using an eight-alternative forced-choice categorization task, Williams, Garrett, and Coupland (1999) asked Welsh adolescents to categorize other Welsh adolescents by regional dialect after they listened to samples of short narratives. Williams et al. found that the adolescents were about 30% accurate in making their responses. Clopper and Pisoni (in press) conducted a similar six-alternative forced-choice categorization task in which they asked undergraduates in Indiana to categorize talkers by regional dialect of American English using read sentence materials. Like Williams et al., we also found that the listeners were about 30% accurate in making their categorization judgments. The low dialect categorization accuracy scores reported by Williams et al. and Clopper and Pisoni suggest that the forced-choice categorization task is difficult for naïve listeners, despite performance levels that are above chance.
Effects of residential history have been documented in a number of studies that have explored the perception of dialect variation. For example, Williams et al. (1999) found that Welsh school teachers performed much better than the Welsh schoolboys on the same dialect categorization task. Although they did not carry out a statistical comparison of the two groups, Williams et al. presented data that suggested that the teachers performed the task with approximately 52% accuracy, compared to the adolescents' 30% accuracy. Williams et al. attribute this difference in performance to the teachers' travel and teaching experiences, which the schoolboys lacked. Williams et al. also found that the schoolboys were more accurate (45%) in categorizing talkers from their own region than talkers from the other regions (24%). This finding suggests that even the limited linguistic experience of adolescents is enough to differentially affect their performance on a dialect categorization task.
In a recent study using sentences from unfamiliar talkers, Clopper and Pisoni (in press) did not find any differences in accuracy based on the residential history of their listeners, but they did find differences in the dialect perceptual similarity spaces of the listeners based on whether they were from northern Indiana, southern Indiana, or had lived out of state. In particular, a clustering analysis of the stimulus-response confusion matrices revealed that the three groups of listeners demonstrated consistent differences both in the perceived structure of the perceptual similarity spaces and in the perceptual distances between the different dialects. This pattern suggests that early linguistic experience affects how dialect variation is encoded and represented in memory and used in explicit categorization tasks.
Similarly, in his study of dialect identification, Preston (1993) found differences between Indiana and Michigan listeners in the location of where they perceived the major north–south dialect boundary to be. The Michigan listeners heard the north–south boundary between Indiana and Kentucky, whereas the Indiana listeners heard the boundary to be between Kentucky and Tennessee. Preston (1986, 1989) also reported differences based on residential history in how undergraduates draw and label dialect maps of the United States and in their judgments about where “correct” and “pleasant” English is spoken. Taken together, all of these results suggest that early linguistic experience based on residential history may produce large effects on how listeners perceive and categorize dialect variation.
In a related study, Niedzielski (1999) reported the results of an experiment in which listeners' perception of vowel quality was manipulated based on their beliefs about the talker. In particular, she asked participants from Detroit to listen to sentences and then try to match the vowel quality of the final word in the sentence to one of six synthetic vowel tokens. One group of listeners was told that the talker was from Detroit; the other group was told that the talker was from Canada. The listeners in the Canadian group selected the actual matching vowel tokens, whereas the Detroit group selected canonical vowels as the best match. Niedzielski's results suggest that perception is affected not only by actual linguistic experience with dialect variation, but also by the beliefs a listener has about the talker and where the talker may come from.
The goal of the present study was to further investigate the role of early linguistic experience on dialect categorization performance by explicitly manipulating the residential history of the listeners. In particular, two groups of listeners with very different residential histories were recruited from undergraduate psychology classes. The listeners were asked to carry out the same six-alternative forced-choice categorization task used in the earlier study by Clopper and Pisoni (in press). One group of listeners (i.e., “homebodies”) had lived exclusively in the state of Indiana; the other group of listeners (i.e., “army brats”) had lived in three or more different states by the time they were 18 years old.
We predicted that the listeners who had lived in different states and been exposed to greater linguistic variation would perform better on the categorization task than the listeners who had lived in only one state. Based on the findings reported by Williams et al. (1999), we also predicted that army brats who had lived in a given region would be more likely to correctly categorize the talkers from that region than army brats who had not lived in that region. Finally, we expected to replicate the pattern of results revealed in the earlier clustering analysis reported by Clopper and Pisoni (in press), which showed that listeners with different residential histories have structurally different perceptual similarity spaces of dialect variation. Unlike the listener groups in Clopper and Pisoni's study that were defined post hoc after the study was completed, the listeners in the current study were specifically recruited to meet criteria for two objectively defined groups based on residential history.
METHODS
Talkers
Sixty-six talkers were selected from the TIMIT Acoustic-Phonetic Continuous Speech Corpus (Fisher, Doddington, & Goudie-Marshall, 1986; Zue, Seneff, & Glass, 1990). The TIMIT corpus contains recordings of 630 talkers reading 10 sentences each. The documentation accompanying the TIMIT corpus provides the age, gender, and ethnicity of each talker, as well as a regional dialect label. The eight dialect labels used to identify talkers on the TIMIT corpus were: New England, North, North Midland, South Midland, South, West, New York City, or Army Brat. The 66 talkers in the present study represented six of these regions, with 11 talkers from: New England, North, North Midland, South Midland, South, and West. To control for as many other variables as possible, all of the talkers in this study were white males who were between the ages of 20 and 29 at the time of recording.
Stimulus materials
The stimulus materials consisted of three meaningful English sentences for each talker. Two of the sentences were those read by all 630 talkers on the TIMIT corpus. These two “calibration sentences” were originally designed to elicit dialect variation (Fisher et al., 1986; Zue et al., 1990). They are shown in (1) below. In addition, a third sentence was selected for each talker to ensure that a different sentence was read by each talker and that no sentence was ever repeated during the course of the experiment. Examples of these novel sentences are shown in (2).
(1) a. She had your dark suit in greasy wash water all year.
b. Don't ask me to carry an oily rag like that.
(2) a. Beg that guard for one gallon of gas.
b. A huge tapestry hung in her hallway.
Each sentence for each talker was copied into an individual sound file which was segmented to include only speech materials using Syntrillium's CoolEdit 96. The sound files were then leveled to 55 dB using Level16 (Tice & Carrell, 1998) and stored digitally for later playback to listeners in the experiment.
Listeners
One hundred and six Indiana University undergraduates (44 males and 62 females) were recruited to serve as listeners for this study. The listeners were recruited to meet one of two residential history requirements: either the listener must have lived his or her entire life in Indiana or he or she must have lived in at least three different states. All of the listeners received partial course credit for their participation. Prior to the final analyses, data from 43 listeners were removed: three were bilingual, 14 were below chance on all three phases of the experiment, 22 did not meet the residential history requirements for either listener group, three had a history of a speech or hearing disorder, one was outside the age distribution of the rest of the population, one had a nonnative English-speaking parent, and one set of data was lost because of technical difficulties.
The remaining 61 listeners (27 males and 34 females) were all monolingual native speakers of American English whose parents were also native speakers of American English. None of the listeners reported a history of a hearing or speech disorder at the time of testing and all performed statistically above chance on all three phases of the experiment. The listeners ranged in age from 17 to 22, with a mean age of 19.0 years.
Thirty-one of the 61 listeners had lived exclusively in the state of Indiana. They comprised the “homebodies” group. The remaining 30 listeners had lived in at least three different states and comprised the “army brats” group. The army brats did not need to have lived in three different states by any specific age to participate. However, given that all of the participants in this study were undergraduates at a large midwestern university, the army brats had all lived in three or more states before the age of 18.
To analyze the effects of residency1
Throughout this article, the term “residency” is used to refer to whether or not a given participant lived in a particular region. The residency variable, therefore, distinguishes between those army brats who have lived in a certain dialect region from those who have not lived there. The term “residential history” is used to refer to all of the places that a given participant lived. Residential history is the variable that distinguishes the army brats from the homebodies.

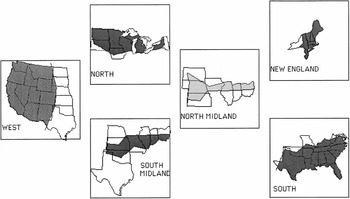
The six response alternatives in the categorization task (from Clopper & Pisoni, in press).
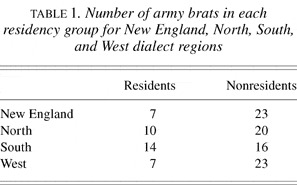
Number of army brats in each residency group for New England, North, South, and West dialect regions

Procedure
The listeners were seated in front of personal computers equipped with a mouse and a pair of Beyerdynamic DT100 headphones. The six response alternatives were displayed on the computer screen as 2″ × 2″ icons depicting the six dialect regions. The icons were partial maps of the United States in which the dialect region was shaded and each icon was labeled with the name of the region. Figure 1 shows the six icons as they were arranged on the screen. The response icons were displayed on the screen prior to beginning the experiment and the listeners were encouraged to familiarize themselves with the six regions.
The experiment consisted of three phases. In the first phase, the listeners heard all 66 talkers reading the first calibration sentence. The second phase was identical to the first, except that the listeners heard all of the talkers reading the second calibration sentence. In the third phase, the listeners heard each of the talkers reading a different, novel sentence. The talkers were presented in a different random order for each listener in each of the three phases. On each trial, the listeners heard a sentence one time and were asked to listen to it carefully and then to select the region on the screen that they thought the talker was from by clicking on the icon with the mouse. No feedback was given about the accuracy of the responses during any phase of the experiment.
RESULTS
Categorization performance
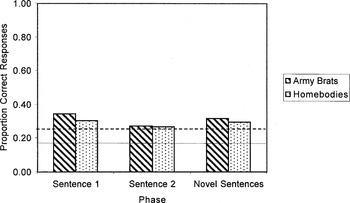
Overall performance on the categorization task was, as expected, barely above chance for both groups of listeners on all three sentences. Figure 2 shows the proportion of correct responses for each listener group on each of the sentences. A 2 × 3 repeated measures ANOVA on listener group (army brats or homebodies) and sentence (first, second, or novel) revealed significant main effects of listener group and sentence (F(1,181) = 5.32, p < .05 and F(2,180) = 10.54, p < .001, respectively). The listener group × sentence interaction was not significant. The army brats performed better than the homebodies overall, but planned post hoc t-tests revealed a significant listener group difference only for the first calibration sentence (t(59) = −2.04, p < .05). Post hoc Tukey tests showed that performance on the first sentence and the novel sentences was significantly better than performance on the second sentence (p < .01 for both). Scores on the first sentence and the novel sentences were not significantly different.

Proportion of correct responses on each phase of the categorization task by the two listener groups. Chance performance (17%) is indicated by the solid line. Performance significantly above chance (25%) is indicated by the dashed line.
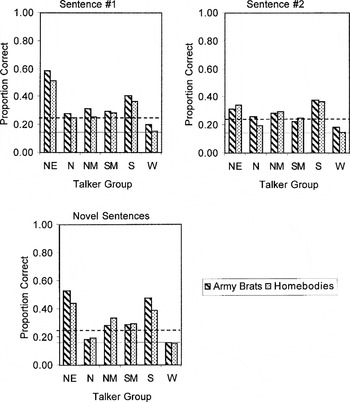
To determine the effects of talker dialect on categorization performance, a 2 × 3 × 6 ANOVA on listener group (army brats or homebodies), sentence (first, second, or novel), and talker group (New England, North, North Midland, South Midland, South, or West) was conducted. All three main effects were significant: F(1,1096) = 5.71, p < .05 for listener group, F(2,1095) = 11.76, p < .001 for sentence, and F(5,1092) = 88.17, p < .001 for talker group. Again, the army brats performed significantly better than the homebodies overall. Post hoc Tukey tests on the sentence variable again revealed that performance on the first sentence and the novel sentences was significantly better than performance on the second sentence (p < .01 for both). Performance on the first sentence and novel sentences did not differ from each other.
Post hoc Tukey tests on talker group revealed that performance on the sentences from the New England talkers was significantly better than performance on the other groups of talkers (p < .01 for all comparisons). Performance on the sentences from the Southern talkers was significantly better than performance on all of the groups except New England (p < .001 for all comparisons). Performance on the sentences from the North Midland and South Midland talkers was significantly better than performance on the Northern and Western groups (p < .05 for all comparisons). Finally, performance on the sentences from the Northern talkers was significantly better than performance on the Western group (p < .01). Performance on the North Midland and South Midland talkers was not significantly different. The only significant interaction was the sentence × talker group interaction (F(10,1086) = 6.02, p < .001). This interaction was mainly a result of the increased performance on the sentences from the New England talkers on the first and novel sentences over the second sentence for both listener groups. Figure 3 shows the performance of each listener group for each talker group on each sentence.

Proportion of correct responses on each phase of the categorization task for each talker group by the two listener groups. Chance performance (17%) is indicated by the solid line. Performance significantly above chance (25%) is indicated by the dashed line.
Effects of residency on categorization performance
A 2 × 3 × 4 ANOVA on residency (resident or nonresident), sentence (first, second, or novel), and talker group (New England, North, South, or West) was conducted on the army brat listeners only to evaluate the effects of residency on dialect categorization. Overall, residents performed better than nonresidents, as revealed by a significant main effect of residency (F(1,358) = 13.57, p < .001). The main effects of sentence and talker group were also significant (F(2,357) = 1.38, p < .001 and F(3,356) = 55.45, p < .001, respectively). Post hoc Tukey tests on the sentences again revealed that categorization performance on the first sentence and the novel sentences was better than performance on the second sentence (p < .05 for both). The difference between the first and novel sentences was also not significant. Post hoc Tukey tests on the talker groups revealed that performance on New England and Southern talkers was significantly better than performance on Northern and Western talkers (p < .001 for all comparisons), but that differences between performance on New England and Southern talkers and between Northern and Western talkers were not significant. The only significant interaction was the sentence × talker group interaction (F(6,352) = 6.33, p < .001), again because of the large differences in performance for both residency groups on the New England talkers across the three sentence conditions. Figure 4 shows the proportion of correct responses for residents and nonresidents for the four talker groups not found in Indiana on each of the three sentences.

Proportion of correct responses on each phase of the categorization task for each talker group by the two residency groups. Data reflect only the responses of the army brat listener group. Chance performance (17%) is indicated by the solid line. Performance significantly above chance (25%) is indicated by the dashed line.
Perceptual similarity spaces
Stimulus-response matrices were constructed for each listener group for each sentence based on the responses collected in the perceptual categorization task. To determine the structure of these confusions, the 6 × 6 matrices were submitted to the Similarity Choice Model (SCM; Nosofsky, 1985) which returned similarity and bias parameters for each confusion matrix. The similarity parameters indicate the degree of perceptual similarity between any two dialect regions. That is, they provide a measure of how similar two dialects sound to a given listener group. The bias parameters indicate the degree of listener response bias for each of the dialect regions and provide some indication of whether or not listeners were selecting one response alternative more frequently than the others.
Examination of the bias parameters revealed that neither of the two listener groups was biased to select one response alternative over the others for any of the three phases of the task. The goodness-of-fit of the full SCM solution was compared to the goodness-of-fit of a restricted SCM solution in which the similarity parameters were held constant across both listener groups for each sentence and across all three sentences for each listener group. The goodness-of-fit values of the restricted models were all significantly worse than the goodness-of-fit values of the full models, suggesting that the structure of the similarity spaces for the two listener groups was significantly different.
The matrices resulting from the full SCM solutions for each of the two listener groups for each of the three sentences were then submitted to an additive clustering scheme,2
An additive clustering scheme was selected because of the high degree of reciprocity between the six regions. For example, South was most often confused with South Midland and vice versa. This kind of reciprocity is well-modeled by clustering analyses. In addition, other spatial analyses, such as multidimensional scaling, were inappropriate for this data given the small size (6 × 6) of the data matrices.

Clustering solutions for the army brats and homebodies on each phase: Sentence #1 (A), Sentence #2 (B), and Novel Sentences (C).
Two basic structural patterns are displayed in these six solutions. In one pattern, New England is by itself, South and South Midland cluster together, and the remaining three regions (North, North Midland, and West) form the third cluster. This clustering pattern is found in the solutions for the army brats for the first sentence and for both listener groups for the novel sentences. In the other pattern, New England and North cluster together, South and South Midland cluster together, and North Midland and West form the final cluster. This set of clusters is found in the solution for the homebodies for the first sentence and for both groups of listeners for the second sentence. Therefore, for the first sentence, the two groups of listeners reveal perceptual similarity spaces that differ in structure. For the army brats, Northern talkers cluster with North Midland and Western talkers on Sentence 1, but for the homebodies, the Northern talkers cluster with the New England talkers. For the second and novel sentences, however, the differences between the army brats and homebodies are represented in the perceptual distances between the different dialects and not the structure of the clusters themselves.
These results suggest that regardless of prior residential history, both groups of listeners use three broad dialect categories for American English regional varieties: New England; South and South Midland; North Midland and West, with Northern talkers falling into a cluster with New England or with North Midland and Western talkers, depending on the linguistic content of the utterance. The difference between the perceptual similarity spaces of the army brats and the homebodies lies in the discriminability of the different dialects. Given that the army brats performed better in terms of accuracy than the homebodies, we can conclude that the army brats were better able to discriminate the six different dialects than the homebodies. This difference in discrimination is also revealed in the subtle differences in the dialect similarity spaces uncovered by the clustering analysis of the perceptual confusions.
DISCUSSION
All three of our original predictions were confirmed by this study. First, the army brats demonstrated better overall performance on the dialect categorization task than the homebodies. Like the school teachers in the Williams et al. (1999) study, the army brats in the present study were able to benefit from their greater exposure to linguistic variation in making their categorization responses in this forced-choice categorization task. These results are consistent with the findings in the language acquisition literature that more diverse early linguistic experience leads to better performance on a wide range of speech perception tasks (Polka, 1992; Tees & Werker, 1984). General exposure to language variation either in the form of different languages (as in Polka, 1992) or different dialects (as in the present study) seems to have lasting effects on the perception of linguistic and indexical properties of spoken language.
It should be noted here that most of the second-language acquisition work with adults on the perception of nonnative segmental contexts has typically involved the use of both identification and discrimination tasks (e.g., Polka, 1992, 1995). The present study only required participants to make perceptual categorization judgments. The listeners were never directly asked to discriminate differences between talkers of different dialects. A dialect discrimination task using paired-comparison methods is an essential next step in this research on the effects of early linguistic experience on the perception of indexical properties of speech. Converging evidence from such a discrimination task for the relationship between exposure to variation and the perception of variation would provide further support for the claim made here that early exposure to multiple regional dialects affects a listener's ability to perceive linguistic variation.
Second, specific experience with a given variety also produces effects on speech perception, as demonstrated by the results of the residency comparisons within the army brat group. We found that a history of residence in a given region led to better categorization performance on talkers from that region. This result supports the finding by Williams et al. (1999) that Welsh schoolboys could better categorize talkers from their own region than those from other regions. The division of the army brats into resident and nonresident groups was based only on whether or not the listeners had lived for any period of time in New England, North, South, or West. Factors such as how long they lived there or at what age they lived there were not taken into consideration. The robust finding that residents performed better than nonresidents on categorizing talkers from a given region suggests that exposure to variability matters and that prior experience with linguistic variation shapes speech perception. These results are consistent with the finding that early linguistic experience with a specific segmental contrast has lasting effects on speech perception (Tees & Werker, 1984). Early experience with linguistic variation appears to have lasting effects on perceptual dialect categorization abilities even in young adults like those studied here.
Although age and length of residency were not controlled in developing our criteria for residency within the army brat group, the fact that all of our participants were younger than 23 years old means that the relevant linguistic experience with dialect variation had to have occurred at a fairly early age. In his study of dialect acquisition, Chambers (1992) found that children as old as 17 could acquire some new dialect features in production, suggesting that they were also able to perceive dialect differences between native and nonnative dialects. In addition, Bohn and Flege (1997) found that differences in nonnative perceptual skills were based more on the amount of experience than on the age of acquisition. However, Bond and Adamescu (1979) found a monotonic relationship between age and discrimination ability of a nonnative contrast in a study on English-speaking children (4-year-olds), adolescents (11–13-year-olds), and adults, although the difference between the adults and the adolescents was not statistically significant. Future studies of the effects of exposure to linguistic variation should consider such issues as critical periods and length of residency more carefully and obtain quantitative measures of these variables, because they have been shown to be relevant in related work on the contribution of linguistic experience, age of acquisition, neural development, and perceptual abilities to performance in these behavioral tasks (Bailey, Bruer, Symons, & Lichtman, 2001).
Finally, in addition to our findings on differences in categorization performance based on residential history, the responses obtained in this study were also submitted to a clustering analysis, which revealed structural differences in the perceptual similarity spaces of the army brats and homebodies. The SCM and ADDTREE analyses revealed spatial differences between the army brats and the homebodies in how they perceive and represent the similarities between the dialect regions. These differences in perceptual similarity were found mainly in the degree of perceptual distance between the different dialects. Overall, both the army brats and the homebodies appeared to use three major dialect clusters: New England; South and South Midland; North Midland and West. Northern talkers were grouped perceptually with the New England talkers or with the North Midland and Western talkers, depending on sentence context.
These three broad dialect clusters correspond closely to the three major regional dialects of American English that Labov (1998) defined based on his acoustic analyses of vowel productions: North, South, and West. These three clusters are also similar to the three major perceptual clusters reported in Clopper and Pisoni (in press) and the major north–south perceptual boundary reported by Preston (1993).
Although the main differences in categorization performance between the two listener groups were related to perceptual distance, two other findings were consistent across all of the clustering solutions. First, the South branch of the South/South Midland node was always longer than the South Midland branch of this node, suggesting that the sentences from the Southern talkers were more discriminable and perceptually distinct from the other dialects than those from the South Midland talkers. Second, the New England branch was always the longest individual branch on the trees, suggesting that the New England dialect was also very perceptually distinct. The fact that our listeners perceived New England and Southern talkers as being the most distinct is not surprising. Preston (1986, 1989) gave groups of undergraduates maps of the United States with state boundaries and asked them to draw and label the places where they thought people speak differently. He found that his participants, who were undergraduates in Michigan, Indiana, and Hawaii, almost always indicated an area that they labeled as South and an area in the northeast labeled variably as New York City, East Coast, or New England. Thus, the Southern and Northeastern varieties of American English are clearly both perceptually and culturally salient for naïve listeners, regardless of what experimental methodology is used to assess performance.
CONCLUSIONS
The results of the present study confirm that early linguistic experience based on residential history affects performance on a perceptual dialect categorization task. In particular, we found that undergraduate listeners who had been exposed to different dialects through childhood residence in multiple states performed better on a forced-choice dialect categorization task than listeners who had lived in only a single state all of their lives. In addition, the perceptual similarity spaces of the dialects, derived from the stimulus-response confusion matrices, were different based on residential history. A division of the army brat listener group into residents and nonresidents for each of the dialect regions further confirmed that specific exposure to a given dialect leads to better categorization performance on talkers from that dialect. These results are consistent with reports in the infant speech perception and language acquisition literature, which shows that early linguistic experience with segmental and suprasegmental contrasts before the critical period of language learning affects the perception and discrimination of those sound contrasts later in life.
References
REFERENCES
Allen, George D.
(1983).
Linguistic experience modifies lexical stress perception.
Journal of Child Language
10:535–549.Google Scholar
Aslin, Richard N., &
Pisoni, David B.
(1980).
Some developmental processes in speech perception. In
G. Yeni-Komshian,
J. F. Kavanaugh, &
C. A. Ferguson (eds.),
Child phonology, volume 2: Perception.
New York:
Academic Press.
67–96.
Bailey, Donald B., Jr.,
Bruer, John T.,
Symons, Frank J., &
Lichtman, Jeff W. (eds.).
(2001).
Critical thinking about critical periods.
Baltimore:
Paul H. Brookes.
Bohn, Ocke-Schwen.
(2000).
Linguistic relativity in speech perception: An overview of the
influence of language experience on the perception of speech sounds
from infancy to adulthood. In
S. Niemeier &
R. Dirven (eds.),
Evidence for linguistic relativity.
Amsterdam:
John Benjamins.
1–28.
Bohn, Ocke-Schwen, &
Flege, James Emil.
(1997).
Perception and production of a new vowel category by adult second
language learners. In
A. James &
J. Leather (eds.),
Second-language speech: Structure and process.
New York:
Mouton de Gruyter.
53–73.
Bond, Z. S., &
Adamescu, Linda.
(1979).
Identification of novel phonetic segments by children, adolescents
and adults.
Phonetica
36:182–186.Google Scholar
Clopper, Cynthia G., &
Pisoni, David B.
(in press).
Some acoustic cues for the perceptual categorization of American
English regional dialects.
Journal of Phonetics.
Corter, J. E.
(1995).
ADDTREE/P program for fitting additive trees.
New York:
Columbia University.
Eilers, Rebecca E.,
Gavin, William J., &
Oller, D. Kimbrough.
(1982).
Cross-linguistic perception in infancy: Early effects of linguistic
experience.
Journal of Child Language
9:289–302.Google Scholar
Fisher, William M.,
Doddington, George R., &
Goudie-Marshall, Kathleen M.
(1986).
The DARPA speech recognition research database: Specifications and
status.
Proceedings of the DARPA Speech Recognition Workshop.
93–99.
Flege, James Emil.
(1995).
Second language speech learning: Theory, findings, and problems. In
W. Strange (ed.),
Speech perception and linguistic experience: Issues in
cross-language research.
Timonium, MD:
York Press.
233–277.
Jusczyk, Peter W.
(1997).
The discovery of spoken language.
Cambridge, MA:
MIT Press.
Kuhl, Patricia K.
(1993).
Early linguistic experience and phonetic perception: Implications
for theories of developmental speech perception.
Journal of Phonetics
21:125–139.Google Scholar
Kuhl, Patricia K.,
Williams, Karen A.,
Lacerda, Francisco,
Stevens, Kenneth N., &
Lindblom, Björn.
(1992).
Linguistic experience alters phonetic perception in infants by 6
months of age.
Science
255:606–608.Google Scholar
Labov, William.
(1998).
The three English dialects. In
M. D. Linn (ed.),
Handbook of dialects and language variation.
San Diego:
Academic Press.
39–81.
Niedzielski, Nancy.
(1999).
The effect of social information on the perception of
sociolinguistic variables.
Journal of Language and Social Psychology
18:62–85.Google Scholar
Nosofsky, Robert.
(1985).
Overall similarity and the identification of separable-dimension
stimuli: A choice-model analysis.
Perception and Psychophysics
38:415–432.Google Scholar
Peng, Ying,
Zebrowitz, Leslie A., &
Lee, Hoon Koo.
(1993).
The impact of cultural background and cross-cultural experience on
impressions of American and Korean male speakers.
Journal of Cross-Cultural Psychology
24:203–220.Google Scholar
Polka, Linda.
(1992).
Characterizing the influence of native language experience on adult
speech perception.
Perception and Psychophysics
52:37–52.Google Scholar
Polka, Linda.
(1995).
Linguistic influences in adult perception of non-native vowel
contrasts.
Journal of the Acoustical Society of America
97:1286–1296.Google Scholar
Preston, Dennis R.
(1993).
Folk dialectology. In
D. R. Preston (ed.),
American dialect research.
Philadelphia:
John Benjamins.
333–378.
Purnell, Thomas,
Idsardi, William, &
Baugh, John.
(1999).
Perceptual and phonetic experiments on American English dialect
identification.
Journal of Language and Social Psychology
18:10–30.Google Scholar
Strange, Winifred.
(1995).
Cross-language studies of speech perception: A historical review.
In
W. Strange (ed.),
Speech perception and linguistic experience: Issues in
cross-language research.
Timonium, MD:
York Press.
3–45.
Tees, Richard C., &
Werker, Janet F.
(1984).
Perceptual flexibility: Maintenance or recovery of the ability to
discriminate non-native speech sounds.
Canadian Journal of Psychology
38:579–590.Google Scholar
Tice, R., &
Carrell, T.
(1998).
Level16 v.2.0.3.
University of Nebraska.
Werker, Janet F., &
Tees, Richard C.
(1984).
Cross-language speech perception: Evidence for perceptual
reorganization during the first year of life.
Infant Behavior and Development
7:49–63.Google Scholar
Williams, Angie,
Garrett, Peter, &
Coupland, Nikolas.
(1999).
Dialect recognition. In
D. R. Preston (ed.),
Handbook of perceptual dialectology.
Philadelphia:
John Benjamins.
345–358.
Zue, Victor,
Seneff, Stephanie, &
Glass, James.
(1990).
Speech database development at MIT: TIMIT and beyond.
Speech Communication
9:351–356.Google Scholar
The six response alternatives in the categorization task (from Clopper & Pisoni, in press).
Number of army brats in each residency group for New England, North, South, and West dialect regions
Proportion of correct responses on each phase of the categorization task by the two listener groups. Chance performance (17%) is indicated by the solid line. Performance significantly above chance (25%) is indicated by the dashed line.
Proportion of correct responses on each phase of the categorization task for each talker group by the two listener groups. Chance performance (17%) is indicated by the solid line. Performance significantly above chance (25%) is indicated by the dashed line.
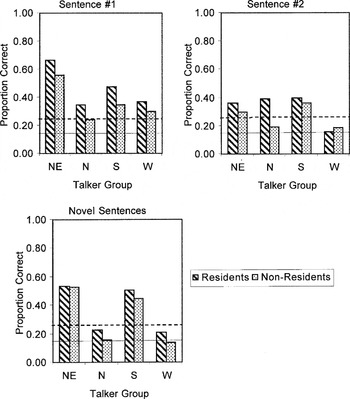
Proportion of correct responses on each phase of the categorization task for each talker group by the two residency groups. Data reflect only the responses of the army brat listener group. Chance performance (17%) is indicated by the solid line. Performance significantly above chance (25%) is indicated by the dashed line.
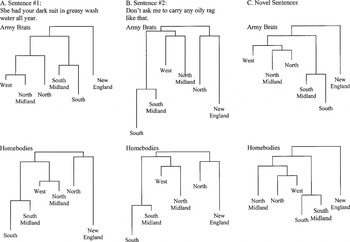
Clustering solutions for the army brats and homebodies on each phase: Sentence #1 (A), Sentence #2 (B), and Novel Sentences (C).
 You have
Access
- 91
- Cited by