In the present experiment we studied how bilinguals’ and monolinguals’ Stroop performance unfolds over time. According to the bilingual advantage hypothesis (Bialystok, Reference Bialystok1999), bilinguals have enhanced cognitive function, including greater inhibiting ability. The bilingual advantage hypothesis states that lifelong bilingualism enhances executive control (Bialystok, Reference Bialystok1999; Bialystok, Craik & Luk, Reference Bialystok, Craik and Luk2012). Moreover, the argument is that bilinguals inhibit better than monolinguals, in both language-related and non-verbal tasks (Bialystok & Martin, Reference Bialystok and Martin2004), and that these effects have a neurological basis (Abutalebi, Della Rosa, Green, Hernandez, Scifo, Keim, Cappa & Costa, Reference Abutalebi, Della Rosa, Green, Hernandez, Scifo, Keim, Cappa and Costa2012). Nevertheless, there is a debate in the literature regarding these effects. A number of studies have reported null effects of bilingualism across different executive control tasks (De Bruin, Traccani & Della Sala, Reference De Bruin, Treccani and Della Sala2014; Duñabeitia, Hernández, Antón, Macizo, Estévez, Fuentes & Carreiras, Reference Duñabeitia, Hernández, Antón, Macizo, Estévez, Fuentes and Carreiras2014; Costa & Sebastián-Gallés, Reference Costa and Sebastián-Gallés2014; Paap & Greenberg, Reference Paap and Greenberg2013). One goal of the present investigation is to study these apparently contradictory findings.
Inhibition and conflict monitoring
Inhibition and conflict monitoring are two possible explanations for the bilingual advantage. The idea that bilinguals use inhibition to control their language systems comes from the Inhibitory Control Model (Green, Reference Green1998). According to Abutalebi and Green (Reference Abutalebi and Green2007), bilinguals’ ability to select the intended language is the consequence of a dynamic process involving cortical and subcortical structures that make use of inhibition. More recent accounts have raised the possibility that conflict monitoring is at the root of these effects. Costa, Hernandez and Sebastián-Gallés (Reference Costa, Hernández and Sebastián-Gallés2008) argued that bilingual participants are more efficient at resolving conflicting information, and thus when the task recruits sufficient monitoring resources, bilinguals outperform monolinguals. In low-monitoring situations, a bilingual advantage fails to emerge (Costa, Hernández, Costa-Faidella & Sebastián-Gallés, Reference Costa, Hernández, Costa-Faidella and Sebastián-Gallés2009). Bialystok (Reference Bialystok2010) wrote about these effects “beyond inhibition” and concluded that a bilingual advantage emerges in tasks that require executive processing components for conflict resolution even when no inhibition appears to be involved. Hilchey and Klein (Reference Hilchey and Klein2011) reviewed the literature and found bilinguals typically outperform monolinguals on congruent and incongruent trials, often by similar magnitudes, and argued that bilinguals enjoy a widespread cognitive advantage across different assessment tools. Taken together, these results indicate that the bilingual advantage not only emerges in the incongruent trials (inhibition), but also in the congruent trials (conflict monitoring) of the Stroop task.
Bilingual Stroop and Mouse Tracking
In order to investigate conflict monitoring further, we compared two bilingual groups and one monolingual group. The rationale for using two bilingual groups was to better understand how different levels of conflict monitoring influence performance. We used a bilingual variation of the Stroop task in which the stimuli could be in English (target trials) or Spanish (distractors). Participants in the high conflict group were English–Spanish bilinguals. For these participants, both languages were active, resulting in higher levels of monitoring. Participants in the low conflict bilingual group were English–Other bilinguals (their other language was anything except Spanish). As in the original color-naming task (Stroop, Reference Stroop1935), participants were instructed to ignore the content of the word (or letters) and focus on the color; all participants clicked on the color for all stimuli, English and Spanish trials. There were three conditions: control (xxxx in blue), congruent (blue or azul in blue), and incongruent (yellow or amarillo in blue). In the incongruent condition, participants need to inhibit the automatic process of reading in order to click on the color. Importantly, the bilingual advantage should not only emerge in the incongruent trials (inhibition), but also in the congruent trials (conflict monitoring).
A particularly novel aspect of the present study is that we investigated these effects using mouse tracking (Spivey, Grosjean & Knoblich, Reference Spivey, Grosjean and Knoblich2005). To our knowledge, this is the first study to investigate the impact of bilingualism on the executive control system by tracking manual responses of participants. In mouse-tracking, hand movements are used to make inferences about cognitive processes (Spivey et al., Reference Spivey, Grosjean and Knoblich2005). The ways participants move a mouse are thought to reflect underlying mental processes. Previous research has largely focused on comparing the RTs of bilinguals and monolinguals, with some studies reporting faster RTs for bilinguals – and other studies reporting no difference between bilinguals and monolinguals. We sought to explore whether or not differences would be obtained between bilinguals and monolinguals using mouse tracking, and if so, to determine whether the difference is quantitative (e.g., bilinguals are faster overall) or qualitative (e.g., bilinguals process information differently).
Conflicting findings
Regarding the bilingual advantage, “serious concerns have been raised about the robustness and reliability of the reported cognitive effects of bilingualism” (Costa & Sebastián-Gallés, Reference Costa and Sebastián-Gallés2014, p. 342). Moreover, Paap and Greenberg (Reference Paap and Greenberg2013, p. 256) concluded that “the research findings testing for bilingual advantages in executive processing do not provide coherent and compelling support for the hypothesis that the bilingual experience causes improved executive processing.” In addition to these criticisms, publication bias favoring studies with positive results might be generating a false sense of reliability for this effect. According to De Bruin et al. (Reference De Bruin, Treccani and Della Sala2014), studies challenging the bilingual advantage are least likely to be published. These authors reviewed conference abstracts from 1999 to 2012, and did not find differences in sample size, tests or statistical power between the published and unpublished studies. The crucial determinant to get published was whether the results supported or not the bilingual advantage. De Bruin et al. (Reference De Bruin, Treccani and Della Sala2014) concluded that all data should be reported. The practice of only publishing results that support a particular theory can hinder the field from moving forward.
The results of several studies have challenged the assumption of bilingualism having a clear beneficial effect on executive processes (Antón, Duñabeitia, Estévez, Hernández, Castillo, Fuentes, Davidson & Carreiras, Reference Antón, Duñabeitia, Estévez, Hernández, Castillo, Fuentes, Davidson and Carreiras2014; Paap & Liu, Reference Paap and Liu2014). For example, an experiment by Duñabeitia et al. (Reference Duñabeitia, Hernández, Antón, Macizo, Estévez, Fuentes and Carreiras2014) investigated inhibitory skills in a large sample of monolingual and bilingual children. These authors concluded that bilingual children do not exhibit any specific advantage in simple inhibitory tasks. In Duñabeitia and colleagues’ experiment the dependent variable was RT. One possible explanation for the conflicting findings related to the presence or absence of a bilingual advantage is that bilinguals may have a qualitatively different processing style that could elude detection by RT measures. Bilinguals may wait longer to initiate a response and then respond faster, in which case an advantage would only be detected using RT measures when the benefits of faster responding outweigh the delay in initiating a response. We argue that the use of mouse tracking to explore these effects will allow us to determine whether there are quantitative (bilinguals are faster overall) or qualitative (bilinguals have a different way of processing) differences between bilinguals and monolinguals.
Experts
You are at the plate, the pitcher is getting ready, you concentrate on the ball, you see the ball leaving the pitcher's hands, you wait a moment. . .. The moment between seeing the ball and initiating the swing takes longer for professional baseball players than novices. Professional hitters spend more time assessing the circumstances before beginning their swing; this extra time allocated to “reading the pitch” ultimately leads to better performance (Ranganathan & Carlton, Reference Ranganathan and Carlton2007). In an eye-tracking experiment, expert baseball players were compared to novices while viewing a baseball pitch (Shank & Haywood, Reference Shank and Haywood1987). Experts fixated the anticipated release point, and then, after approximately 150ms following release, moved their eyes to the oncoming ball. Novices moved their eyes before the pitch was released. Furthermore, Ranganathan and Carlton (Reference Ranganathan and Carlton2007) found that experts’ swing time was approximately 50ms shorter than that of novices. These results indicate that professional hitters extend the initial assessment phase before initiating a response, but then respond more efficiently. This processing style (take a moment to start, then perform better) is a qualitatively different way of performing a task. Importantly, this processing style has been found for experts across many different domains.
The strategy of delaying the initiation of a response has been shown to improve performance in a number of settings. First, in golf putting movement times of experts were longer at the beginning, and shorter later on (Sim & Kim, Reference Sim and Kim2010). Second, there is evidence that expert soccer goalkeepers wait longer before initiating a response, but their performance is better (Sanchez, Sicilia, Guerrero & Pugnaire, Reference Sanchez, Sicilia, Guerrero and Pugnaire2005). Finally, this expertise effect is not limited to sports. In a dynamic tactical scenario, the time spent assessing the situation was significantly longer for high-experience marines compared to low-experience marines. However, once assessment was complete, the selection of a course of action was significantly faster for the high-experience group, resulting in overall better performance (Kobus, Proctor & Holste, Reference Kobus, Proctor and Holste2001). The relevant conclusion from the expertise literature is that experts are more efficient than novices, in part because they allocate their time differently. Expertise results in a qualitatively different way of responding that maximizes performance.
Experts across many different domains take longer to initiate a response, but then outperform novices. We argue that bilinguals are experts in the context of dealing with conflicting input, since they are frequently managing two or more languages. Indeed, expertise could be the heretofore unidentified mechanism at the root of the bilingual advantage. The prediction derived from the expertise literature is that bilinguals will behave in a qualitatively different way from monolinguals. In particular, bilinguals will allocate their time differently, taking longer to initiate a response but then outperforming monolinguals. Importantly, these effects would be more pronounced for those bilinguals in high conflict situations, such as in the incongruent condition and for the English–Spanish group.
Method
Participants
In a previous Stroop experiment using mouse tracking (Incera, Markis & McLennan, Reference Incera, Markis and McLennan2013), Cohen's d was 1.6; with desired power of 0.8 and an alpha level of 0.05, a sample of 16 participants per group would suffice. We recruited 20 participants per group. Therefore, 60 young adult participants, with no history of visual impairment, were recruited from the Cleveland State University Psychology Department participant pool, and received research participation credit in psychology courses. There were three groups of 20 participants: English monolinguals, English–Spanish bilinguals, and English–Other bilinguals. There were no age differences (M = 22 years, SD = 4 years) between the three groups, F(2, 59) = 1.31, MSE = 40.65, p = .28. The English–Other bilingual group included participants who spoke English and another language that was not Spanish (Japanese, Korean, Vietnamese, Bengali, Russian, Arabic, Polish, Chinese, Albanian, Romanian, Tagalog, Portuguese, Gujarati and French).
Based on Tse and Altarriba (Reference Tse and Altarriba2012), participants rated (0% to 100%) how closely their English proficiency was relative to native speakers. All participants were fluent (M = 90%, SD = 17) and the groups were equivalent in English proficiency. Second, participants also rated what percentage of their time they usually speak English. Group differences emerged in language usage. Participants in the monolingual group (M = 100%, SD = 2) spoke English more often than participants in the English–Spanish (M = 85%, SD = 19) or English–Other (M = 79%, SD = 17) bilingual groups. Importantly, English usage was equivalent between the two bilingual groups. Third, significant group differences emerged in age of English acquisition. Participants in the monolingual group acquired English earlier (M = 0, SD = 4) than participants in the English–Spanish bilingual group (M = 4, SD = 4). The English–Other bilingual group acquired English significantly later (M = 7, SD = 4) than both the monolingual and the English–Spanish groups.
Stimuli
Following Klein (Reference Klein1964), we used four color words (BLUE, GREEN, RED, YELLOW). Each color word was presented in Spanish and English. Following Roelofs (Reference Roelofs2010), we used eight congruent pairings (e.g., Spanish ROJO–red), and 24 incongruent pairings (e.g., Spanish ROJO–blue). Each participant responded to a total of eight practice and 80 experimental trials. First, the practice trials included two trials each of red, green, yellow and blue color patches (Roelofs, Reference Roelofs2010). Second, the 16 experimental control trials consisted of four trials each of a series of X’s, M’s, H's or S's (e.g., XXXX), presented in a separate block at the beginning of the experiment. Finally, there were four experimental conditions (congruent-Spanish, congruent-English, incongruent-Spanish, and incongruent-English) with 16 trials each.
For each language, there were 16 trials in the incongruent condition (e.g., red or rojo in the color blue) and 16 in the congruent condition (e.g., red or rojo in the color red). After the control trials, the experimental block included the random presentation of the English and Spanish congruent and incongruent trials, in order to maximize conflict in the English–Spanish bilingual group. All participants named the color of the word for all stimuli in both English and Spanish. Importantly, the Spanish trials were not included in the final analysis; their only purpose was to act as “distractors” for the Spanish group, while being irrelevant for the other two groups. The analysis only focuses on the English target stimuli, the language known by participants in all three groups.
Design
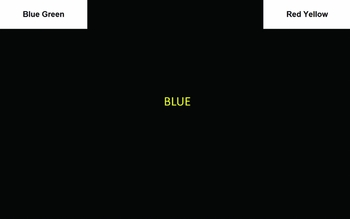
There was one between-participants factor (Group: English monolinguals, English–Spanish bilinguals, English–Other bilinguals), and one within-participants factor (Stroop: congruent, incongruent, control). Paired response alternatives (“BLUE GREEN”; “RED YELLOW”) appeared in the top left and right corners of the screen (see Figure 1). These paired response alternatives were color words written in black that appeared in the top left and right corners. In the incongruent condition the two response options were always in different response alternatives (e.g., blue in color green was not presented in the version of the experiment where the “Blue Green” pair was used as a response alternative). Out of 24 possible combinations of four colors in the response alternatives, the following four were used: “Blue Green” and “Red Yellow” (as shown in Figure 1); “Green Red” and “Yellow Blue”; “Red Yellow” and “Blue Green”; and “Yellow Blue” and “Green Red”. Response alternatives were paired so all four colors could always be present on the screen and never changed positions within one participant's experiment. In order to counterbalance response options (all four colors in all four response positions), there were four versions of the experiment.
Graphical presentation of the English incongruent condition (blue in color yellow). The stimuli appeared in the center of the screen at (0, 75). Response alternatives were in the top left (-100, 150) and right (100, 150) corners of the screen.

Measures
We examined how responses to the Stroop task unfold over time using the mouse-tracking paradigm (Spivey et al., Reference Spivey, Grosjean and Knoblich2005). In the present experiment there were two possible responses (one in the top right corner, the other in the top left corner), placed at symmetrical positions (see Figure 1) relative to the initial mouse position (i.e., START in the bottom center). The two dependent variables in this experiment (initiation times and x-coordinates over time) were recorded using MouseTracker software (Freeman & Ambady, Reference Freeman and Ambady2010). First, initiation times were defined as the time elapsed between clicking START and the first mouse movement. Second, x-coordinates over time reflect the mouse position between START (x = 0) and the correct response (x = 100). The mean trajectory for every participant includes 50 data points, one data point every 20ms for the first second of the response.
MouseTracker records the trajectory of the mouse every 13 to 16ms (see Freeman & Ambady, Reference Freeman and Ambady2010 for a more detailed discussion of MouseTracker). During every trial, three pieces of information are recorded (Freeman & Ambady, Reference Freeman and Ambady2010, p. 229): raw time (how many ms have elapsed), the x-coordinate of the mouse (in pixels), and the y-coordinate of the mouse (in pixels). Following Freeman and Ambady (Reference Freeman and Ambady2010), all trajectories were rescaled into a standard coordinate space. The top left corner of the screen corresponds to coordinates [-100, 150], and the bottom right corner corresponds to [100, 0], leaving the starting location of the mouse (the bottom center) with the coordinates [0, 0], and the stimuli with the coordinates [0, 75]. We bilaterally flipped trajectories that terminated at the top left corner around the y-axis, so the correct responses in our analysis always corresponded to coordinates [100, 150] and the incorrect responses to coordinates [-100, 150], even though participants responded to a task where the correct response appeared in the top right corner half the time. Thus, we focused on horizontal mouse positions (i.e., x-coordinates) ranging from -100 to 100. Nevertheless, trajectories are not expected to reach x-coordinates of 100, since that would correspond to the border of the screen. If participants click in the middle of the response button (with a width of 50), responses will range between −75 and 75.
Procedure
Participants were tested individually on a standard PC using MouseTracker (Freeman & Ambady, Reference Freeman and Ambady2010). Each participant was randomly assigned to one of the four versions of the experiment that counterbalanced all four colors in all four response positions. As in the original color-naming task (Stroop, Reference Stroop1935), participants were instructed to ignore the content of the word (or letters) and focus on the color. Participants were told to click on the color in which the word (or letters) were displayed as quickly and accurately as possible. At the beginning of each trial START appeared at the bottom-center, and the response options appeared in the top left and right corners. A stimulus was displayed in the center of the screen as soon as participants clicked START (see Figure 1), and remained on the screen until participants clicked one of the two response alternatives (one correct and one incorrect, each containing two colors). Participants were instructed to click within the white boundaries of the correct response as quickly and accurately as possible. The response click immediately triggered the next trial by displaying START again. No performance feedback was given to participants during the experiment. Congruent and incongruent, Spanish and English, target words were randomly presented to all participants. If a participant took more than 500ms to initiate a mouse movement, a warning appeared at the end of that trial instructing the participant to start moving the mouse earlier on future trials.
Growth curve analysis
Growth curve analysis (Mirman, Reference Mirman2014) was used to analyze the time course of the mouse movements. The model captures the mouse trajectory with the intercept term reflecting mean overall x-coordinate and the linear term reflecting the slope of the trajectory. We examined how the groups differed across the Stroop conditions, so we included the group effect (Group: Monolingual, English–Other, English–Spanish), the Stroop manipulation (Stroop: Congruent, Incongruent, Control), and the group-by-Stroop interaction. We selected an orthogonal cubic model to fit the data; a linear model would not have been a good choice because of the flat initial and ending sections of the trajectories. For orthogonal polynomials, the intercept term corresponded to the overall mean (Mirman, Reference Mirman2014). The estimate group effect on the intercept reflects the mean difference in the trajectory between the groups across all time bins. The linear term refers to the slope of the trajectory. If a trajectory has a steep slope, participants are covering more space (x-coordinates) in less time than if a trajectory has a flat slope. Therefore, faster movements toward the correct response would result in steeper trajectories, in more pronounced slopes.
Importantly, we limited the effects of the Group-by-Stroop interaction to the intercept and linear terms. In other words, our model reflects the idea that the mouse movement time course is complex (i.e., cubic), but only some aspects of it are meaningfully modulated by Group and Stroop. We studied the impact of the Group-by-Stroop interaction on the intercept and slope of the trajectories. Regardless of how long it took participants to click on the correct response (M = 1,193ms, SD = 120), we focused on the first 1,000ms of each participant's mean trajectory. By selecting only the first second of each trajectory, we aimed to avoid potential distortions produced by aggregating response trajectories that differed in total duration. All analyses were carried out in R version 3.1.0 using the lme4 package.
Results
Data Screening
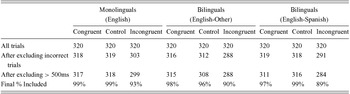
There was a total of 48 English target trials (16 per condition), for a grand total of 2,880 trajectories across participants (960 per condition). Consistent with previous research (Incera et al., Reference Incera, Markis and McLennan2013), 96 trials with incorrect responses and 28 trials with initiation times greater than 500ms were discarded (see Table 1 for a detailed account of these deletions). Overall, 96% of the trials were included in the final analyses. With respect to the Stroop conditions, 91% of the incongruent trials and 98% of the congruent and control trials (Stroop effect) were included in the final analysis. Regarding the groups, 97% of the trials were included in the monolingual group, and 95% of the trials were included in the bilingual groups.
Number of Trials Remaining after Each Exclusion and the Final Percentage of Trials Included in Data Analysis in Each Condition

Note: Excluded trials were those in which incorrect responses were made, or initiation times were longer than 500ms. Additional information is reported in the Results section.
Errors
A Group (English-monolingual, English–Other, English–Spanish) X Stroop (Congruent, Control, Incongruent) mixed ANOVA was performed on the number of incorrect responses (a perfect score would be 16 correct responses). First, there was a significant Stroop effect, F(2, 57) = 24.95, MSE = 26.52, p < .001, ηp 2 = .30. Comparisons revealed the traditional Stroop pattern. Errors in the congruent (M = 0.12) and control (M = 0.18) conditions were equivalent (p = .32), but there were more errors in the incongruent condition (M = 1.30, p < .001). Importantly, there was no significant main effect of Group, F(2, 57) = 1.94, MSE = 2.40, p = .15, ηp 2 = .06; and there was no significant Group-by-Stroop interaction, F(4, 57) = 0.75, MSE = 0.79, p = .56, ηp 2 = .04. On average, participants made approximately half an error (M = 0.53) across the three conditions of the Stroop task, indicating very few errors or near ceiling performance.
Initiation Times
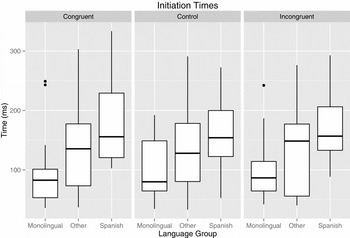
A Group (English-monolingual, English–Other, English–Spanish) X Stroop (Congruent, Control, Incongruent) mixed ANOVA (see Figure 2) was performed on initiation times (i.e., the time between clicking START and initiating the mouse movement). First, there was no significant Stroop effect, F(2, 57) = .60, MSE = 1330.05, p = .55, ηp 2 = .01 on initiation times. Responses in the incongruent condition did not take longer to initiate than responses in the congruent or control conditions. Importantly, there was a significant main effect of Group, F(2, 57) = 7.87, MSE = 165950.11, p = .001, ηp 2 = .22. As predicted, planned comparisons revealed that participants in the English monolingual group (M = 98, SD = 54) started moving the mouse significantly earlier than participants in the English–Other bilingual group (p = .048, M = 136, SD = 73) and participants in the English–Spanish bilingual group (p < .001, M = 172, SD = 64). As expected, the English–Other group was 36ms faster (see means above) than the English–Spanish group, and this difference was marginally significant (p = .057). Finally, there was no significant group-by-Stroop interaction, F(4, 57) = 1.09, MSE = 4846.58, p = .36, ηp 2 = .04.
Box plot of the distribution of initiation times in milliseconds for all three groups (Monolingual English, Bilingual English-Other, Bilingual English-Spanish) across all three Stroop conditions (Congruent, Control, Incongruent). The bottom and top of the box represent the first and third quartiles, and the band inside the box is the second quartile (i.e., the median). The vertical lines (i.e., whiskers) represent the range of the distribution (from Q1 to the smallest non-outlier in the data set, and from Q3 to the largest non-outlier). Three outliers are plotted separately as points on the chart.

X-Coordinates over Time
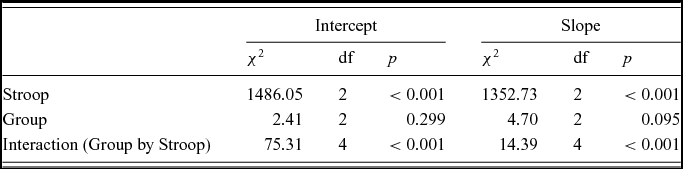
Growth curve analysis (Mirman, Reference Mirman2014) was used to analyze x-coordinates over time. The data were fit using a linear growth model with fixed effects of Stroop, Group and the Group-by-Stroop interaction on the intercept and linear terms (our predictions focus on the linear term, the slope of the trajectory). Since the Stroop condition was within-participants, that level of nesting is also reflected in the random effect. Therefore, we included the random effects of participants and Stroop to model individual differences. The fixed effects of Stroop, Group, and the interaction on the intercept and linear terms were added individually and their effects on model fit were evaluated using model comparisons (see Table 2). Improvements in model fit were evaluated using -2 times the change in log-likelihood, which is distributed as χ2 with degrees of freedom equal to the number of parameters added.
Model Comparison Results Evaluating Effects of Adding Parameters on Model Fit

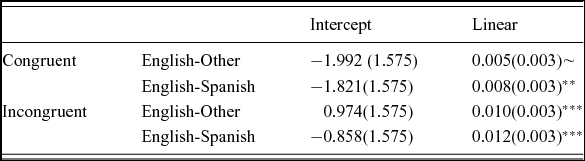
There was an effect of Stroop on both the intercept (χ2 (2) = 1,486.05, p < .001), and linear slope term (χ2 (2) = 1,352.73, p < .001). Importantly, there was a Group-by-Stroop interaction for both the intercept (χ2 (4) = 75.31, p < .001) and the linear slope term (χ2 (4) = 14.39, p < .001). We further explored this interaction by comparing the parameter estimates (see Table 3).
Parameter Estimates for Analysis of Effects of Stroop and Group on x-Coordinate. The values correspond to parameter estimates (SE in parentheses) for each of the bilingual groups relative to the monolingual group, in the congruent and incongruent Stroop conditions relative to the control condition

~ p < .10 * p < .05 ** p < .01 *** p < .001
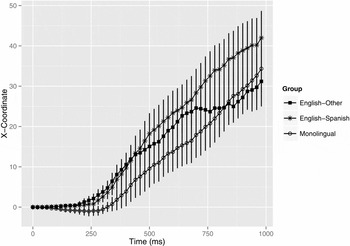
We explored the fixed effects of the Group-by-Stroop interaction on the intercept and slope of the trajectories. Table 3 shows the fixed effect parameter estimates and their standard errors. Importantly, differences between the bilinguals and the monolingual group reached significance in the linear term (the slope of the trajectory). In the incongruent condition, both the English–Spanish bilingual group (t = 4.51, p < .001) and the English–Other bilingual group (t = 3.47, p < .001) had trajectories with steeper slopes (i.e., moved straighter towards the correct response) than the monolingual group (see Figure 3). As predicted by the conflict monitoring hypothesis, differences also emerged in the congruent condition. The English–Spanish bilingual group had steeper slopes than the monolingual group (t = 2.75, p = .006), and the English–Other bilingual group had marginally significant steeper slopes than the monolingual group (t = 1.86, p = .06). Importantly, when looking at the size of the estimates a pattern emerges (see Table 3). The effect is maximal for the high conflict bilingual group in the incongruent condition (Estimate = .012), followed by the low conflict bilingual group in the incongruent condition (Estimate = .010). The effects are less pronounced in the congruent condition, where effect for the high conflict group (Estimate = .008), is followed by the marginally significant effect for the low conflict group (Estimate = .005).
The x-coordinates over time for the incongruent condition of the Stroop task, comparing the monolingual English, the bilingual English-Other, and the bilingual English-Spanish groups. The lines show the mean mouse movements for the first second of the trajectory; the vertical lines through each point represent the standard error.

In conclusion, an interaction between Stroop and Group influenced the slope of the trajectories (how fast participants moved towards the correct response). Bilinguals performed differently (moving faster towards the correct response) than monolinguals, and these effects were maximized when the cognitive demands were higher. The bilingual advantage was greater in the incongruent condition and for the high conflict group. Bilinguals perform in a different way from monolinguals, which in this task means they move faster towards the correct response, when they have to manage higher cognitive demands.
Discussion
In the present study we compared the performance of three groups of participants (English monolinguals, English–Spanish bilinguals, and English–Other bilinguals) in a mouse tracking version of the bilingual Stroop task. Interestingly, a Group-by-Stroop interaction emerged. The bilingual advantage was greatest in the incongruent condition of the Stroop task and for the high conflict group. The bilingual participants took longer to initiate the response (especially when conflict was high), but then they moved faster towards the correct response (compensating for the initial loss of time). The fact that bilinguals behave qualitatively differently from monolinguals supports our argument that bilinguals behave like experts. As predicted based on the expert literature, bilinguals took longer to initiate a response, followed by more efficient movement toward the correct response.
The bilingual effect on initiation times was independent of the Stroop effect. First, across all conditions bilinguals took approximately 50ms longer to start moving the mouse than monolinguals (Figure 2). Moreover, higher levels of conflict monitoring (e.g., having both languages active) resulted in longer initiation times for bilinguals. In this experiment, the high conflict group took 36ms longer (marginally significant) to initiate the movement than the low conflict group. Second, the Stroop effect did not influence initiation times, even though it emerged in both percent correct and x-coordinates over time. Initiation times (i.e., when participants start moving the mouse) capture very early stages of cognitive processing. The fact that there was only a main effect of Group on initiation times supports the idea that expertise could be at the root of the bilingual advantage. On the contrary, the Stroop effect takes longer to emerge, in part because the word and the color have to be processed. While initiation times typically range from 100 to 200ms, Incera et al. (Reference Incera, Markis and McLennan2013) reported that the period of interest for the Stroop effect could range between 350 and 800ms. In their study, Incera and colleagues used the mouse-tracking paradigm to determine the time period in which the trajectories for the congruent and incongruent conditions of the Stroop task were significantly different. Finding group differences but not the Stroop effect in initiation times is intriguing. These results provide important new information about the time course of these effects.
The bilingual effect on how fast participants moved toward the correct response (the slope of the trajectory) was influenced by the group-by-Stroop interaction. Bilinguals had steeper slopes, indicating that they moved faster than monolinguals toward the correct response. Interestingly, this effect was modulated by the amount of conflict. The effect was greater in the incongruent than the congruent condition, and for high conflict bilinguals than for low conflict bilinguals. This pattern has been observed in previous studies. For example, the work of Filippi and colleagues (Filippi, Leech, Thomas, Green & Dick, Reference Filippi, Leech, Thomas, Green and Dick2012; Filippi, Morris, Richardson, Bright, Thomas, Karmiloff-Smith & Marian, Reference Filippi, Morris, Richardson, Bright, Thomas, Karmiloff-Smith and Marian2014) has shown that bilinguals, both children (early bilinguals) and adults (late bilinguals), are more efficient in comprehending difficult sentences in the presence of interference. However, when the task is easy (i.e., comprehension of easy sentences), monolinguals and bilinguals have comparable performance.
It is important to be cautious when discussing differences between the bilingual groups. The groups did not differ in English proficiency or usage, but they had different ages of acquisition. We argue that the English–Spanish group outperformed the English–Other group because they were in a high conflict monitoring situation. Nevertheless, an alternative explanation could be that the English–Spanish bilinguals had better executive control functions because their bilingual age of onset was earlier than the English–Other group (means of 4 and 7 years old). Future research is necessary to study the interplay between participant (age of language acquisition) and task (high conflict situation) characteristics. In addition, there are other variables that could further inform our understanding of these results, including objective measures of English proficiency, measures of non-verbal reasoning control, working memory, and basic-perceptual motor skills. Further research is needed to explore the unique contributions of these – and other such – factors.
It is worth noting that the response modality used in the present study (mouse movements) differed from response modalities in previous Stroop investigations (card sorting, button press, and vocal responses). Participants did not read the word or press a button, but instead decided which of four words on the top of the screen matched the target, and then moved the mouse toward the matching word. This alteration resulted in longer RTs (more than 1,000ms on average) than the usual button press (800ms) or vocal response (600ms) task. According to Sugg and McDonald (Reference Sugg and McDonald1994) the way in which color and word meaning are processed in the task remains unchanged regardless of response modality. Importantly, as a result of an extensive review of the literature, MacLeod (Reference MacLeod1991, p. 183) concluded: “Although still significant, interference (but perhaps not facilitation) is reduced when response modality is switched from oral to manual. Stimulus-response compatibility matters; if the normal processing of the irrelevant dimension leads to a response in the mode designated for the relevant dimension, interference is likely to be heightened. However, neither response mode alone, nor the interaction of stimulus and response mode can account for the Stroop effect. The effect is due to more than a queuing problem at the finish line.” These comments highlight the idea that the Stroop effect is pervasive and influences performance beyond the specific method used. Thus, while it is important to take into account possible differences caused by response modalities, we argue that it did not change the essence of the task.
Mouse tracking allowed us to study the time course of the bilingual advantage. We argue that bilinguals process information in a qualitatively different way from monolinguals. Bilinguals behave like experts, taking longer to initiate a response, but then outperforming monolinguals. This explanation could account for some contradictory findings from RT measures. In tasks where the benefits of faster processing times do not outweigh the costs of longer initiation times, the bilingual advantage would not emerge.
Future research should investigate whether qualitatively different time courses might impact other cognitive processes. Qualitative differences in performance call for a change in the way psychologists study cognition. Researchers need to explore the nuances of the continuous dynamics of the response (e.g., as measured by x-coordinates over time).