Introduction
Nineteenth century Mexico experienced considerable political and economic instability. Initially a Spanish colony, Mexico (New Spain) gained its independence in 1821. For the next 55 years, political power vacillated between factions. The 1876 Tuxtepec Revolution and the rise of the Porfiriato influenced Mexican political and economic arrangements. Throughout this period, there were two similar Mexican groups residing in the American West: Mexicans born in Mexico and Mexicans born in the United States. This creates a natural experiment to assess how male prison inmates identified as Mexicans at the time of incarceration contrasted when the two groups came to maturity under different biological conditions and under different political and economic regimes. In the case of 19th century Mexico, economic growth and changing biological conditions were also influenced by general economic backwardness, including poorly developed political and economic institutions. Until the fourth quarter of the 19th century, Mexico's economy depended on an inefficient overland transportation system, which kept the costs of domestic transportation high (Coatsworth, Reference Coatsworth1978, p. 91; Katz, Reference Katz and Bethell1991, pp. 75, 80–81). On the northern side of the US border, transportation costs fell and markets integrated.
The use of height data to measure living standards is now a well-established method in economics (Fogel, Reference Fogel1994, p. 138). A population's average stature reflects the cumulative interaction between nutrition, disease exposure, work and the physical environment (Tanner, Reference Tanner1962, 1–27; Steckel, Reference Steckel1979, p. 365–367). By considering average versus individual stature, genetic differences are mitigated, leaving only influences of the socioeconomic variety and the physical environment on stature. When diets, health and physical environments improve, average stature increases and decreases when diets become less nutritious, disease environments deteriorate or the physical environment places more stress on the body, and stature provides considerable insights into understanding historical processes, augmenting other welfare measures for 19th century Mexicans that may otherwise remain undiscovered.
It is against this backdrop that this paper addresses two questions. First, using Mexican- and US-born male statures in 19th century US prisons, what were the primary sources associated with the stature gap between Mexicans born in Mexico and the US? After controlling for nativity, the Mexican–US-born stature gap was primarily associated with birth period, indicating that differences in material and biological conditions were associated with the stature gap. Second, stature is related to vitamin D, and different genetic groups are not equally efficient in Vitamin D production (Carson, Reference Carson2009, pp. 150–154). How did the statures of Mexicans born in the US vary with direct sunlight, the primary source of vitamin D production? Results presented here indicate 19th century Mexican statures were associated with vitamin D production and was more like the European response to direct sunlight than the African response.
Data
Two common sources for 19th century statures are prison and military records, and data used here to study Mexican statures is a subset of a much larger 19th century US prison sample. All available records from US state prison repositories have been acquired and entered into a master file. These records include Arizona, California, Colorado, Idaho, Illinois, Kansas, Kentucky, Missouri, New Mexico, Ohio, Oregon, Pennsylvania, Tennessee, Texas, Utah and Washington. Mexicans incarcerated in the four Southwestern state prisons of Arizona, Colorado, New Mexico and Texas are the basis of this study. Because the comparison is between Mexican males born in Mexico and the US, females and non-Mexicans are excluded from the analysis.
All historical height and weight data have various selection biases, and there is always concern over entry requirements, be it to prison or the military. While prison records are not random samples, the selectivity they represent has its own advantages, such as being drawn from lower socioeconomic groups, that group most vulnerable to economic change (Bogin, Reference Bogin1988, p. 288; Komlos & Baten, Reference Komlos and Baten2004, p. 199). Moreover, since prison incarceration processes were based on criminal and not biological standards, prison records offer valuable insight into historical stature variation. Physical descriptions were recorded by US prison enumerators at the time of incarceration as a means of identification. At the time of incarceration, US prison officials consistently recorded inmate age, place of birth, crime, pre-incarceration occupation, race, height and weight. There was great care in recording inmate statures because accurate measurements had legal implications in the event that inmates escaped and were later re-captured. Many 19th century stature measurements were rounded to the nearest inch or half-inch, and most inmates were recorded at quarter, eighth and even sixteenth inch increments.
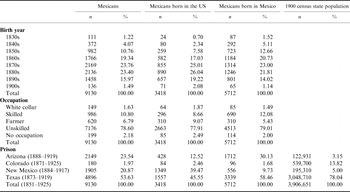
All inmates recorded as ‘Mexican’ in US prison records' complexion column are used in this study. Therefore, Mexicans born in both Mexico and the US can be compared. Since stature is sensitive to age, inmates aged 22 and younger are classified as youths; inmates aged 23 and older are classified as adults. Table 1 summarizes each state prison's youth and adult populations and indicates that over one-half of Mexican-born inmates were incarcerated in Texas.
Nineteenth century Mexicans in Western state prisons

Source: Data used to study Mexican anthropometrics are a subset of a much larger 19th century prison sample. All available records from American state repositories have been acquired and entered into a master file. These records include Arizona, California, Colorado, Idaho, Illinois, Kansas, Kentucky, Missouri, New Mexico, Ohio, Oregon, Pennsylvania, Tennessee, Texas, Utah and Washington. Prison records used in this study are Arizona, Colorado, New Mexico and Texas.
Most Mexicans in the sample were born during the mid-to-late 19th century, and unskilled workers were most prominent (Table 1). Predictably, border states had higher concentrations of Mexican prisoners.
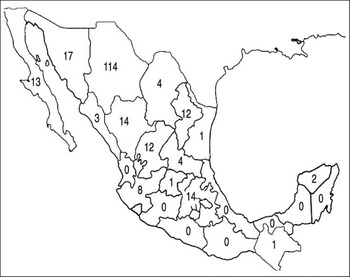
Most 19th century US Southwestern state prisons did not systematically document inmates' city of birth, only their state or country of origin. However, the New Mexico state prison documented the hometown of each Mexican inmate. All Mexicans born in Mexico were born within what became Mexico after 1848, and no Mexicans born in Mexico claimed birth in a township that later became part of the US. Therefore, if Mexican populations in other Southwestern prisons were comparable to the New Mexico sample, we can be reasonably certain that Mexican inmates were born within Mexico after the 1848 border settlement with the US. Most inmates with identifiable hometowns were from Ciudad Juárez, Santa Rosalia, Chihuahua, Matamoros and other northern provinces (Fig. 1). A few inmates were from Zacatecas and Mexico City provinces, and fewer were from the Yucatan Peninsula or farther south; 80.9% were from northern provinces; 17.7% were from central provinces; 1.4% were from southern provinces. There was a north–south stature gradient among Mexicans born in Mexico in the New Mexico prison records, but it was small and not statistically significant. Mexican complexions, not included in the regressions, are consistent with Mestizos. The Arizona prison was the only prison that included prisoner photographs, and all Mexican complexions in the Arizona prison are consistent with Mestizos.
Nativity of Mexicans born in Mexico within the 19th century New Mexico prison. Source: Hola Province count represents the number of New Mexico prison inmates born in each Mexican province. Map is from Roberts & Newman (Reference Roberts, Newman and Wauchope1970). Note: Northern Mexican provinces are Baja California, Baja California Sur, Chihuahua, Coahuila, Durango, Nuevo Leon, Sinaloa, Sonora and Tamaúlipas. Central provinces are Aguascalientes, Colima, Guanajuato, Querétaro, Hidalgo, México, Tlaxcala, Federal District, Michoacán, Morelos, Nayarit, Puebla, San Luis Potosi, Veracruz and Zacatecas. Southern Mexican provinces are Campeche, Chiapas, Guerrero, Oaxaca, Quintana Roo, Tabasco and Yucatan.

It is not possible to be certain when Mexicans immigrated into the United States, and consequently to fully isolate to what extent the US environment was responsible for their stature growth. However, Goldstein (Reference Goldstein1943, pp. 15 and 24) finds that early 20th century Mexican immigrants to the US were on average 21.2 years old at time of immigration, indicating that stature growth had ceased by the time of migration, and the statures of Mexicans born in Mexico reflect Mexican biological conditions.
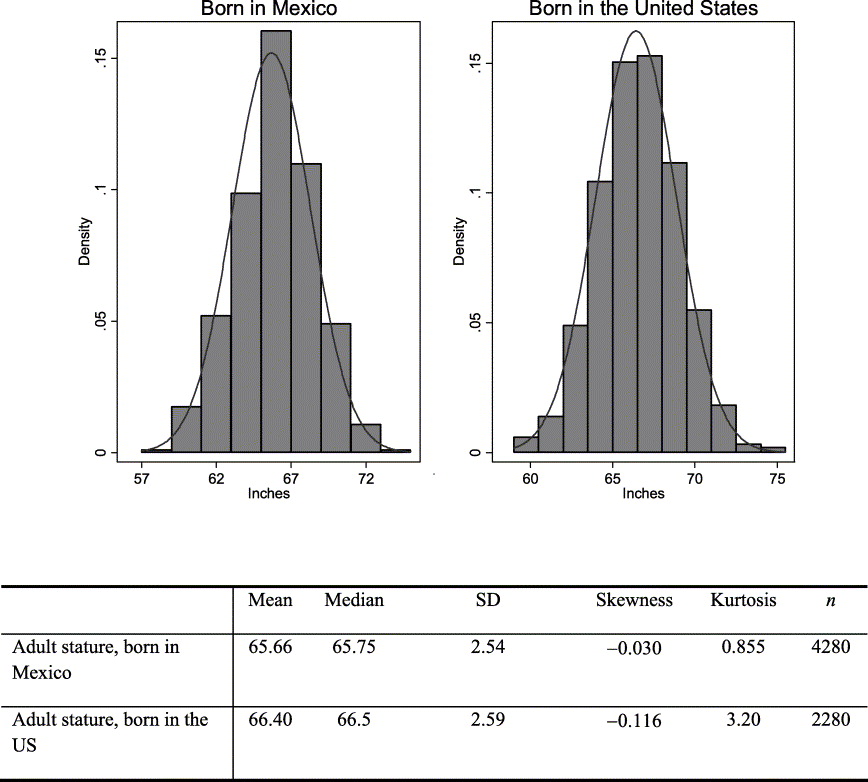
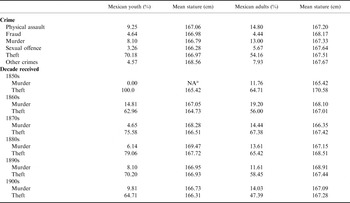
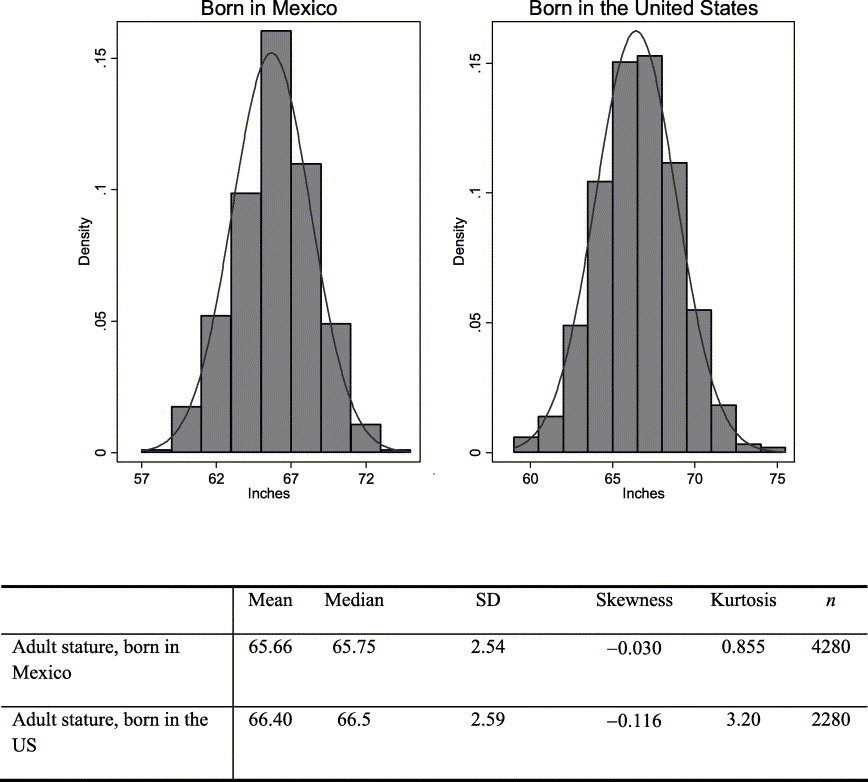
Stature and crimes may be related to biological conditions through the relative effects of privation. The proportions of crimes committed are reported in six categories: physical assault, fraud, murder, sexual assault, theft and other crimes (Table 2). Throughout the 19th century, Mexican youths born in Mexico and the US were incarcerated proportionally more for theft; adults were incarcerated more for all other crimes. Since murder and theft are the most representative violent and non-violent crimes and to assess whether changing stature may have been the result of changes in biological processes or changes in the types of inmates incarcerated, their proportions are presented over time. Youth and adult stature by type of crimes committed did not differ appreciably from the rest of the incarcerated sample. Stature requirements were not placed on 19th century Mexican prisoner measurements, and adult Mexican stature distributions were symmetric (Fig. 2).
Mexican adult stature histogram with descriptive stature statistics. Source: see Table 1.
Nineteenth century Mexican youth and adult crime proportions

Source: see Table 1.
a NA, not available.
Sources of Mexican and Hispanic stature variation
In the 19th century American Southwest, stature differences between Mexicans born in Mexico and the US reflect the environments in which they came to maturity. This study tested which of these variables were associated with the height of 19th century Mexicans. To start, the stature of the i th individual (Centimetrei) is assumed to be related with age, birth decade, occupation and nativity.

Because youth stature is most sensitive to age effects, five teenage binary variables are included (15, 16, 17, 18 and 19); four 10-year age binary variables are included for adult ages (30–39, 40–49, 50–59 and over 60); the omitted age category is 20–29. Binary decade variables are included to account for birth between 1830 and 1899; the omitted birth category is 1830–1839. Average stature also varied by occupation, and occupation may have been a good indicator for parental occupation, and therefore the socioeconomic status in which inmates came to maturity (Tanner, Reference Tanner, Harrison, Weiner, Tanner and Barnicot1977; Margo & Steckel, Reference Margo, Steckel, Fogel and Engerman1992, Steckel & Haurin, Reference Steckel, Haurin and Komlos1994, p. 121; Bourdieu et al., Reference Bourdieu, Ferrie and Keszenbaum2009). However, there may have been reverse causation from stature to occupation, indicating that reference to the stature–occupation relationship must be made with care. Four occupation variables are included: white collar, skilled, farmer and unskilled; ‘no occupation’ is the omitted occupation category. Workers who were merchants and high-skilled workers are classified as white-collar workers; light manufacturing, craft workers and carpenters are classified as skilled workers; workers in the agricultural sector are classified as farmers; labourers and miners are classified as unskilled workers (Tanner, Reference Tanner, Harrison, Weiner, Tanner and Barnicot1977; Ladurie, Reference Ladurie, Reynolds and Reynolds1979; Margo & Steckel, Reference Margo, Steckel, Fogel and Engerman1992).
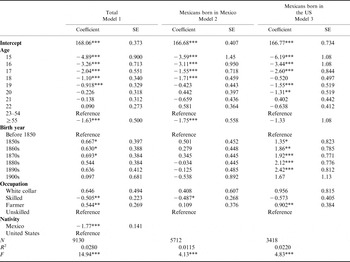
Table 3's Model 1 presents stature regressions for both Mexicans born in Mexico and the US on birth year, occupations, nativity and residence; Model 2 uses the same model specification for Mexican nationals only, while Model 3 does the same for Mexicans born in the US. To assess the primary sources associated with the stature differential, a Blinder–Oaxaca stature decomposition is then constructed on the US–Mexican-born stature gap.
Mexicans born in Mexico and Mexicans born in the US stature regression models

Source: see Table 1.
Control group is 23- to 55-year-old unskilled US-born Mexicans. Age dummy variables 15 through 22 are for the specified youth age category; adult age dummy variables are included for age over 55. Decadal birth year dummy variables are from birth before 1850 through 1910. Occupational dummy variables are for white-collar, skilled and farming occupations. A Mexican birth dummy variable is 1 if born in Mexico and 0 if born in the United States.
*** Significant at 0.01;
** significant at 0.05;
* significant at 0.10.
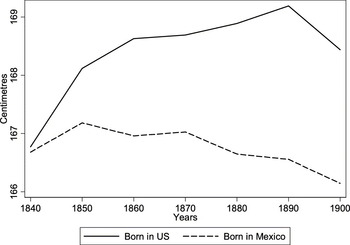
Throughout the 19th century, the stature of Mexicans born in Mexico remained stagnant, which is consistent with López-Alonso & Condey (Reference López-Alonso and Condey2003) and Carson (Reference Carson2005). Stagnant Mexican-born statures occurred during Mexico's tumultuous 19th century political and economic environment. The 1830s and 1840s brought General Antonio López de Santa Anna – a self-styled ‘Napoleon of the West’ – to power (MacLachlan & Beezley, Reference MacLachlan and Beezley1999). Between 1846 and 1848, Mexico and the US engaged in a bloody war that determined who would control what is now the US South-west. Between 1854 and 1871, Mexico experienced considerable political volatility during the War of Reform, Austria's Hapsburg Monarchy's effort to install Maximilian, and the rule of Benito Juarez. Alternatively, the average statures of Mexicans born in the US experienced an unambiguous and sustained increase of three centimetres (Fig. 3). On the northern side of the border, the US experienced substantial growth, large-scale agricultural development, and railroads were constructed, which integrated the West with eastern markets.

Part of the stature advantage for Mexicans born in the US may be attributable to diet, specifically animal proteins and calcium, and calcium is necessary for healthy bone formation (Tortolani et al., Reference Tortolani, McCarthy and Sponseller2002). Diets in Mexico were typically vegetarian, where staples included beans, rice, chillies, bread and tortillas (Gamio, Reference Gamio1969). A primary calcium source for Mexicans born in Mexico was tortillas, where calcium came from the limestone used to crush the corn or flour. However, both Mexicans born in Mexico and in the US used stones to crush flour; therefore, tortillas as a calcium source are unlikely to explain the stature difference.
The diets of Mexicans born in the US were augmented by animal proteins and dairy products. Moreover, by 1900, Mexicans born in the US benefited from increased canning processes, refrigerated freight cars, and large-scale commercial farms, giving them greater access to animal proteins and dairy products as plausible sources for the stature difference between the two groups (McWilliams, Reference McWilliams1949). However, taller Mexicans born in the US do not necessarily indicate that US biological conditions were superior to Mexican biological conditions because northern indigenous groups within Mexico were also taller than their southern-born counterparts (Faulhaber, Reference Faulhaber and Wauchope1970). Nevertheless, the fact that northern Mexican statures for most indigenous groups remained stationary, while the statures of Mexicans born in the US increased, indicates that better nutrition and biological conditions in the US are possible explanations for taller statures of Mexicans born in the US. Mexican white-collar workers and farmers reached the tallest statures, indicating white-collar workers and self-sufficient Mexican farmers also came to maturity under superior net cumulative biological conditions compared with skilled and unskilled workers. Farmers traditionally had greater access to superior diets and nutrition, but farmers also worked outdoors and were exposed to more sunlight during adolescent ages; consequently, stature and socioeconomic status may also be related to vitamin D production. Islam et al. (Reference Islam, Gauderman, Cozen and Mack2007, pp. 383–388) demonstrate that children exposed to more direct sunlight produce more vitamin D.
Decomposing the Mexican- and US-born stature gap
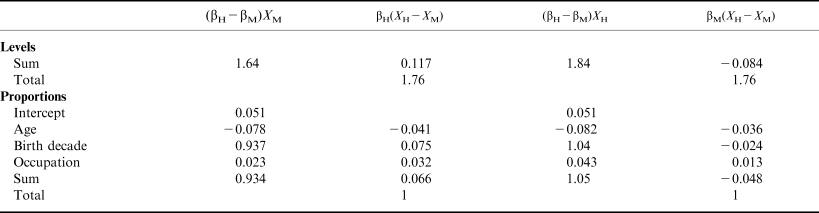
To more fully account for the source of the US–Mexican stature differential and to isolate the relative importance of characteristics associated with stature growth, a Blinder–Oaxaca decomposition is imposed on the US–Mexican stature differential (Oaxaca, Reference Oaxaca1973). Let S US and S M represent the statures of Mexicans born in the US and Mexico, respectively; α US and α M are the autonomous stature components that accrue to Mexicans born in the US and Mexico; β US and β M are the Hispanic and Mexican stature returns associated with specific stature-enhancing characteristics, such as age and occupations. X US and X M are characteristic matrices of Mexicans born in the US and Mexico. In the US–Mexican stature decomposition, ‘Mexicans born in the US’ statures are assumed to be the base structure.

The second right-hand-side element is that component of the stature differential due to differences in stature returns and for most characteristics was probably positive. Hence, if the ‘Mexicans born in the US’ stature advantage was due to better biological conditions in the US, the stature returns to Mexicans born in the US, β US, will be larger than stature returns to Mexicans born in Mexico, β M. The third right-hand-side element is the stature differential component due to differences in characteristics and is undetermined because there is little evidence to indicate that either 19th century US- or Mexican-born characteristics were associated with statures.
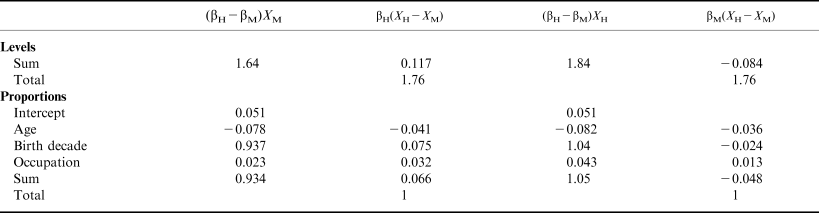
Using coefficients from the stature regressions (Table 3, Models 2 and 3), the proportion of the stature decomposition attributable to birth year indicates that the majority of the Mexican US-born stature advantage arose from differences in biological conditions in the US and Mexico that were associated with the US–Mexican stature differential (Table 4). Moreover, the proportion of the stature differential associated with the intercept is small, which is expected with a genetically similar population where the primary difference between the two groups was the physical environment in which they were brought to maturity.
Vitamin D, solar radiation and Mexican statures
An unexplored source for Mexican stature growth may be related to biology, especially its relation to geography. Calcium and vitamin D are two chemical entities required throughout life for healthy bone and teeth formation; however, their abundance is most critical during younger ages (Tortolani et al., Reference Tortolani, McCarthy and Sponseller2002, p. 60; Wardlaw et al., Reference Wardlaw, Hampl and Disilestro2004, p. 394–396). Calcium generally comes from dairy products, and vitamin D is not dietary but is produced by the synthesis of cholesterol and sunlight in the epidermis' stratum granulosum (Loomis, Reference Loomis1967, p. 501; Norman, Reference Norman1998, p. 1108; Nesby-O'Dell et al., Reference Nesby-O’Dell, Scanlon, Cogswell, Gillesie, Hollis, Looker, Allen, Doughertly, Gunter and Bowman2002, p. 187; Holick, Reference Holick2004a, pp. 363–364; Holick, Reference Holick2007). Consequently, geography and proximity to the equator have important roles in vitamin D production.
Vitamin D is vital in all vertebrates because it allows them to absorb more calcium from their diets and contributes to stronger skeletal systems and stature growth (Jablonski, Reference Jablonski2006, p. 62); there are few dietary sources of vitamin D. In order of importance, the primary sources of vitamin D in humans are the amount of time exposed to sunlight, skin pigmentation and nativity (Holick et al., Reference Holick, MacLaughlin and Doppelt1981, p. 590). Greater direct sunlight (insolation) produces more vitamin D, and vitamin D is related to adult terminal stature (Ginsburg et al., Reference Ginsburg, Livshits, Yakovenko and Kobyliansky1998; Liu et al., Reference Liu, Shen, Deng, Liu, Zhao and Dvornyk2003; Uitterlinden et al., Reference Uitterlinden, Fang, van Meurs, Pols and van Leeuwen2004 Xiong et al., Reference Xiong, Xu, Liu, Shen, Long, Elze, Recker and Deng2005, pp. 228, 230–231). Insolation is the incoming direct sunlight that reaches the earth's atmosphere and surface objects. However, after the circulatory system contains sufficient amounts of vitamin D and to avoid vitamin D toxicity, vitamin D production is restricted within the stratum granulosum and residual vitamin D is broken down into inert matter (Holick et al., Reference Holick, MacLaughlin and Doppelt1981, pp. 591–592; Holick, Reference Holick and Giacomoni2001, p. 20; Holick, Reference Holick2004a, p. 363; Jablonski, Reference Jablonski2006, p. 62). Vitamin D production also depends on melanin in the stratum corneum (Norman, Reference Norman1998, p. 1108). Greater melanin (skin pigmentation) in the stratum corneum interferes with vitamin D's synthesis in the stratum granulosum, and darker pigmentation filters between 50 and 95% of the sunlight that reaches the stratum granulosum (Loomis, Reference Loomis1967, p. 502; Kaidbey et al., Reference Kaidbey, Agin, Sayre and Cligman1979, pp. 249 and 253; Weisberg et al., Reference Weisberg, Scanlon, Li and Cogswell2004, p. 1703S; Jablonski, Reference Jablonski2006, p. 80–81; Holick, Reference Holick2007, p. 270). To address rickets in the US population, in the 1930s the federal government advocated fortification of the US milk supply with vitamin D (Bishai & Nalubola, Reference Bishai and Nalubola2002, p. 41; Holick, Reference Holick2004b, p. 1679S). However, blacks, who are more likely to be lactase intolerant, did not consume milk to the same degree as that comsumed by whites (Kiple & King, Reference Kiple and King1981). Reflecting the self-limiting vitamin D effect, 19th century US black statures increased at an increasing rate in insolation, while white stature increased at a decreasing rate (Carson, Reference Carson2009, pp. 150–154), and this self-limiting vitamin D effect may account for some of the difference between how Mexican statures were associated with insolation. At the opposite extreme, insufficient vitamin D has been linked to rickets, osteomalasia, auto-immune diseases and certain cancers (Holick, Reference Holick and Giacomoni2001, p. 28; Grant, Reference Grant2003, p. 372; Garland et al., Reference Garland, Garland, Gorhom, Lipkin, Newmark, Mohr and Holick2006, pp. 252–256).
An insolation measure for the US is used here to account for solar radiation in each state. Since US historical insolation is unavailable, a modern insolation index (1993–2003) is constructed, and monthly insolation values are measured from January through June. The insolation index measures statewide average insolation levels across each of the states based on the hours of direct sunlight per day at county centroids in each state. Each state estimate was then determined by summing the average hours of direct sunlight for each county (at its centroid), weighted by the proportion of the county's total land area (in square miles) to the state's total land area (in square miles). While this index is a rough approximation for historical insolation, it provides sufficient detail to capture latitudinal insolation variation, and consequently, vitamin D production. Predictably Southern states receive greater insolation than Northern states. For example, Texas receives 1.43, or 29%, more hours of direct sunlight per day than New York. It is also difficult to interpret insolation's net direct effect on human health, because greater insolation reduces calories required to maintain body temperatures and produces more vitamin D. However, greater insolation also warms surface temperatures, which may have made disease environments less healthy from water-borne diseases, especially in the South (Steckel, Reference Steckel and Fogel1992, p. 501).
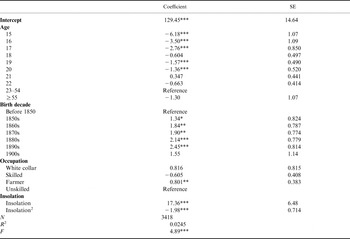
A noteworthy question for Mexican populations is whether their statures responded more like European or African-American statures to insolation exposure at North American latitudes. To isolate the relationship between vitamin D, age, birth period and occupations, a stature model is constructed as before (Table 3); however, insolation and insolation squared terms are added to assess whether ‘Mexican stature born in US’ insolation levels responded to the effects of insolation more like Europeans or Africans.

The relationships between how the statures of US-born Mexicans were related with age, birth period and occupations are consistent with those presented in Table 3. Mexican statures increased throughout the 19th century, and farmers were taller than non-farmers. Moreover, Table 5 illustrates that the statures of Mexicans born in the US increased at a decreasing rate in insolation, and at North American latitudes, Mexican statures responded more like Europeans than Africans to the effects of solar radiation and vitamin D production.
Demographics, occupations, insolation and Mexican statures

Source: See Table 1.
Control group is 23- to 55-year-old unskilled US-born Mexicans. Age dummy variables 15 through 22 are for the specified youth age category; an adult age dummy variable is included for age over 55. Decadal birth year dummy variables are from birth before 1850 through 1910. Occupational dummy variables are for white-collar, skilled and farming occupations. A continuous insolation variable accounts for stature variation associated with incident solar.
*** Significant at 0.01;
** significant at 0.05;
* significant at 0.10.
Conclusion
This biological comparison of late 19th and early 20th century Mexicans born in Mexico and the US demonstrates that the stature of Mexicans born in Mexico declined throughout the 19th century. On the other hand, the statures of Mexicans born in the US increased by nearly three centimetres, indicating that although the two groups shared a common genetic background, stature variation between the two groups differed markedly. The source of the stature gap between Mexicans born in Mexico and the US was birth year, and this corresponds with improving conditions in the US Southwest compared with northern Mexico. Moreover, 19th century Mexican statures increased at a decreasing rate in insolation and responded more like Europeans than Africans to the effects of solar radiation and vitamin D production. Consequently, throughout the second half of the 19th century, Mexicans born in Mexico were shorter, while Mexicans born in the US were taller. These results indicate that trans-border Mexican biological living conditions in the American West did not fully integrate, and the primary source of the Hispanic-Mexican stature differential was probably the result of better living conditions in the US.
Acknowledgment
The author appreciates comments from two anonymous reviewers.