Introduction
Electrochemical capacitors are energy storage devices characterized by high-power densities, but relatively low energy if compared with battery systems. Therefore, the main goal of current research in this area is to increase the energy density of these devices with retained high-power efficiency. One of the solutions is lithium-ion capacitor (LIC) composed of a battery-type electrode and a high surface area activated carbon (AC) (capacitive electrode). The asymmetric design merges the advantages of redox and capacitive-based systems. Since 2001, numerous approaches involving different electrode materials have been presented in the literature.[ Reference Cericola and Kötz 1 – Reference Wang and Shen 3 ] The first hybrid device was constructed from the nanostructured Li4Ti5O12 (LTO) anode and AC cathode and worked in the voltage range of 1.5–3.0 V.[ Reference Amatucci, Badway, Du Pasquier and Zheng 4 ] In the next reports, the LTO electrode has been replaced by various graphitic materials in order to increase the voltage of the device.[ Reference Cao, Shih, Zheng and Doung 5 – Reference Schroeder, Winter, Passerini and Balducci 11 ] The enhancement was possible because of the wider operating voltage range caused by the lower redox potential of graphite intercalation compared with LTO (1.5 V versus Li/Li+).[ Reference Naoi, Ishimoto, Miyamoto and Naoi 12 , Reference Decaux, Lota, Raymundo-Pinero, Frąckowiak and Béguin 13 ] Nevertheless, incorporation of the battery-type electrode has also some drawbacks; namely, the electrode involving redox process will determine the power of the total system. Since intercalation of lithium (Li) ions into graphite structure occurs relatively slow, the power of LIC with graphite as the anode is lower. For this reason, reduced graphite oxide (RGO) seems to be promising material as the anode in LIC. A merged mechanism of the charge storage in RGO allows the good power rate to be achieved.
The aim of presented work was to maintain the high-power density of the LIC by structural modification of the graphite anode. This paper shows a comparison of the performance of LICs built of graphite (G), thermally reduced graphite oxide (TRGO), and graphite oxides (GO) reduced chemically by using two different reducing agents. AC obtained by carbonization of lignin, followed by activation in KOH, was chosen as the positive electrode material. Electrochemical tests have shown that structure modification allows the higher current loads to be applied because of the substantial changes in the mechanism of charge storage in the prepared materials.
Experimental
Synthesis of RGO and carbon material
GO was synthesized from graphite powder (G) (SL-20, Superior Graphite) by modified Hummers method.[ Reference Hummers and Offeman 14 ] The details of the process can be found elsewhere.[ Reference Galiński and Acznik 15 ] Obtained GO was reduced through thermal and chemical methods. The thermal reduction was conducted in a tube furnace in a nitrogen atmosphere. The process was carried out at 250 °C within 2 h with a heating rate of 5 °C/min. The chemical reduction was performed by reaction of GO (aqueous solution) with NaBH4 (B) or NH2NH2 (H), as reducing agents. Each mixture was heated to a temperature of 90 °C and kept under continuous stirring. Two chemically reduced graphite oxides (CRGO-B and CRGO-H) precipitated as a black solid. The obtained products were filtered, washed several times with distilled water and ethanol and dried under vacuum at 65 °C. The AC, applied as a positive electrode material, was prepared by carbonization of commercial lignin (Aldrich) in a tube furnace (N2, 650 °C, 1 h) followed by chemical activation with potassium hydroxide in a ratio of 1:4 (C:KOH) at a temperature of 850 °C (N2, 1 h). The resulting carbon material underwent a multi-step purification process to remove all contaminants.
Physicochemical characterization
Scanning electron microscope (SEM, EVO®40, ZEISS) was employed to analyze the morphology of the materials. The porosity and the BET (Brunauer–Emmett–Teller) surface area were determined from nitrogen adsorption/desorption isotherms recorded at 77 K using an ASAP2010 (Micromeritics, USA). The estimation of elemental compositions (C, H, and N) was performed using Vario MICRO CUBE (Elementar Analysensysteme GmbH, Germany). The structure identification after oxidation and reduction processes was conducted with the Raman DXR microscope (Thermofisher, USA).
Electrodes preparation and electrochemical measurements
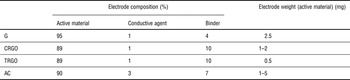
All materials in the form of dense slurry were coated onto metal foils (Cu for the negative electrode and Al for the positive electrode) serving as current collectors. An aqueous solution of CMC (Carboxymethyl Cellulose, MTI Corp.) and SBR (Styrene-Butadiene Rubber, MTI Corp.) were applied as binding agents for negative electrodes and polyolefin-grafted acrylic acid copolymer (Water-based Binder Powder, MTI Corp.) for positive ones. Acetylene black Super P and C65 (Timcal) were selected as conducting agents for negative and positive electrodes, respectively. The coating procedure was performed using automatic film applicator (Elcometer). Resulting electrodes were dried under vacuum to evaporate water. For the electrochemical tests, electrodes were cut in the form of disks with the surface area of 0.785 cm2. The proportions of the electrode ingredients, as well as the loading masses of active material per one electrode, are given in Table I. The loading masses of positive electrodes were two times higher than negative ones, to balance the exchanged charge.
The composition of electrodes.

Briefly, 1 mol/L LiPF6 in a solution of ethylene carbonate (EC) and dimethylcarbonate (DMC) (1:1 (v/v), Solvionic) was used as the electrolyte. The electrodes were separated by glass microfiber paper GF/A (Whatman™). All cells were assembled in an Ar-filled glovebox (MBraun, the H2O and O2 content below 0.5 ppm). The electrochemical measurements were carried out in two- and three-electrode Swagelok® systems with a VMP3 potentiostat/galvanostat (Biologic, France). Metallic Li foil (Aldrich) served as the reference electrode for three-electrode cells. All experiments were conducted at a room temperature in a voltage range from 3.0 to 4.4 V (hybrid systems). The theoretical capacity of graphite (372 mAh/g) was used in order to define C-rates applied in galvanostatic charging/discharging tests. Current regimes were calculated per active mass of both electrodes in the case of hybrid cells and per active mass of working electrode in the case of half-cells or three-electrode tests. The same principle has been applied for calculation of current densities obtained from cyclic voltammetry measurements. All potentials quoted in this manuscript refer to the Li/Li+ potential.
Pre-lithiation of negative electrodes
Pre-lithiation of the negative electrode plays a crucial role in the manufacturing of the LIC. During the first charging of graphite or disordered carbon materials (in Li-ion batteries or LICs), a significant number of the Li ions present in the system is consumed in the formation of a protective layer, the so-called solid electrolyte interphase (SEI). The SEI is formed by the decomposition products of the electrolyte solvent molecules and a Li salt, which affects the performance of the cell. Well-developed SEI film prevents electrolyte decomposition during subsequent cycles. Moreover, it simultaneously participates in Li-ion transport from electrolyte to negative electrode. To ensure an excess of Li ions in the system, thus avoiding the decrease of electrolyte conductivity, the pre-lithiation process can be realized using a Li metal electrode as a counter and a reference electrode, respectively. In this work, the pre-lithiation procedure was as follows: in the case of an electrode made of unmodified graphite, half-cell-labeled Li/G was charged with C/10 current rate to the potential of 0.06 V equal to ca. 70% of the maximum capacity. This level was established from preliminary tests in which the graphite anode was preloaded into various potential values (between 0.005 and 0.08 V). Systems with the RGO electrodes labeled Li/CRGO and Li/TRGO were pre-doped by Li ions to the potential of 0.005 V with the C/3 current rate. The lower potential level was caused by the structure type of modified materials. The irreversible reactions during formation of passivation layer at the surface of disordered materials affect the capacity strongly, decreasing its value during next cycles dramatically even up to 50%. Due to this fact and a complex mechanism of Li storage in a wider range of potential (in comparison with graphite), insertion of Li ions was held to the almost full state of charge of the RGO electrodes. All cells before preloading were left at OCP (open-circuit potential) for 12 h to stabilize before the intercalation/insertion process. After the pre-lithiation process, the Li electrode was removed and replaced by the AC one. Then the systems were subjected to electrochemical investigations.
Results and discussion
Structural characterization
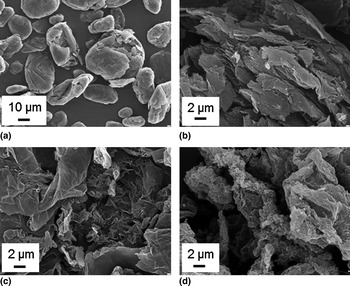
Figures 1(a)–1(d) show SEM images of the materials used in this study as negative electrodes of LICs. As one can see, the graphite material has the particles of regular shapes in a similar size. The modification processes led to delamination of graphite layers. SEM images show the expanded structure of the RGO materials with the folded morphology. Interestingly, the morphology of the produced materials differs depending on the reduction method. The structure of the TRGO material is rather lamellar, whereas the chemically reduced materials are more wrinkled.
SEM images of (a) G, (b) TRGO, (c) CRGO-B, and (d) CRGO-H.

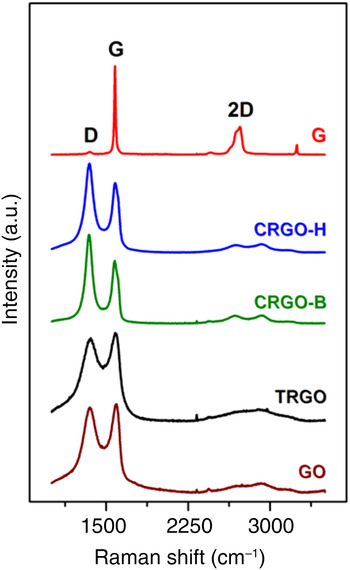
The delaminated structure of the materials was also confirmed by Raman spectroscopy. Figure 2 shows the spectra obtained for pure graphite and for graphite after oxidation and reduction. For the bulk graphite material, a characteristic sharp peak about 1580 cm−1 (G) indicating the high crystallinity of the material, and broad band at ~2700 cm−1 (2D) were observed. After exfoliation, the intensity of G band decreased significantly, whereas D band at ~1350 cm−1 appeared, which confirms structure disordering and presence of defects. In the case of chemically reduced materials, the D band is more intensive than G band, with good separation of peaks, inversely as for the material reduced thermally. The intensity of 2D band has also been reduced after chemical treatment, indicates the multilayered structure of the materials.[ Reference Dresselhaus, Jorio and Saito 16 , Reference Ferrari, Meyer, Scardaci, Casiraghi, Lazzeri, Mauri, Piscanec, Jiang, Novoselov, Roth and Geim 17 ]
Raman spectra.

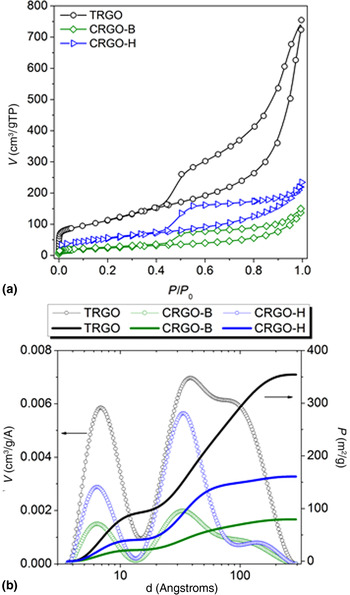
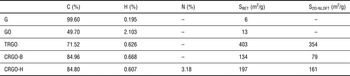
To determine values of specific surface areas of the materials before and after exfoliation, measurements of the nitrogen sorption at 77 K were done. The recorded isotherms are shown in Fig. 3(a). The shape of the curves indicates the presence of micropores, mesopores, and some macropores. However, the pore size distribution (PSD) based on the 2D-NLDFT model theory[ Reference Jagiello and Olivier 18 , Reference Jagiello and Olivier 19 ] revealed that mesopores are predominant [Fig. 3(b)]. Interestingly, calculated values of the surface area come mainly from mesopores. Moreover, the assumption of the energetical heterogeneity and/or geometrical corrugation of the surface of pore walls indicate that in practice active surface area is lower than that obtained from BET method (Table II). For the AC, Type I isotherm was recorded and reflected the microporosity of the material with pores sizes in the range of 6–12 Å mainly, required for EDLCs (electric double-layer capacitors). Elemental analysis was done to evaluate the degree of oxidation and reduction of the samples. The values of surface areas derived from nitrogen sorption at 77 K, as well as the C, H, and N elements content, are specified in Table II.
Surface characteristics on the basis of N2 sorption in 77 K: (a) adsorption/desorption isotherms—BET model; (b) values of the active surface area and PSD derived from the 2D-NLDFT model theory.

Content of C, H, and N elements in the materials and values of surface area (SBET and S2D-NLDFT from N2 sorption measurements in 77 K).

As one can see from Table II, reduction of oxidized graphite allowed the surface area of the materials to be developed significantly, compared with the basic material (G, 6 m2/g). The thermal reduction of GO brought BET value of 403 m2/g, while the chemical reduction was less effective, giving BET value of ca. 134 and 197 m2/g. The specific surface area lower from theoretical one (ca. 2600 m2/g) is caused by the stacking of the graphene oxide sheets which result in the partial overlapping and stacking of the reduced sheets which decreases the surface area of the bulk material.[ Reference Stankovich, Dikin, Piner, Kohlhaas, Kleinhammes, Jia, Wu, Nguyen and Ruoff 20 , Reference Srinivas, Zhu, Piner, Skipper, Ellerby and Ruoff 21 ]
Elemental analysis by pyrolysis (850 °C) in a pure oxygen atmosphere was performed to investigate the degree of reduction of synthesized materials. Oxidation of the graphite caused the creation of carbon–oxygen functional groups at the surface of the materials. Taking into consideration carbon content, in this case, the chemical reduction was more effective giving a higher concentration of carbon, thus lower amount of oxygen groups. In the case of hydrogen, after the reduction procedure its concentration was comparable in all samples, most probably arising from the trapped water molecules as well as hydroxyl groups. The nitrogen atoms found in CRGO-H material come from hydrazine. Incorporation of nitrogen from the reducing agent occurred presumably through a reaction of hydrazine with the carbonyl groups of GO.[ Reference Stankovich, Dikin, Piner, Kohlhaas, Kleinhammes, Jia, Wu, Nguyen and Ruoff 20 ]
Electrochemical measurements
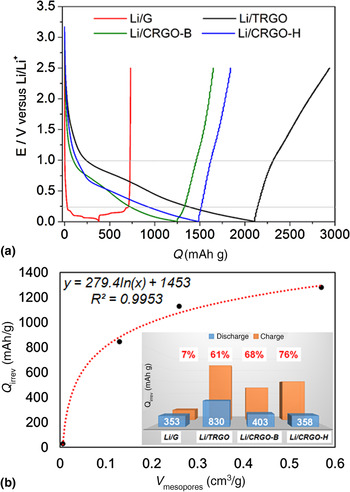
Figure 4(a) shows initial cycles of insertion/deinsertion of Li ions in graphite and exfoliated materials. For RGO electrodes, the general shape of the curves is similar, with wide potential range during the insertion step. For all cells, a reduction process begins below 1.5 V versus Li/Li+, whereas for graphite electrode characteristic three-stage “plateau” can be observed below 0.2 V versus Li/Li+. This means that the mechanism of Li storage has been changed as a result of structure modification. The capacity of initial charging was ca. 1250, 1500 and 2100 mAh/g for CRGO-B, CRGO-H, and TRGO, respectively. Nevertheless, a large part of this capacity was irreversible. Referring this capacity loss (related to SEI formation) to the porosity of the materials, it can be stated that the increase of the irreversible capacity is related to the increase of the mesopores volume in the material. The correlation shown in Fig. 4(b) indicates the logarithmic dependence between these two parameters, which means that the increase of capacity loss is strongly affected even by the smallest structure changes. In a crystallite of graphite, one can distinguish the two characteristic planes, i.e., basal and edge sites. The SEI formation process runs differently at these two planes. Thus, the ratio of basal to edge planes determines the electrochemical performance of the negative electrodes. Li ions predominantly intercalate into the graphene layers through the edge planes. Interestingly, edge sites provide better reactivity than basal ones. Thus, electrolyte decomposition occurs at edge sites first.[ Reference An, Li, Daniel, Mohanty, Nagpure and Wood 22 ] Keeping in mind the latter, disordering of the graphite structure will cause an increase in the edge sites number in the materials. This phenomenon will result in an increase of irreversible capacity related to the higher surface area, which has to be covered. The inset of Fig. 4(b) shows a comparison of capacity loss during first charging/discharging cycle for all presented materials. As can be seen, for RGO materials the capacity loss is about 10 times greater than for the graphite anode. This feature is the main drawback of disordered materials, employed as negative electrodes of Li-ion batteries. For hybrid systems (e.g., LICs) the preparation of the lithiated negative electrode states an essential step. In the case of amorphous or highly defected materials, high irreversible capacity causes a significant decrease of Li concentration in the electrolyte (SEI formation), thus reducing its conductivity. Consumption of Li ions from the electrolyte leads to decreasing of liquid phase mass transport and increasing of electrolyte resistance, thus decreasing power density. Taking into consideration above mentioned, the entirety of the negative electrode surface has to be cover by SEI layer to preserve from the undesired decomposition of the electrolyte. Therefore, it is important to provide a sufficient number of the Li ions into the working system, especially for exfoliated electrode materials. In this case, the number of Li ions contained in the electrolyte is not sufficient to produce a well-developed SEI layer without affecting electrolyte conductivity. Thus, the introduction of the pre-lithiation process with Li metal electrode is necessary.
(a) Initial galvanostatic charging/discharging curves (current rate: C/3). (b) Correlation between capacity loss and mesopores volume; comparison of the initial charging/discharging capacities (inset).

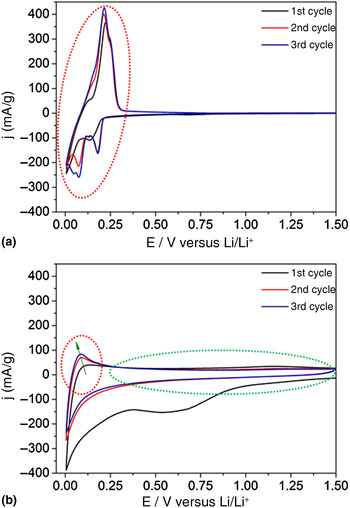
The mechanism of Li storage in case of disordered materials is more complex than for graphite. Figure 5 shows an example of cyclic voltammetry curves, in which different responses of the systems during Li insertion/de-insertion can be observed. For the graphite anode, the process takes place in a narrow working range with visible peaks of redox reactions (marked by red dotted line). Analyzing the graph for CRGO-B, two particular working areas can be distinguished. Green dotted line circle indicates the region of the reactions of pseudocapacitive character (relatively fast and reproducible Li deposition at pores), whereas red dotted line (circles) points out residual peaks of redox reactions (rather slow Li insertion between graphene layers and microvoids) rising successively with cycles. Noticeable voltage hysteresis during the first cycle is a result of irreversible reactions, involved in SEI formation mainly. The integration of multiple mechanisms of Li storage accelerates the reactions occurring on negative electrode composed of RGO. Due to this fact, the storage reactions are faster than the redox one on graphite negative electrode.
Cyclic voltammetry curves recorded for (a) G and (b) CRGO-B anode materials performed in half-cells versus Li metal as a counter and reference electrodes. Scan rate: 0.05 mV/s.

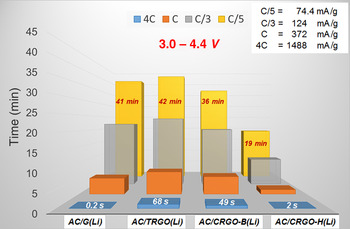
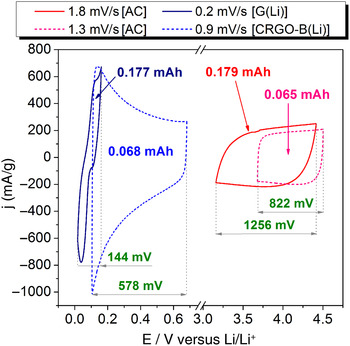
The benefit of the complex process of Li ions deposition in the graphene-based material can be seen in Fig. 6. Comparing the time of full charging/discharging cycle for systems built of different materials, substantial difference mostly in higher current regimes is noticeable. Considering the highest current load (4C ~ 1.5 A/g) extended response time were obtained for AC/TRGO(Li) (68 s) and AC/CRGO-B(Li) (49 s) cells. This means that for these systems higher energy and power densities can be obtained if compared with the system based on the graphite anode [AC/G(Li)]. Demonstration of this particular behavior is shown on the cyclic voltammetry curves recorded in three-electrode cells for capacitors with graphite and CRGO-B negative electrodes. Figure 7 presents voltammogram for positive (red line) and negative (blue line) electrodes separately. Considering the negative electrodes, disarrangement of the graphite structure led to change of the potential range by increasing it from 144 to 578 mV without affecting the capacity of the electrode. At the same time, the inclusion of pseudo-capacitive mechanism has accelerated the Li deposition in the negative electrode. As a result, the working conditions of the positive electrode were also improved.
Time of full charging/discharging cycle under various current loads.

Cyclic voltammetry curves recorded in three-electrode cells for AC/G(Li) (straight lines), and AC/CRGO-B(Li) (dotted lines) hybrid systems.

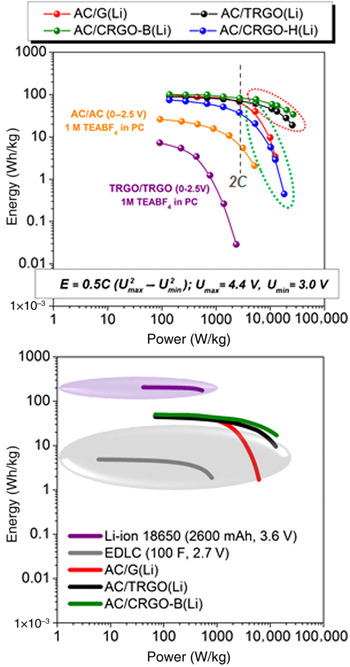
The energy/power profiles for all investigated LICs are shown in Fig. 8(a). The formula used to calculate the energy of the investigated systems is given at the bottom of the graph. Importantly, this equation is valid when capacitance (C) is expressed per mass of both electrodes or the entire system (with current collectors, separator, electrolyte, etc.). A typical AC/AC and TRGO/TRGO symmetric cells were constructed for comparison purposes. The energy densities for this two systems working in an organic electrolyte (1 M TEABF4 in PC) were significantly lower than for the hybrid ones, especially for the TRGO material. Ragone chart [Fig. 8(a)] shows the beneficial effect of hybridization of the capacitors—high-energy and power densities can be obtained in a wide range of current loads (C/10–20C). Obtained results revealed that for almost all applied materials the energy densities had been maintained at the level between ca. 100–70 Wh/kg for mild current rates (below 2C). Interestingly, only for AC/TRGO(Li) and AC/CRGO-B(Li) hybrid capacitors loaded with currents in a range of 2C–20C, high values of energy densities were obtained. Due to the increase of the surface area after the exfoliation of the graphite material, some diffusion limitations were eliminated, hence high-power densities were also possible to achieve. Finally, the AC/CRGO-B(Li) system demonstrated the energy density of 34 Wh/kg at a power density of 26 kW/kg. For the system with a graphite anode rapid decrease of energy density in higher current regimes (above 2C) was noted. Moreover, in the case of the materials reduced chemically, delivered data indicate the influence of the kind of reducing agent on the electrochemical performance of the device. Performed tests have shown a beneficial effect of sodium borohydride on electrochemical properties of the resulting material, compared with the material reduced with hydrazine. To compare investigated systems with commercially available energy storage devices, obtained energy and power densities were recalculated assuming 50% loss related to the mass of current collectors, electrolyte, separator, binders, and packaging. As comparative examples, Maxwell electric double-layer capacitor (100 F, 2.7 V) and EEMB Li ion battery (18650 type, 2600 mAh, 3.6 V) were chosen. Pale violet and pale gray ellipses indicate efficiency range of various types of supercapacitors and Li-ion batteries, available on the market. Obtained results, shown in Fig. 8(b), indicate the enhanced efficiency of hybrid systems, especially those built of RGO materials. Achieved energy density level is above the range given in the literature for the commercial supercapacitors, as well as the power density, which is much higher than in the case of Li-ion batteries. Synthesized materials implemented as electrodes of Li-ion capacitors underwent galvanostatic charging/discharging in order to determine cycle performance. Received data have shown that RGO materials are able to work for over 2000 cycles maintaining efficiency above 80%, even at high-current rates (2C–8C).
Ragone plots for (a) investigated laboratory systems (energy and power density expressed per active mass of both electrodes) and (b) the same systems compared with the commercially available capacitor and Li-ion battery (energy and power density expressed per mass of whole devices).

Conclusions
Performed electrochemical tests have shown that graphite electrode limits the power performance of the Li-ion capacitors because of the faradaic character of charge accumulation. In this case, RGO can be applied instead of graphite, giving merged faradaic and capacitive response. Obtained results displayed the advantage of LICs built of RGO negative electrodes, which are able to provide energy in the range of 20–100 Wh/kg accompanied by the excellent power of 26 kW/kg.
In summary, the electrochemical tests have shown that the modification of graphite structure can change the mechanism of charge storage in the electrode material, thus enhance power/energy efficiency of the LIC loaded with high-current rates. Nevertheless, one must be aware that some drawbacks of graphene-like materials, such as the high irreversible capacity of the first cycle, affect the performance of the total system. The correlation between capacity loss during SEI formation and porosity of the materials has indicated that the increase of irreversible capacity is strongly affected even by the smallest structure changes. Moreover, the logarithmic tendency indicates that the most significant changes occur rapidly at the beginning of the structure exfoliation.
Acknowledgments
Financial support from the National Science Centre of Poland (grant number DEC-2013/09/D/ST5/03886) is gratefully acknowledged.