Introduction
Wheat (Triticum aestivum L.) is one of the world's major cereal crops being used for a wide range of food products (Shewry, Reference Shewry2018). Wheat is important worldwide, with an annual production forecast in 2020 of approximately 761.7 million tons (FAO, 2020). Similar to other crops, wheat is subjected to biotic and abiotic stresses that reduce yield. Among abiotic stresses, drought is one of the most important and critical factors significantly affecting the productivity of wheat (Ahmed et al., Reference Ahmed, Sajjad, Li, Azmat, Rizwan, Maqsood and Khan2019). In cereal crops, including wheat, water stress coupled with heat at different crucial stages, such as seedling, tillering and reproductive stages, may cause yield reductions to lethality (Farooq et al., Reference Farooq, Hussain and Siddique2014; Morales et al., Reference Morales, Ancín, Fakhet, González-Torralba, Gámez, Seminario, Soba, Ben Mariem, Garriga and Aranjuelo2020). With progressive climate warming, population growth and consequently increased water shortages, wheat productivity is frequently compromised (Lesk et al., Reference Lesk, Rowhani and Ramankutty2016; Mao et al., Reference Mao, Li, Wang, Cheng, Li, Mei, Chen and Kang2020).
The phenomenon of drought tolerance is highly complex, so the quantification of drought tolerance must be based on grain yield under stress and non-stress conditions, resulting in the selection of varieties that give better yields under stress conditions (Shirinzadeh et al., Reference Shirinzadeh, Zarghami, Azghandi, Shiri and Mirabdulbaghi2010; Geravandi et al., Reference Geravandi, Farshadfar and Kahrizi2011). Conventional breeding methods for improving drought tolerance in crop plants are primarily based on screening germplasm and empirical selection for yield under different drought stress environments; however, yield is also a complex trait and is strongly influenced by the environment (Khan et al., Reference Khan, Tong, Wang, He, Zhao and Gai2018). Consequently, yield improvements in drought-prone environments can be made by identifying the secondary traits involved in drought tolerance (i.e. drought tolerance indicators) that have a high correlation with yield (Khan et al., Reference Khan, Iqbal, Akram, Ahmad, Hassan and Jamil2013).
With rapid fluctuations in climatic conditions, an increase in the frequency and severity of drought in wheat-growing areas demands the development of drought-tolerant genotypes. Many high-yielding wheat genotypes are being grown in Pakistan, but their current status regarding drought tolerance has not yet been fully explored. Therefore, the present study was designed to evaluate the drought tolerance status of 14 high-yielding wheat varieties based on morphological characteristics and various tolerance indices. The information derived from this study will be valuable in breeding drought-tolerant wheat and the early selection of genotypes with the desirable attributes to be incorporated into breeding programmes.
Materials and methods
This study was conducted over two years (2018 and 2019) on the experimental farm of the Department of Plant Breeding and Genetics, The Islamia University of Bahawalpur, Pakistan. Varieties used in this experiment were taken from the Regional Agriculture Research Institute Bahawalpur. The experiment comprised 14 varieties × two water treatments (normal and drought stress) organized as a randomized complete block design factorial with three replications. Wheat varieties were grown in pots (12-inch diameter × 18-inch height) filled with 12 kg of soil. Three pots for each variety (42 pots for normal and 42 pots for drought, in total) were watered regularly to pot capacity until 50 d after sowing. From this stage, water was withheld in drought-treated plants until day 15 of the first drought regime. When the drought-treated plants started to show signs of severe wilting based on visual assessment, plants were re-watered to 100% soil water capacity (1 litre). Drought-treated plants were again subjected to a second drought by withholding water for an additional 13 d, resulting in a total drought period of 28 d. The non-stressed plants were maintained at 100% soil water capacity (Yadev et al., Reference Yadav, Carroll, Estavillo, Rebetzke and Pogson2019). The salient features of 14 high-yielding wheat varieties used in the current study have been mentioned in Supplementary Table S1.
Data collection
At the time of maturity, data were collected for different morphological traits under studied conditions. In each pot, three randomly selected healthy plants were tagged to record the observations. Plant height (cm) was measured from plant base to spike tip with the help of a meter rod. Number of fertile tillers/plant was calculated from each replication. Spike length (cm) was taken from base to top of the spike from main tillers excluding awns. Number of spikelets/spike was calculated from the main tillers of each selected plant. Spike was detached from each plant, and spike weight (g) was measured through electronic balance. The total number of grains/spike was calculated from the spike of the main tiller of each selected plant. Harvested plants were threshed and grain yield/spike was recorded in grams with the help of an electric balance. The weight of 1000 grains (g) was also measured with an electronic balance. Total above-ground biomass/plant (g) was taken from each treatment. Flag leaf area (cm2) was measured by using the formula: Flag leaf area = Flag leaf length × Flag leaf width × 0.75 (Edae and Byrne, Reference Edae and Byrne2013; Yang et al., Reference Yang, Liu, Cheng, Chang, Chen, Chai and Li2016).
Statistical analysis
Data were recorded from traits during the growing season and plant development. Analysis of variance (ANOVA) was performed for each character measure (Steel et al., Reference Steel, Torrie and Dieky1997). Relationships between characters were examined by correlation analysis. Means were compared using the LSD test (Steel et al., Reference Steel, Torrie and Dieky1997). Various drought stress indices were used to evaluate the varieties.
Reduction/change in morphological traits under drought as compared to normal was calculated using the following formula:
 $${\rm Reduction\ in\ trait\ }( {\rm \% } ) \;{\rm under\ drought} = \left({ 1-\displaystyle{{{\rm Performance\ under\ drought\ condition}} \over {{\rm Performance\ under\ normal\ condition}}}} \right)\,\times \,100.$$
Drought resistance indices were calculated using the following formulae
 $${\rm \; \; SSI} = \displaystyle{{\left\{ {1-\left( {\displaystyle{{Y_{\rm s}} \over {Y_{\rm p}}}} \right)} \right\}} \over {1-\displaystyle{{{\bar{Y}}_{\rm s}} \over {{\bar{Y}}_{\rm p}}}}}\;{\rm (Fischer \;and\; Maurer, \xlink{bmk_S1479262121000290_ref13} \, {1978})}$$
where Y s = is the grain yield under stress, Y p = the grain yield under non-stress condition. Ῡ s and Ῡ p are the mean grain yields of all varieties under stress and non-stress conditions, respectively.  $1-{{{\bar{Y}}_{\rm s}} \over {{\bar{Y}}_{\rm p}}}$ = is the stress intensity.
 $${\rm MP} = \displaystyle{{Y_{\rm p} + Y_{\rm s}} \over 2}\;\quad{\rm (Rosielle\; and\; Hamblin, \xlink{bmk_S1479262121000290_ref25}{1981})}$$
 $${\rm TOL} = Y_{\rm p}-Y_{\rm s}\quad{\rm (Rosielle and Hamblin, \xlink{bmk_S1479262121000290_ref25}{1981})}$$
 $${\rm STI} = \displaystyle{{Y_{\rm p} \times Y_{\rm s}} \over {{( {{\bar{Y}}_{\rm p}} ) }^2}} \quad{\rm (Fernandez, \xlink{bmk_S1479262121000290_ref12}{1992})}$$
 $${\rm GMP} = ( {Y_{\rm p} \times Y_{\rm s}} ) ^{0.5}\quad {\rm (Fernandez, \xlink{bmk_S1479262121000290_ref12}{1992})}$$
 $${\rm Yield\;Index}( {{\rm YI}} ) = \displaystyle{{Y^{\rm s}} \over {{\bar{Y}}_{\rm s}}}\quad {\rm (Lin\; et al., \xlink{bmk_S1479262121000290_ref20}{1986} \! ; \; Gavuzzi\; et \, al., \xlink{bmk_S1479262121000290_ref14}{1997})}$$
 $${\rm Yield\;Stability\;Index}( {{\rm YSI}} ) = \displaystyle{{Y^{\rm s}} \over {Y_{\rm p}}}\quad {\rm (Bouslama\; and \;Schapaugh, \xlink{bmk_S1479262121000290_ref6}{1984})}$$
MP, mean productivity; TOL, tolerance; GMP, geometric mean productivity; STI, stress tolerance index; YI, yield index; YSI, yield stability index; SSI, stress susceptibility index.
Results
Assessment of genetic variation under normal and drought stress conditions
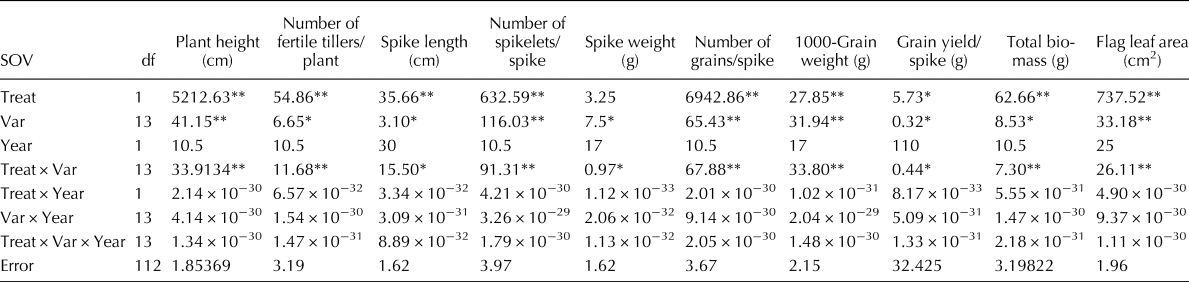
ANOVA results (Table 1) showed that there were highly significant differences under both levels of significance (P < 0.01 and P < 0.05) among all varieties and moisture treatments, indicating that there could be potential for drought tolerance among the genotypes based on all the traits. The Variety × Year and Variety × Year × Treatment interactions were non-significant for all traits, which implies that the genotypes performed quite consistently between the two years; therefore, average values across the two years were taken and discussed.
Mean square values for various morphological traits of 14 wheat varieties evaluated for two years under two treatments (normal and drought stress conditions)

Treat, treatment; Var, variety; SOV, source of variation; df, degrees of freedom.
** P < 0.01, *P < 0.05.
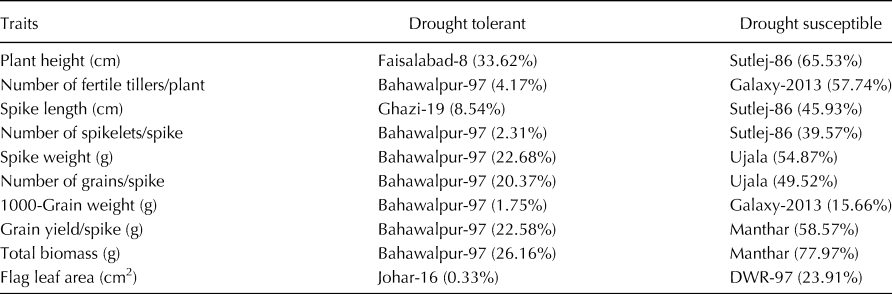
Mean comparisons for various morphological traits under drought stress and normal conditions are shown in online Supplementary Table S2. Sutlej-86 had the shortest plant height under drought, as the reduction was maximum (65.53%), while Faisalabad-8 showed tolerance against drought with a minimum height reduction (33.62%) (Table 2). Sutlej-86 also showed a maximum reduction in spike length (45.93%) and number of spikelets/spike (39.57%), followed by Manthar, with a maximum reduction in grain yield/spike (58.57%) and total biomass (77.97%). For the number of fertile tillers per plant, Galaxy-2013 showed the highest reduction under drought stress (57.74%), while Bahawalpur-97 had a minimum reduction under drought stress (4.17%). Similarly, Bahawalpur-97 also showed minimum reductions in the number of spikelets/spike (2.31%), spike weight (22.68%), number of grains/spike (20.37%), 1000-grain weight (1.75%), grain yield per spike (22.58%) and total biomass (26.16%) (Table 2). A trait-wise comparison of the best- and worst-performing varieties is shown in online Supplementary Table S3.
Reduction percentage (lowest and highest) in wheat varieties

Correlation studies
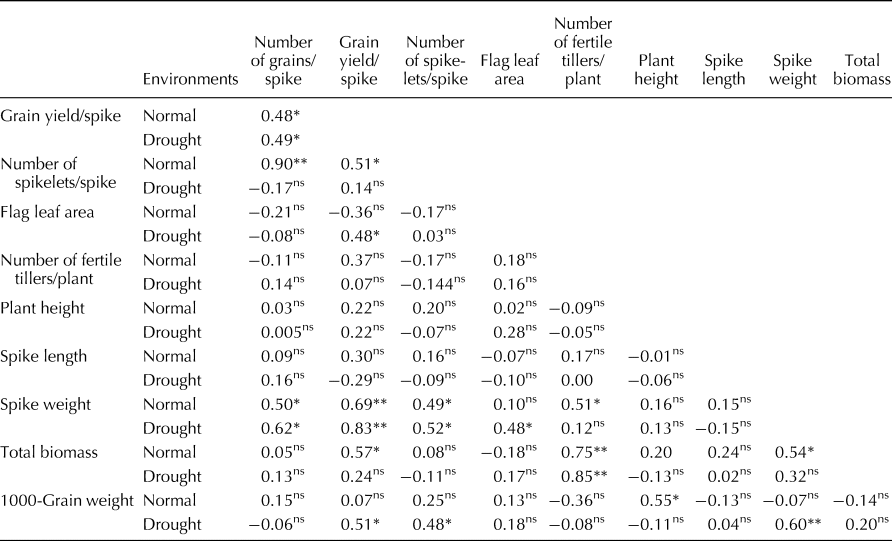
Associations among traits under both normal and stress conditions were calculated, in which some traits had a positive association while others had a negative association with each other (Table 3). Grain yield/spike had a significant and positive correlation with the flag leaf area under drought (0.48*). Similarly, for correlations under drought, spike weight was positively and highly significantly correlated with grain yield/spike (0.83**), flag leaf (0.48*) and the number of grains per spike (0.62*). Under normal conditions, spike weight was also highly positively and significantly correlated with grain yield/spike (0.69**), the number of grains per spike (0.50*), the number of spikelets per spike (0.49*) and the number of fertile tillers per plant (0.51*). Similarly, under normal conditions, total biomass was positively and significantly correlated with spike weight (0.54*) and grain yield/spike (0.57*). For correlations under drought, 1000-grain weight was positively and significantly correlated with grain yield per spike (0.51*) and spike weight (0.60**). Thousand-grain weight was positively correlated with plant height (0.55*) under normal conditions. Likewise, for correlations under both normal and drought stress conditions, the number of fertile tillers per plant was found to be positively and highly significantly correlated with total biomass (0.75** and 0.85**, respectively). The number of spikelets/spike was positively and significantly correlated with 1000-grain weight (0.48*) under drought conditions but was non-significant under normal conditions (0.25) (Table 3). Stronger correlations among all attributes under drought stress over normal conditions highlighted drought stress adversities.
Correlations analysis among traits under both treatments

ns, Non-significant.
** P < 0.01, *P < 0.05.
Resistance indices
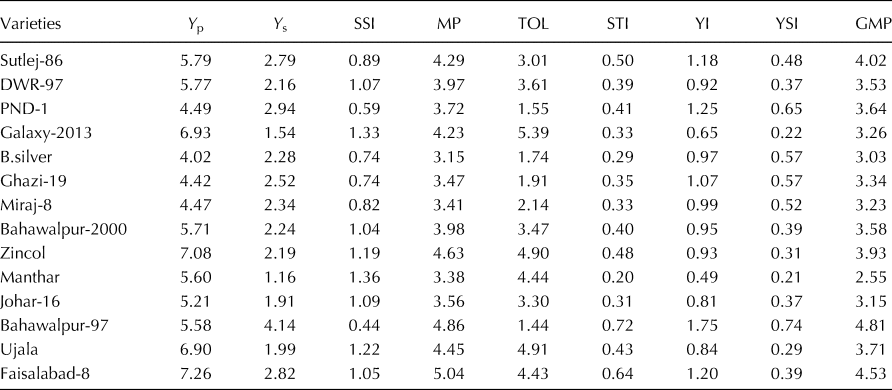
The different resistance indices greatly varied in their magnitude, reflecting their differences in identifying tolerant and sensitive varieties. The Manthar variety showed the maximum SSI (1.36), while Bahawalpur-97 showed the minimum SSI (0.44) and TOL (1.44); Faisalabad-8 showed the highest MP (5.04), and B.silver showed the lowest MP (3.15); and Bahawalpur-97 had the highest YI (1.75) and YSI (0.74), while Manthar had the lowest YI (0.49) and YSI (0.21) (Table 4). According to the resistance indices, the lowest values of SSI and TOL indicate that the most tolerant variety under drought stress is Bahawalpur-97, which could be suitable for use under drought stress conditions.
Mean values of tolerance and susceptibility indices of wheat varieties under drought stress condition

Y p, grain yield under non-stress conditions; Y s, grain yield under stress condition; MP, mean productivity; TOL, tolerance; GMP, geometric mean productivity; STI, stress tolerance index; YI, yield index; YSI, yield stability index; SSI, stress susceptibility index.
Discussion
Drought is a global threat, specifically for countries with agricultural-based economies, and there is a dire need to overcome this problem by developing and selecting drought-tolerant genotypes (Grzesiak et al., Reference Grzesiak, Hordyńska, Szczyrek, Grzesiak, Noga and Szechyńska-Hebda2019). Therefore, in the current study, high-yielding bread wheat varieties with diverse genetic backgrounds were evaluated under drought stress and non-stress conditions. Plant height is a vital agronomic parameter for drought tolerance assessment (Zhang et al., Reference Zhang, Hao, Ren, Chang, Liu and Jing2011; Su et al., Reference Su, Wu, Ao, Jin, Qin, Liu, Pang, Liu and Guo2019). Under water-deficit conditions, the inter-nodal distance becomes shorter, resulting in reduced plant height. Therefore, under water-deficit conditions, reduced plant growth cannot achieve the optimum utilization of nutrients. The present results are consistent with the findings of Pandey et al. (Reference Pandey, Shrestha, Subedi and Shah2020) and Tack et al. (Reference Tack, Barkley and Hendricks2017), who reported that a significant relationship exists between varieties and irrigation levels. The number of tillers/plant has a pivotal role in obtaining maximum grain yield. This trait is an important criterion for the selection of genotypes under water-deficit conditions (Mahmood et al., Reference Mahmood, Abdullah, Ahmar, Yasir, Iqbal, Yasir, Ur Rehman, Ahmed, Rana, Ghafoor and Nawaz Shah2020). Under drought conditions, the number of fertile tillers decreases, which ultimately affects grain yield (Dong et al., Reference Dong, Yang, Liu, Qiao, Zhang, Wang, Xie and Liu2019). Likewise, other traits are also greatly decreased under drought stress conditions, and negative effects of drought on wheat performance as well as genotypic differences in response to drought have been previously reported by Ahmed et al. (Reference Ahmed, Sajjad, Zeng, Iqbal, Khan, Ullah and Akhtar2020), which further strengthen the present findings.
Correlation coefficients define the strength of the relationship between two variables or factors. Correlation coefficients are valuable in plant breeding since they can show an association that can be exploited for predictions in practice, and these coefficients offer evidence about the relationship between several preferred traits. Correlation coefficients offer a core concept of the association among various yield-contributing traits, which is beneficial for plant breeders in choosing varieties having desirable attributes (Ahmed et al., Reference Ahmed, Sajjad, Li, Azmat, Rizwan, Maqsood and Khan2019). For correlations under both drought and normal irrigation, spike weight was positively and highly significantly correlated with grain yield/spike. Under normal conditions, total biomass was positively and significantly correlated with spike weight and grain yield/spike and these results are in agreement with the findings of Djuric et al. (Reference Djuric, Prodanovic, Brankovic, Djekic, Cvijanovic, Zilic, Dragicevic, Zecevic and Dozet2018). Similarly, under normal and drought stress treatments, the number of fertile tillers/plant was highly and significantly correlated with total biomass. Hence, selection of any one of these traits enhances the performance of other traits. Flag leaf area was either negatively or non-significantly correlated with most of the traits under both drought stress and normal conditions, except for spike weight and grain yield/spike under drought. Therefore, selection for this trait may not result in much improvement in genetic gain for drought tolerance in the studied germplasm.
Tolerance indices are recognized as important selection criteria for identifying drought-tolerant genotypes (Ballesta et al., Reference Ballesta, Mora and Pozo2020). Bahawalpur-97 had the highest YSI, YI and the lowest SSI and TOL indices. According to Semahegn et al. (Reference Semahegn, Shimelis, Laing and Mathew2020), three selection indices, SSI, TOL and YSI, favoured genotypes with high yields under drought stress and low yields under non-stress conditions. Our results are also in accordance with the findings of Anwaar et al. (Reference Anwaar, Perveen, Mansha, Abid, Sarwar, Aatif, ud din Umar, Sajid, Aslam, Alam, Rizwan, Ikram, Alghanem, Rashid and Khan2020), who also recommended that the lowest values of TOL and SSI are linked with the lowest sensitivity to drought and that selection based on these indices directs the development of high-yielding genotypes under drought conditions. The best-performing variety (Bahawalpur-97) under drought stress conditions can be useful in future wheat breeding programmes, and early selection for the traits recommended in this study will be effective for developing high-yielding and drought-tolerant wheat varieties.
Supplementary material
To view supplementary material for this article, please visit https://doi.org/10.1017/S1479262121000290
Conflict of interest
None.
Ethical statement
Compliance with ethical standards.