Introduction
Nonvolatile memories in production today are mainly using charge storage as the memory mechanism. For niche applications, alternatives such as ferroelectric random access memory (RAM),Reference Eliason, Madan, McAdams, Fox, Moise, Lin, Schwartz, Gallia, Jabillo, Kraus and Summerfelt1 magnetoresistive RAM,Reference Tehrani2 and phase change RAMReference Lee, Cho, Cho, Kang, Choi, Oh, Lee, Kim, Park, Wang, Park, Ro, Choi, Kim, Kim, Shin, Lim, Cho, Choi, Chung, Kim, Yoon, Yu, Jeong, Jeong, Kwak, Kim and Kim3 are available in the market. However, all of these alternative memories have significantly larger memory cell sizes than in established memory technologies. In principle, it is recognized that using a resistance value that can be controlled by a voltage or current (resistive switching [RS]) is better suited than the traditional concept of storing charge from the viewpoint of cell size scalability.Reference Waser4, Reference Prall5 A large number of RS mechanisms are reported in the literature.Reference Waser, Dittmann, Staikov and Szot6 This article focuses on both the unipolar (or non-polar) thermochemical and the bipolar valence change mechanisms as two promising RS effects in several metal oxide systems. Other resistive switching mechanisms are covered in the Raoux et al. and Lu et al. articles in this issue.
Requirements of a memory cell
Research on alternative memories can be divided into two main areas:
• The search for nonvolatile RAM (NVRAM).
• The search for the highest density of data storage (HDDS).
Both areas have different target parameters that have to be considered during development. NVRAM requires a fast (few nanoseconds) bitwise access to every memory cell as well as unlimited read and write endurance. Cost and power consumption are additional important factors in potential NVRAM technologies.
HDDS, on the other hand, solves the performance issue by writing and reading large data portions in parallel. This directly translates into the necessity of having a very low-power write mechanism. Lowest cost per bit is another extremely important requirement. In contrast to the NVRAM case, bitwise access is not required, and, as in today’s flash memories, one is accustomed to the procedure of many bits being erased in parallel (block erase). Additionally, write/erase cycling is limited to 1,000–10,000 cycles, about 10 orders of magnitude lower than in the NVRAM case. In the HDDS, many reliability constraints can be relaxed since the parallel access allows the application of powerful error correction codes. NVRAM and HDDS, therefore, need significantly different optimizations of the memory cell and memory architecture.
For RS memories, integration into the memory matrix is as important as the intrinsic material properties. The principal ways of integrating a resistive cell into a memory array is the cross-point arrangement or the transistor-based cell (see the Introduction article in this issue). HDDS requires the stacking of memory cells in the third dimension.Reference Pinnow and Mikolajick7 For NVRAM, however, the unwanted influence of the read/write operation on other bits (disturb) will probably call for a transistor access device. Proper positioning of RS memories and their integration method should be proposed considering their characteristics, merits, and drawbacks.
Classification of current-voltage hystereses
In this section, an overview of RS phenomena is presented by classifying typical I-V hystereses. However, it should be noted that the viewpoints of the microscopic mechanism of RS phenomena have not reached a complete consensus.Reference Sawa8 This classification is not monolithic, and boundaries are essentially blurred; nevertheless, cursory classification should be helpful in organizing and reconstructing the volume of research in this field.
Continuous and fuse-antifuse switching
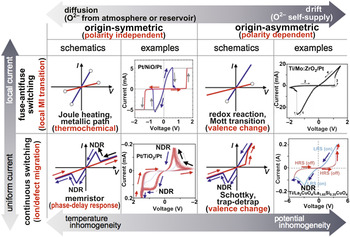
I-V curves of RS phenomena are classified into two different types, as shown in Figure 1. The top row corresponds to so-called fuse-antifuse switching,Reference Waser, Dittmann, Staikov and Szot6 because the sudden change in resistance is similar to a fuse operation, while the bottom one is called continuous switching, where the current undergoes gradual changes. In general, the resistance change can be ascribed to spatiotemporal pattern formations under a sufficiently high electric field or current.Reference Ridley9–Reference Schöll11 When an inhomogeneity of voltage is formed, n-type negative differential resistance (NDR) is observed, as shown in Figure 1. NDR is widely considered to be a Schottky barrier with continuously alternating height/width at the metal/oxide interface due to the migration of charged ions and defects.Reference Pan and Shum12–Reference Smits, Meskers, Janssen, Marsman and de Leeuw14 Trapping-detrapping of the migrating electrons may also cause continuous switching with the NDR.Reference Odagawa, Sato, Inoue, Akoh, Kawasaki and Tokura15, Reference Kim, Choi, Lee, Kim, Song, Seok, Yoon, Han and Hwang16
Classification of I-V hystereses and typical examples. Blue and red lines correspond to low and high resistance states, respectively. Arrows indicate the direction of the hystereses. Origin symmetry means the topology of the hysteresis is symmetric with respect to the origin of the I-V plane. In practical MO RS devices based on thermochemical and valence change mechanisms, I-V curves are given as that of serial and/or parallel connections of those devices with different I-V curves, and each may depend on the sweep rate. Thus, the examples are not disparate, and the patterns of I-V hystereses may be changed over the blurred boundaries by tuning the size/amount of the local current paths and connection types (serial and/or parallel). (Reprinted with permissions from References Reference Sawa8, Reference Inoue, Yasuda, Akinaga and Takagi18, Reference Wang, Lee, Huang, Wu and Tseng23, and Reference Yang, Pickett, Li, Ohlberg, Stewart and Williams24 from Elsevier, American Physical Society, Institute of Physics, and Nature Publishing Group, respectively.) Note: NDR, negative differential resistance; LRS, low resistance state; HRS, high resistance state.

Generally, a sudden change in resistance at a threshold is observed in either the V- or I–sweep measurement.Reference Adler, Henisch and Mott17 This sudden change is related to the current constriction structure, also known as the filament, in which the current is confined. This local current path is ruptured and reconnected by a local phase transition or defect percolation called fuse-antifuse type switching. The phase transition can be either a structural or electronic transition, however, the most important point is the localityReference Inoue, Yasuda, Akinaga and Takagi18–Reference Wang, Lee, Huang, Wu and Tseng23 of the current path.
Polarity dependence and origin symmetry
Self-crossing I-V curves passing through the origin of the I-V plane are considered in this section. An explanation of origin-symmetryReference Yang, Pickett, Li, Ohlberg, Stewart and Williams24 is given by assuming that Joule heating and thermal diffusion of ions and defects are the dominant effects, since Joule heating is independent of the polarity of the applied voltage or current. Likewise, origin-asymmetry can be naturally associated with the electric field–driven drift of ions and defects along the direction of applied voltage or current. By controlling the strength of electroforming of the metal oxide films, modifying the metal/oxide interface, and changing the gas of ambient atmosphere, the size/amount of the local current paths are tuned.Reference Jeong, Schroeder and Waser25, Reference Shen, Dittmann and Waser26 Tuning the current paths changes the diffusion/drift balance, which alters the origin-symmetric nonpolar I-V hysteresis to origin-asymmetric bipolar I-V hysteresis, and vice versa.
Unipolar or non-polar switching
The unipolar RS mechanism usually involves the formation and rupture of localized conducting filaments (CFs) by thermochemical reactions,Reference Waser, Dittmann, Staikov and Szot6 which result in a sudden change of resistances in a given memory cell. In a filamentary RS cell, an initial “electroforming” step is usually required to enable subsequent RS processes because as-prepared RS oxide films are normally too insulating to induce reliable RS.Reference Kim, Jeong and Hwang27 Both electroforming (as-prepared → low resistance state [LRS]) and set (high resistance state [HRS] → LRS) processes increase the cell conductivity and induce CFs within the RS film. A reset process (LRS → HRS) can be performed by applying another electric bias through the cell, either in the same or opposite polarity, hence disconnecting the CFs partially or completely.Reference Kim, Kim, Song, Seok, Lee, Yoon and Hwang28, Reference Lee, Kim, Kim, Seok, Song, Yoon and Hwang29
Filament formation process during electroforming and set switching
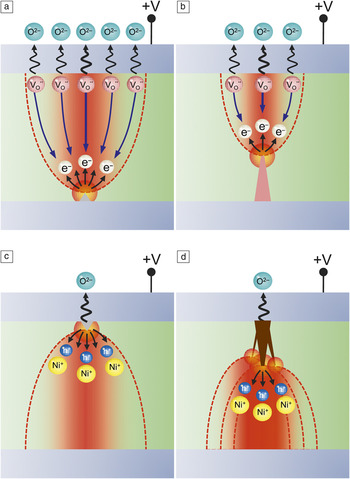
In many metal oxides, the conductivity is mainly determined by the degree of non-stoichiometry of the film.Reference Cho, Han, Ahn, Lee, Kim and Hwang30, Reference Mattioli, Filippone, Alippi and Bonapasta31 In a TiO2 thin film, which is a typical RS system based on the CF mechanism, the generation of ionic defectsReference Jeong, Schroeder, Breuer and Waser32, Reference Marucco, Gautron and Lemasson33 is accompanied by the generation of electronic carriers, thereby increasing the electrical conductivity. The CF formation in a switching oxide film through an electroforming (or set switching) process is described as a nucleation-and-growth process, which is depicted in Figure 2.Reference Kim, Jeong and Hwang27 In the case of a Ti-O based system, a significant amount of oxygen vacancies (VO) formed at the anodic interface under a positive top electrode (TE) bias will migrate to the cathode side due to the electrical field formed within the film.Reference Lee, Kim, Song, Rha, Seok, Jung, Kim, Yoon and Hwang34 Electrons are simultaneously injected from a local cathodic interface (maybe from an area where the interfacial Schottky barrier is the lowest and/or the local electric field is the highest). Joule heating by electronic injection should provide the system with the thermal energy needed to facilitate ionic migration. The injected electrons are diffusely transported to a wider area of anodic interface (red area in Figure 2). This is the area where most ionic drift occurs because the ionic migration is a thermally activated process. Once stable nuclei are formed at a localized spot, CF growth will be facilitated due to the enhanced local electric fields around the conducting nuclei. The CF naturally becomes narrower as it proceeds to the anode side, making the shape conical, as depicted in the purple region in Figure 2b.Reference Kim and Hwang35 The density of resulting local ionic defects may sometimes surpass the limit that can sustain the original crystal structure and cause local phase transitions into a metallic phase (e.g., Magnéli phase in a Ti-O system).Reference Kwon, Kim, Jang, Jeon, Lee, Kim, Li, Park, Lee, Han, Kim and Hwang36–Reference Liborio, Mallia and Harrison38
Schematic diagrams depicting the conducting filament (CF) formation process. In a TiO2-based cell, (a) the oxygen vacancies (VO) produced from a cathode interface are dragged to a location where electron injection occurs due to electrostatic force. (b) CF growth is facilitated once stable nuclei are formed, because the conducting nuclei enhance the local electric field, further enhancing the thermochemical reaction. (c–d) In a NiO-based cell, a similar reaction occurs, but the CF grows in the opposite direction since holes are the majority carriers in NiO. Reprinted with permission from Reference Reference Kim, Jeong and Hwang27. ©2011, IOP Science.

A NiO film has a much smaller electron affinity (∼2 eV) than a TiO2 film (∼4 eV), so the metal/oxide contact is more likely to be hole injecting. In contrast to an n-type case, this property makes the Joule heating effect most significant at a local area of the anodic interface, and the CF grows in the opposite direction as that of TiO2, as shown in Figure 2d. The absence of any Magnéli phases in the NiO system and the low affinity of Ni to oxygen renders the CF in this system more like a metallic Ni dendrite.Reference Chang, Lee, Chae, Lee, Liu, Kahng, Kim and Noh39 The conductance of a CF is reported to be directly related to the dissipated power during set switching,Reference Rohde, Choi, Jeong, Choi, Zhao and Hwang20 which in turn is influenced by the compliance currentReference Kim and Hwang35, Reference Chang, Lee, Chae, Lee, Liu, Kahng, Kim and Noh39 and the parasitic current components (e.g., capacitive charge of the RS cell and parasitic circuit capacitance).Reference Ielmini, Cagli and Nardi40, Reference Song, Kim, Kim, Lee, Seok, Jung and Hwang41
Filament rupture during the reset process
The exact mechanism of filament rupture (reset process) is currently not clear. The electric field–driven migration of oxygen ions may be considered,Reference Hwang, Lee, Buh, Bae, Choi, Kim, Hong, Kim, Byun, Lee, Ahn, Kang, Kang and Park42–Reference Yoshida, Kinoshita, Yamasaki and Sugiyama45 but this may not be highly probable, considering that the electric field should be suppressed significantly due to highly conducting filaments in a LRS film. It is more plausible to ascribe the CF rupture process to a thermal effect (i.e., heat-assisted ionic diffusion) or even phase transition by a melt-quenching process.Reference Kim, Jeong and Hwang27, Reference Chang, Lee, Chae, Lee, Liu, Kahng, Kim and Noh39, Reference Russo, Ielmini, Cagli, Lacaita, Spiga, Wiemer, Perego and Fanciulli46, Reference Russo, Ielmini, Cagli and Lacaita47
In order to improve set voltage/current uniformity and to reduce the reset power, information on the location, shape, and dimensions of CFs should be very helpful. However, direct observation of a ruptured CF along the length direction is not a trivial task.Reference Kwon, Kim, Jang, Jeon, Lee, Kim, Li, Park, Lee, Han, Kim and Hwang36, Reference Lee and Hwang48 Initially, Kim et al. made indirect observations on the location of a ruptured portion along CFs in a TiO2 filmReference Kim, Choi, Shin, Choi and Hwang49 and revealed that the rupture of CFs occurs at the anodic interface. The result is consistent with the recent direct observation of conical-shaped CFs in a TiO2 film using high-resolution transmission electron microscopy (HRTEM), where the CFs have a smaller diameter at the anode side and have a higher chance of disconnection.Reference Kwon, Kim, Jang, Jeon, Lee, Kim, Li, Park, Lee, Han, Kim and Hwang36
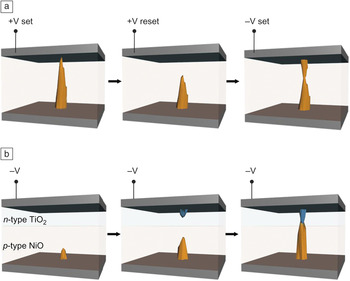
As the reset process in filamentary RS is attributed to a thermal process, the efficiency of heating CFs during reset switching directly affects the amount of power needed for CF rupture.Reference Chang, Chae, Lee, Liu, Noh, Lee, Kahng, Jang, Kim, Kim and Jung50 If CF rupture is localized in a region near the metal interface, a significant heat loss to the electrode should occur, which is not favorable for achieving a high thermal efficiency for the reset process.Reference Choi, Choi, Kim, Shin and Hwang51 In order to reduce heat loss, several researchers have reported on placing the switching region away from the metal interface.Reference Kim, Kim, Song, Seok, Lee, Yoon and Hwang28, Reference Kim, Lee, Seok, Song, Yoon, Yoon, Lee, Kim, Lee, Ryu, Park and Hwang52 The most desirable shape for a CF to maximize heating efficiency would be similar to an hourglass, where the most narrow portion resides at a location farthest away from the electrode interfaces. It is possible to make hourglass-like CFs through a series of bias applications with opposite polarities, as described in Figure 3a.Reference Kim, Kim, Song, Seok, Lee, Yoon and Hwang28, Reference Kim, Lee, Seok, Song, Yoon, Yoon, Lee, Kim, Lee, Ryu, Park and Hwang52 Another feasible method for achieving an hourglass-like CF is by using a stacked film comprised of n-type and p-type layers.Reference Kim, Song, Kim, Seok, Lee, Yoon, Park and Hwang53 As shown in Figure 3b, a negative bias on the TE starts to form a nuclei either on the top or bottom electrode interface. As a CF grows in one direction, the enhanced local electric field facilitates the growth of a counterpart CF from the other direction. In the resulting memory cell with the hourglass-like CF, the reset time decreased significantly from ∼10–100 μs to ∼100–200 ns.Reference Kim, Song, Kim, Seok, Lee, Yoon, Park and Hwang53
Schematic diagrams showing the sequence of forming an hourglass-like conducting filament (a) in single-layer TiO2 and (b) in a stacked cell comprised of an n-type TiO2 and a p-type NiO layer. Reprinted with permission from Reference Reference Kim, Jeong and Hwang27. ©2011, IOP Science.

Bipolar switching
As classified previously, bipolar switching refers to switching where opposite electrical bias polarities are needed for set and reset operations. Therefore, the electric field plays an important role in bipolar switching, where the mobile species inside the device are driven by the electric field bi-directionally rather than unidirectionally. This also resulted in a much higher endurance.54 In this section, Ti-O is used as a model system to show switching and electroforming mechanisms and their implications.
Electroforming process and electroforming-free devices
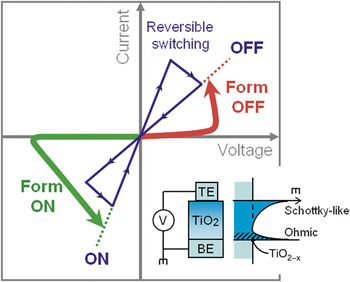
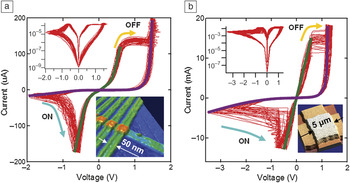
The electroforming process of bipolar switching is similar to that of unipolar switching mentioned previously involving a one-time application of high voltage or current (Figure 4). Subsequent to this, the devices operate as tunable resistance switches, as shown in Figure 5a–b.Reference Yang, Miao, Pickett, Ohlberg, Stewart, Lau and Williams56 These devices can be set and reset by a negative and a positive voltage to the TE, respectively. As schematically shown in Figure 4a, the electroforming process for the bipolar devices may be polarity dependent, which in turn depends on the built-in asymmetry of the devices and is different from unipolar devices. The devices shown in Figure 5 have a stack structure of Si/SiO2/Ti/Pt/TiO2/Pt, where the Ti adhesion layer thermally diffuses during the deposition of the TiO2 layer. The diffused Ti atoms form nanoscale channels along Pt grain boundaries to penetrate the Pt layer and locally reduce the TiO2 material at the Pt/TiO2 interface.Reference Yang, Strachan, Xia, Ohlberg, Kuekes, Kelley, Stickle, Stewart, Medeiros-Ribeiro and Williams55 These localized VO rich regions serve as the nanoscale switching center seeds. Under electric fields, there is a field concentrating effect, and conduction channels originate from these small seeds. Engineering the nanoscale diffusion and “seeding” improved the switchable device yield from below 30% to almost 100%.Reference Yang, Strachan, Xia, Ohlberg, Kuekes, Kelley, Stickle, Stewart, Medeiros-Ribeiro and Williams55
Schematic of the forming step and subsequent bipolar reversible switching. The inset shows the device structure and the corresponding band diagram. Note: TE, top electrode; BE, bottom electrode.

Fifty consecutive bipolar switching loops for a (a) 50 × 50 nm2 nanodevice and a (b) 5 × 5 μm2 micro-device. The device stack is Si/SiO2/Ti/Pt/TiO2/Pt. The I-V curves for the ON state are conductive (green curves) and symmetric, while those for the OFF state are rectifying (purple curves), suggesting the role of the metal/oxide interface in switching. The insets are the atomic force microscopy images of the cross-point devices.

Thermal diffusion of the Ti adhesion layer also yields an asymmetric device by generating many VOs, which results in an Ohmic contact at the bottom interface, while the top interface remains Schottky-like due to the lack of VO dopants. This asymmetry determines the electroforming polarity; a positive voltage to the TE electroforms the device to the HRS, while a negative voltage electroforms the device to the LRS, as schematically shown in Figure 4a. This, in fact, also dictates the switching polarity.
Physical damage can be induced to the devices during the electroforming process due to gas release.Reference Yang, Miao, Pickett, Ohlberg, Stewart, Lau and Williams56 Technologically, it is essential to eliminate the electroforming process from the devices for memory applications. An approach to engineer a device that obviates electroforming is to decrease the thickness of the stoichiometric oxide film, eliminating the “bulk” region and keeping the “switching interface.”Reference Yang, Miao, Pickett, Ohlberg, Stewart, Lau and Williams56
Switching mechanism and a family of devices
Typical switching I-V loops are shown in Figure 5a–b, where the device was switched ON by a negative bias and OFF by a positive bias (bipolar switching). This switching polarity was determined by the device fabrication procedure and was independent of the electrical history of the device. The I-V trace in the LRS is usually conductive and symmetric (linear or nonlinear), while that in the HRS is rectifying. These I-V curves contain valuable information in deciphering the nature of LRS and HRS.Reference Yang, Pickett, Li, Ohlberg, Stewart and Williams24 For instance, the rectification suggests that the HRS may be limited by Schottky-like transport at one of the metal/oxide interfaces. Initially, the bottom interface is VO rich (due to the diffusion of the Ti adhesion layer), and the top interface is VO deficient. A negative voltage applied to the TE attracts positively charged VOs in the oxide toward the electrode. The VO dopants drift in the electric field through the most favorable diffusion paths and condense to form channels of sub-oxides (e.g., Magnéli phase) with high electrical conductivity. Once one or more conductance channels penetrate the electronic barrier at the metal/oxide interface, the device is switched ON, producing a symmetric exponential I-V curve that is the result of tunneling through a thin residual barrier. In order to switch the device OFF, a voltage with the reverse polarity is applied. A positive bias on the TE repels the VOs in the conducting channel away from the TE, and the original electronic barrier is recovered. Switching OFF is thus not the result of the rupture of a conducting channel by Joule heating (although the process is heat-assisted), as the model of unipolar switching discussed previously, mainly because the switching is voltage polarity dependent. It is crucial to note that the set and reset switching events in Figure 5 occur at one interface only—the rectifying non-Ohmic (top) interface.
One may question why unipolar reset is achieved in one case, while bipolar reset is observed in another case, given the fact that the localized conducting channels are basically the same in TiO2. This is not clearly understood yet, but the following speculation can be made.Reference Kim, Choi, Lee, Kim, Song, Seok, Yoon, Han and Hwang16 As discussed, bipolar reset is generally caused by the electric field–driven migration of ionic species. If the channel is too electrically conductive, as in the unipolar case mentioned previously, the effect of the electric field may not be strong enough to drive the directional ionic motion. In fact, Kim et al. showed that the reset state of unipolar switching could be the set state of subsequent bipolar switching operation due to the remaining traces of (rather dispersed) defects in the CF-ruptured region.Reference Kim, Choi, Lee, Kim, Song, Seok, Yoon, Han and Hwang16 As long as the ruptured CF is not regained by another set in unipolar mode, the repeated set/reset in bipolar mode was possible.Reference Kim, Choi, Lee, Kim, Song, Seok, Yoon, Han and Hwang16
Based on the previously mentioned understanding of the switching mechanism, a family of nanodevices can be realized with a simple metal/oxide/metal structure. The two metal/semiconducting oxide contacts can be either rectifying or conductive, depending on the concentration of dopants at the respective interface,Reference Yang, Borghetti, Murphy, Stewart and Williams57 which provide four different I-V characteristics. By forcing charged dopants into or out of the interface region with an applied electric field pulse, devices can be switched from one type of stable operation to another in five different ways, leading to a family of devices with a rich set of switching behavior.
Device integration
The material classes discussed in this article are, in most cases, stable with respect to temperature and semiconductor processing atmospheres. This makes them inherently compatible with a stacked cross-point (or crossbar) memory. Unipolar switching of the thermochemical mechanism would also be suited for a unidirectional diode-based cross-point array. The low write/erase cycle count in the case of the thermochemical mechanism and the asymmetric set/reset operation puts significant doubt on the usefulness of this mechanism for NVRAM. The hourglass-type conductive filament points in the right directionReference Kim, Kim, Song, Seok, Lee, Yoon and Hwang28, Reference Na-Phattalung, Smith, Kim, Du, Wei, Zhang and Limpijumnong58 but does not completely solve either issue yet.
The set/reset asymmetry in the unipolar mechanism also gives rise to a significant reset current that is incompatible with HDDS, since it would limit the write (erase) throughput. Bipolar valence change memory, in contrast, does not show the high reset current and comes with significantly higher endurance potential. Since it has the drawback of a more challenging integration into a cross-point arrangement together with a diode selector, it is more favorable for NVRAM or embedded memory direction. It is possible to construct a bipolar RS device with inherent rectifying properties. However, for constructing large arrays, the requirements for the forward/reverse current ratio of the diode are quite severe. Additionally, the forward region of diodes is normally at relatively high voltages, giving rise to read disturbance issues.
In assessing the status and potential of RS in memories, conventional charge storage memories have to be considered. For the NVRAM case, dynamic RAM (DRAM) is the appropriate benchmark. DRAM minimum feature sizes are currently in the 25–30 nm range with a cell size of 6F2 (F, minimum feature size) storing one bit per cell. Due to the 3D structure of the DRAM capacitor, the film thickness of the capacitor dielectric will limit scalability at around 20 nm. This is indeed a chance for new technologies to step in. For the NVRAM path, fast and symmetric read-write access and cycling endurance are the top priorities. Currently, bipolar switching looks more favorable. Fortunately, some oxide materials consisting of only one conductive and one insulating solid phase at low temperature have exhibited great potential for over a trillion switching cycles.Reference Yang, Zhang, Strachan, Miao, Pickett, Kelley, Medeiros-Ribeiro and Williams54, Reference Lee, Lee, Lee, Lee, Chang, Hur, Kim, Kim, Seo, Seo, Chung, Yoo and Kim59
For the HDDS case, memories based on 25 nm dimensions are available,Reference Goldman, Pangal, Naso and Goda60 and memories using 19 nm dimensions will hit the market in late 2011. These memories already store up to 3 bits per cell. Low cycling endurance can be tolerated but not the high reset current used in the thermochemical cell. Integration into a 3D architecture together with the reset current used in the thermochemical approach is the primary priority. In the current status, both thermochemical non-polar as well as bipolar switches have different shortcomings for HDDS applications, and there is no clear favorite of the two.
Using resistive switching for digital and analog circuit design rather than just for semiconductor memories is still a very young research field. For these applications, the proper choice of hysteresis behavior, as described previously, is of primary importance. Additionally, researchers should also think about new device architectures. Finally, for all types of real world devices, the reproducibility of the cell properties is still a significant challenge. Most literature studies show a rather high fluctuation in switching parameters, although up until now, only single cells or small arrays have been reported. Significant improvement in reproducibility is still necessary in order to fabricate high density memory devices.
Summary
There are a number of significant challenges ahead. Nevertheless, unipolar thermochemical and bipolar valence change memories still have a huge potential for future memories, as well as digital and analog circuits that remain to be explored.
Acknowledgments
We would like to thank Dr. Hisashi Shima, Prof. Marcelo J. Rozenberg, Dr. Duncan R. Stewart, Dr. G. Medeiros-Ribeiro, and Dr. R. Stanley Williams for fruitful discussions. Dr. Min Hwan Lee is greatly acknowledged for his help in editing and refining the technical context of this article. C.S.H. acknowledges support from the National Research Program for the Nano Semiconductor Apparatus Development sponsored by the Korean Ministry of Knowledge and Economy, and the Convergent Research Center program (Grant No. 2011K000610) through the National Research Foundation of Korea.