


A well-known generalization in political science is that voters reward incumbents during good economic times and punish them in bad times. This relationship is so widely accepted not just in the United States but also in other democracies around the world (Lewis-Beck and Stegmaier Reference Lewis-Beck and Stegmaier2000) that it has gained “canonical status” (Lewis-Beck and Nadeau Reference Lewis-Beck and Nadeau2011). A lesser known, but equally important, generalization is that partisan business cycles are a regular feature of democratic political economies. In the United States and other industrialized democracies, unemployment typically declines when Democrats or left-leaning parties are in power and typically rises when Republicans and right-leaning parties are in control (e.g., Alesina and Roubini Reference Alesina and Roubini1992; Faust and Irons Reference Faust and Irons1999; Hibbs Reference Hibbs1977).
The logical connection between these empirical claims is elusive. The reward-punishment hypothesis implies that unemployment is a valence issue (e.g., Stokes Reference Stokes1963), whereas the economic cycles observed by Hibbs and others imply that unemployment is a partisan issue. As a valence issue, voters would reward or punish incumbents for high or low employment regardless of party labels, but as a partisan issue, voters would prefer one party's policies over the other regardless of which party is in office. Consistent with the latter claim, Kiewiet (Reference Kiewiet1981; Reference Kiewiet1983) discovered that individuals who had been affected personally by unemployment or who considered unemployment to be an important problem reported voting Democratic at significantly higher rates than others. This finding suggests that the effects of unemployment may be felt differently by incumbents from each party and that a reward-punishment perspective may not be the best way to understand the role of unemployment in American elections.
The pattern of unemployment falling under left-leaning governments and rising among right-leaning governments suggests that voters should favor left parties when unemployment is a problem (e.g., Carlsen Reference Carlsen2000; Powell and Whitten Reference Powell and Whitten1993; Veiga and Chappell Reference Veiga and Chappell2002). This possibility has not yet been investigated for U.S. elections,Footnote 1 for which political scientists assume that unemployment is a valence issue in which both political parties are equally concerned about unemployment and equally committed to reducing it. However, if political parties are not equally concerned and instead have distinct reputations for dealing with unemployment, then voters may prefer Democrats over Republicans when unemployment is high or rising, other things being equal. The central question of this article is whether Democratic candidates realize an electoral advantage from high unemployment.
Generally, unemployment does not play a prominent role in the analysis of U.S. elections for the simple reason that it is not one of the most consistent and powerful predictors of election outcomes (e.g., Arcelus and Meltzer Reference Arcelus and Meltzer1975; Fair Reference Fair1978; Reference Fair2009; Kramer Reference Kramer1971). Given the emphasis on parsimony and accurate prediction in aggregate studies of economics and elections, scholars have forsaken unemployment for other economic variables such as GNP and per capita real income. None of the 14 models of U.S. presidential elections reviewed by Lewis-Beck and Stegmaier (Reference Lewis-Beck and Stegmaier2000), for example, included unemployment as a predictor.Footnote 2 However, with unemployment pushed to the sidelines in the contest to predict election outcomes, potentially meaningful relationships in the aggregate data have gone unexplored.
One potentially important relationship between unemployment and elections is suggested by evidence of the partisan nature of unemployment in the survey data (Kiewiet Reference Kiewiet1981). If individual voters prefer Democrats when unemployment is a problem, then high or rising unemployment may have consistently positive effects on Democratic vote shares in the aggregate. In fact, this is precisely what Rees et al. (Reference Rees, Kaufman, Eldersveld and Freidel1962) discovered in their analysis of unemployment and congressional elections from 1946 to 1958. This finding seems reasonable given evidence of the partisan nature of unemployment at the individual level and the existence of partisan business cycles at the aggregate level. Yet scholars have been skeptical. Fiorina (Reference Fiorina1981) dismissed the suggestion by Rees et al. that unemployment always benefits Democrats as “curious” and claimed to “strongly doubt the generality of this suggestion” (29).
The purpose of this article is to examine how high or rising unemployment affects U.S. elections, and, in particular, to determine whether unemployment affects incumbents from both parties equally or whether there is a Democratic advantage. The analysis employs county-level data on unemployment and election returns for 175 midterm gubernatorial elections and 4 presidential elections from 1994 to 2010. Its major empirical finding is that unemployment and the Democratic vote move together. Higher rates of unemployment at the county level lead to larger vote shares for Democratic candidates, and lower unemployment leads to lower vote shares. This relationship holds regardless of the incumbent party. Consequently, when Democrats are in power and unemployment increases, they are not punished, and when Democrats are in power and unemployment decreases, they are not rewarded (e.g., Bloom and Price Reference Bloom and Price1975).
The remainder of the article is organized into four sections. The next examines the partisan cycle of unemployment from 1948 to 2010 through the lens of the reward-punishment perspective on presidential elections. The analysis then turns to individual survey data to determine if Kiewiet's (Reference Kiewiet1981) finding in surveys of voters and unemployment holds for more recent elections. Then, after a brief review of the research on elections and unemployment at the aggregate level, I present specific hypotheses. The findings and conclusions follow.
PARTISAN CYCLE OF UNEMPLOYMENT
An association between unemployment rates and partisan control of the presidency has been often noted, beginning with Hibbs (Reference Hibbs1977). Unemployment generally rises when Republicans control the White House and falls when Democrats are in control. Similar patterns have been found in other industrialized democracies, where unemployment rises with right-leaning governments and falls with left-leaning governments (Alesina, Cohen, and Roubini Reference Alesina, Cohen and Roubini1992; Carlsen Reference Carlsen1998; Carlsen and Pederson Reference Carlsen and Pedersen1999; Erlandsson Reference Erlandsson2004; Hibbs Reference Hibbs1986; Reference Hibbs1992; Kiefer Reference Kiefer2000). The causal underpinnings of this pattern are much less clear than the pattern itself, however.
Following Hibbs (Reference Hibbs1977), a partisan theory of the cycle of unemployment is that political parties formulate and implement policies that appeal to their core constituencies. Supporters of left-leaning parties typically rely more on labor income and therefore are more concerned about unemployment than supporters of right-leaning parties. However, Chappell and Keech (1986), Alesina (Reference Alesina1987), and Alesina and Sachs (Reference Alesina and Sachs1988) have theorized that if parties’ policy positions are known with certainty, then under rational expectations, elections should have no effect on the economy because wage contracts will be adjusted prior to the election to take account of any anticipated partisan change. Consequently, any economic change resulting from elections must be due to uncertainty or surprise about the election outcome. The extent to which governing parties actually control the economy is therefore debatable (e.g., Beck Reference Beck1982; Faust and Irons Reference Faust and Irons1999; Haynes and Stone Reference Haynes and Stone1994).
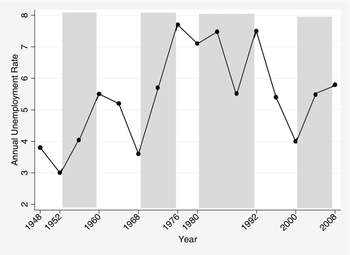
Despite scholarly disagreement about why partisan cycles exist, the regularity of a partisan cycle of unemployment is widely recognized in both economics and comparative politics (Carlsen and Pederson Reference Carlsen and Pedersen1999; Faust and Irons Reference Faust and Irons1999; Hibbs Reference Hibbs1977). In contrast, the partisan cycles and their implications for voter behavior have not been fully explored for U.S. elections.Footnote 3 The partisan nature of the unemployment cycle in U.S. presidential elections is quite clear, however, as indicated in Figure 1. Plotted in Figure 1 is the average election-year unemployment rate from 1948 through 2008.Footnote 4 For the past 60 years, unemployment has fallen during Democratic administrations and risen during Republican administrations, with the only exception being 1984–88. In general, after Democrats replace Republicans in the White House, the employment picture is always brighter than it was four years earlier.
Unemployment Rates by Republican and Democratic Presidential Administrations, 1948–2008

Despite the clear partisan pattern to unemployment in Figure 1, there is some evidence in the aggregate pattern that voters sometimes employ a reward-punishment strategy at the polls. Republican defeats in 1960, 1976, 1992, and 2008 occurred after four or more years of Republican presidential control and during periods of high or rising unemployment. These four presidential elections are therefore consistent with the idea that voters punish the incumbent party for high unemployment. In addition, incumbent presidents were reelected in 1964, 1988, and 1996 after unemployment had declined during the previous four years. These three presidential elections are therefore consistent with the idea that incumbent presidential parties are rewarded for good economic performance.
The remaining eight elections, however, are inconsistent with a pure reward-punishment scenario. Republican victories in 1956, 1972, 1984, and 2004 occurred after four years of Republican control and after four years of rising unemployment. Yet, because Republicans were punished four years later, one might argue that Republicans were punished only after eight or more years of rising unemployment, not after just four (e.g., Nadeau and Lewis-Beck Reference Nadeau and Lewis-Beck2001). Perhaps voters have a wait-and-see attitude after the first term, but have seen enough after two terms of rising unemployment to pull the plug on the incumbent party. At any rate, the elections in 1956, 1972, 1984, and 2004 are at best only partially consistent with a reward-punishment perspective.
More problematic for a pure reward-punishment hypothesis is that Democrats are often not rewarded for bringing unemployment down. Democratic defeats in 1952, 1968, 1980, and 2000 all occurred after noticeable drops in the unemployment rate during the previous four years of Democratic presidential control.Footnote 5 Incumbent Democrats were rewarded for declining unemployment only twice—1964 and 1996—in the six elections when they should have been rewarded.
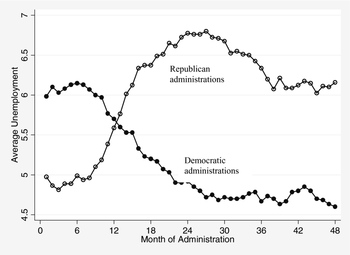
One possible explanation for why Democrats are seldom rewarded is that unemployment may rise just before elections when Democrats are in control, and voters are myopic, evaluating not the entire four-year term, but only the last few months of the term. To investigate this possibility, Figure 2 plots average monthly unemployment rates during the first, second, third, and last years of Democratic and Republican presidential administrations from 1948 through 2008.Footnote 6 On average, unemployment increases throughout the first two years of Republican administrations, declines during the third, and stabilizes in the fourth. During Democratic administrations, unemployment declines during the first two-and-one-half years, stabilizes, increases slightly, and then decreases over the four months preceding the election. This pattern is not indicative of reward-and-punish behavior by voters judging unemployment only during the last few months before the election. Even though there is a slight rise in unemployment in the middle of the last year of Democratic administrations, unemployment actually declines in the months leading up to the election, and unemployment stays relatively flat during the last few months of Republican administrations. Even if voters are myopic and care only about the last several months of the presidential term, a reward-punishment perspective on unemployment does not fit the aggregate pattern.
Average Unemployment during First, Second, Third, and Last Years of Presidential Administrations, 1948–2008

In summary, Republicans were the incumbent presidential party in 9 of the 15 elections from 1952 to 2008. Republicans were punished in four of these elections, but also not punished in four elections when perhaps they should have been, unless the incubation period for voter retribution is eight instead of four years. They were rewarded in the only election when they deserved it. Democrats were never punished, but unemployment never rose during their incumbencies. Democrats were rewarded in only two of the six elections following declines in the unemployment rate.
The overall aggregate pattern, although partly consistent with a reward-punishment story, suggests a somewhat different tendency. Republicans are punished for high or rising unemployment—certainly after eight years and sometimes after four—and Democrats are generally not rewarded for low or falling unemployment. Or, to put it slightly differently, after periods of high or rising unemployment, voters turn to Democrats, and after periods of low or falling unemployment, they turn back to Republicans.
DEMOCRATIC OWNERSHIP OF UNEMPLOYMENT
In a recent article, Lewis-Beck and Nadeau (Reference Lewis-Beck and Nadeau2011) reported that the issue of taxation—how much rich people should be taxed as compared to poor people—is clearly positional, or partisan, and not a valence issue. Survey respondents who thought the rich should bear a larger share of the tax burden strongly preferred Obama to McCain in 2008. Therefore Lewis-Beck and Nadeau advise against treating all economic variables as exclusively valence issues: “The fact that the voters all seek economic prosperity has blinded analysts to the notion that they do not all seek the same economic policies” (17). Their advice is well taken and, in light of previous research (e.g., Kiewiet Reference Kiewiet1981), seems especially appropriate for analyzing unemployment.
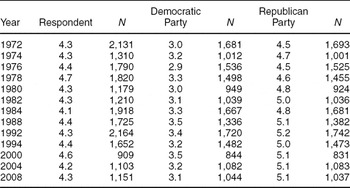
Since 1972, the American National Election Studies (ANES) project has regularly recorded individuals’ attitudes about the extent to which they believe the federal government should guarantee everyone a job and a good standard of living. It has also asked individuals for their perceptions of the Democratic and Republican Party positions on this issue. Table 1 presents the mean responses on a scale from 1 to 7, where 1 is support for a government guarantee and 7 is opposition to government involvement. The mean response for individuals’ own attitudes is always in the 4–5 range, although sometimes closer to 4 and sometimes closer to 5. With respect to the parties’ positions, voters consistently perceive statistically significant differences between the two major political parties, with the Democrats always the party most likely to provide assurances of a job and a good standard of living.Footnote 7 The perceived difference between the parties is greatest in 2008 and smallest in 1972, 1974, and 1982. But even when the difference is smallest, the Republicans are perceived to be 1.5 points less concerned with guaranteeing jobs and a good standard of living than the Democrats.
Self and Party Placements on 7-point Jobs and Good Standard of Living Scale

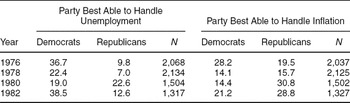
A more direct indicator of which party owns the unemployment issue is provided in the occasional questions the ANES has asked about which party is best able to handle the problem of unemployment. This question was asked in 1976, 1978, 1980, and 1982. The ANES also asked a parallel question about inflation in those years. The percentages of respondents identifying the Democrats or Republicans as the party best able to handle unemployment or inflation are displayed in Table 2. Except for 1980, among individuals who see a difference between the two parties, far more have identified the Democratic Party as the party best able to handle unemployment. Individuals’ perceptions in 1980 were surely shaded by overall negative evaluations of Carter's handling of the economy, but after the recession in 1982, Democrats were again squarely perceived as the party best able to handle unemployment.
Percent Identifying Democratic and Republican Parties as Best Able to Handle Unemployment and Inflation

Do voters perceive a tradeoff between unemployment and inflation as suggested by the classic Phillips curve? If so, then it is possible that voters switch their support from Republicans to Democrats as unemployment rises and inflation falls, and then from Democrats to Republicans as unemployment falls and inflation rises. The ANES asked a question directly about an unemployment-inflation tradeoff in 1980.Footnote 8 Despite the obvious priming of the question, 45.7% of respondents (N = 1,614) said they did not think there was a connection between unemployment and inflation, and another 8.3% were unsure. Economists, however, have questioned the validity of a long-term Phillips curve (e.g., Friedman Reference Friedman1968; Phelps Reference Phelps1968), especially in light of the stagflation of the 1970s, and so it is unclear whether responses to the question reflected contemporary economic thinking at the time or an unsophisticated electorate. Unfortunately, the question has not been asked since. At any rate, it seems unlikely that a majority of voters are rationally switching their support from one party to the other in response to an inverse connection between unemployment and inflation.
Generally, the survey evidence indicates that unemployment was a partisan issue in the minds of voters by 1980 and that it has remained a partisan issue through the 2008 presidential election. Consistent with Kiewiet's (Reference Kiewiet1981) discovery 30 years ago, voters perceive clear differences between the abilities of the two parties to handle the problem of unemployment. Exactly when and how the Democrats established their reputation as the party best able to handle the problem of unemployment is not clear from the survey data, but it most likely evolved from Franklin D. Roosevelt's commitment to reduce unemployment during the New Deal.Footnote 9
UNEMPLOYMENT AND ELECTIONS
Given the reputational advantage that Democrats enjoy among voters for being the party best able to handle unemployment, unemployment fits quite naturally within an issue-ownership framework for understanding elections (Petrocik Reference Petrocik1996). The general theory of issue ownership holds that elections are best understood in terms of the problems that voters want politicians to fix. Candidates’ campaigns are then to be viewed as “marketing” efforts designed to define the issues of the campaign in terms of problems that their parties have a distinct advantage in handling (Petrocik Reference Petrocik1996, 828). An issue-ownership perspective predicts that, when unemployment becomes a problem, Democratic candidates will emphasize the issue and market their party's long-term reputation for handling it, and voters will respond by turning prospectively to Democrats instead of Republicans.Footnote 10 Perhaps no problem is more central to voters than whether they, their family, neighbors, and friends have jobs.
What happens, however, when unemployment recedes during a Democratic administration and fades as a problem? When unemployment fades as a problem, then so does the marketing advantage Democrats realized from their reputation as the party best able to handle the problem. Unless new problems emerge that Democrats can claim as their own and market successfully, then voter demand for the services of Democratic politicians should decrease when unemployment recedes. The fading of unemployment may therefore create opportunities for Republicans to market issues of their own. Although it cannot be said that Republicans will necessarily be victorious when unemployment declines, such a result should not be surprising. Even if Republicans fail to establish a new issue of their own, the fading of unemployment may itself be enough to turn the electoral tables. Consider the 1992 and 2000 presidential elections, for example. After unemployment declined from 7.4 in 1992 to 3.9 in 2000, the Democrats found themselves without a compelling issue, and although Republicans had no single burning issue of their own in 2000, they were able to compete on even terms with the Democrats at the presidential level for the first time in eight years (Fiorina, Abrams, and Pope Reference Fiorina, Abrams and Pope2003; Miller and Klobucar Reference Miller and Klobucar2003).
If Democratic electoral fortunes rise and fall with rising and falling unemployment, then one might ask why Democrats would ever allow unemployment to fall once they were elected. The easy answer to this question is that Democrats do not deliberately bring unemployment down, but that it comes down instead because of cyclical changes in credit and debt or because of exogenous shocks in the economy. Under this view, parties and candidates simply ride the political waves of rising and falling unemployment, in which case the parties in power simply reflect and summarize economic conditions rather than create them. However, the answer is harder if one assumes that incumbent politicians have some degree of control over the level of unemployment and economic performance generally. Then there are at least two possible answers to the question, one cynical and one noncynical.
The cynical answer is that Democratic politicians deliberately attempt to keep long-term structural unemployment high through the provision of unemployment benefits. Because unemployment compensation increases reservation wages and reduces incentives to find jobs, unemployment benefits increase the duration of unemployment (e.g., Card and Levine Reference Card and Levine2000; Chetty Reference Chetty2008). The provision of unemployment benefits therefore serves a dual purpose for Democrats—it services key Democratic constituents and also keeps unemployment high on the list of voters’ concerns. Although unemployment may eventually decline through natural cycling of the economy, it does not decline as quickly as it would without Democratic intervention in the form of unemployment benefits.
The noncynical answer is that Democrats work to bring unemployment under control so that they do not lose ownership of the issue. Losing ownership of any issue is costly when elections hinge on the ownership of issues and candidates’ abilities to market them successfully. Reputations take time to develop, and thus parties cannot easily replace ownership of one issue with another. Even if better issues might come along in the future, risk-averse politicians will prefer to keep the issue they know works, rather than gamble on finding a better one. Just how long it would take for the party's reputation to be tarnished is unclear, but the patience of voters is surely not infinite. Ironically, because voters’ expectations for solving unemployment are higher for Democrats, their disillusionment may also be higher when the problem persists or worsens under Democratic leadership. Some evidence of this phenomenon was uncovered by Powell and Whitten (Reference Powell and Whitten1993) in their cross-national analysis. They found that voters hold left-leaning parties to a higher standard on unemployment problems and right-leaning parties to a higher standard on inflation. Empirically, this dynamic may be difficult to observe in the United States because unemployment regularly declines under Democratic administrations, and as a result, Democrats do not pay a price for nonperformance. Nevertheless, unemployment may improve under Democrats because they anticipate a loss of ownership if it does not improve.
In sum, the theoretical lens of issue ownership, combined with evidence that unemployment is a partisan rather than a valence issue, suggests that rising unemployment should benefit Democrats, regardless of incumbency, as voters turn to candidates of the party they believe can best solve the problem. Then, as unemployment declines, so will the Democratic advantage. Instead of being rewarded for fixing unemployment, Democratic incumbents will find themselves without a compelling problem and issue to market to voters. High or rising unemployment essentially creates a Democratic electoral bubble that deflates when unemployment ceases to be a problem.
The relationship between unemployment and elections is therefore quite different from that suggested by the reward-and-punish perspective. This difference may partly account for why empirical relationships between unemployment and election outcomes are sometimes difficult to observe. Empirical relationships could also be difficult to observe because voters do not interpret or react to unemployment in a straightforward way or because other issues mask the importance of unemployment. Conover, Feldman, and Knight (Reference Conover, Feldman and Knight1986) make a strong case for why unemployment should be important in elections, at least relative to inflation. They argue that unemployment is a more concrete and easily understood issue than inflation and that people can learn about unemployment through interpersonal sources and local news. In surveys, they found that individuals’ estimates of unemployment were substantially more accurate than their estimates of inflation, that voters seemed to respond quickly to changes in unemployment, and that even those who had little or no knowledge of actual unemployment rates were still aware of trends in unemployment. Blount (Reference Blount2002), however, raises questions about exactly how voters interpret and understand unemployment rates. He reported that among Australian survey respondents, the importance that voters attach to unemployment is more highly correlated with social issues such as health and education than with economic issues such as taxation and interest rates.
Grafstein (Reference Grafstein2005) argues that the voting calculations based on employment considerations are actually quite complicated. They depend not only on factors such as education, income, and unemployment benefits but also on aggregate unemployment rates, which inform voters’ beliefs about the probabilities of getting a job or being terminated from one. Consequently, even the unemployed may not vote for the party with the best record of job creation.
Perhaps unsurprisingly, aggregate findings about the impact of unemployment on elections are mixed. In Kramer's (Reference Kramer1971) analysis of unemployment and congressional vote shares from 1896 to 1964, the unemployment coefficient had the wrong sign and was statistically insignificant. Arcelus and Meltzer (Reference Arcelus and Meltzer1975) also found that the unemployment rate had a small and insignificant effect on congressional election outcomes. Kiewiet and Udell (Reference Kiewiet and Udell1998), however, found much larger and statistically significant effects for unemployment when replicating Kramer's analysis with revised estimates of unemployment from 1890 to 1940. For the 1976 presidential election, Cebula (Reference Cebula1984) reported that the higher the rate of unemployment in a state, the higher the proportion of votes for Jimmy Carter in that state. Fair (Reference Fair1978) reported significant statistical effects of unemployment for predicting presidential elections from 1916 to 1976, but that a more powerful predictor was GNP growth. In subsequent analyses, Fair (Reference Fair2009) dropped unemployment in favor of GDP.
The evidence on unemployment is also mixed among the few articles that have analyzed county-level unemployment and presidential vote shares. Eisenberg and Ketchum (Reference Eisenberg and Ketcham2004) analyzed presidential vote shares in 1992, 1996, and 2000 as a function of changes in unemployment in counties over one, two, and three years prior to the election. They assumed symmetric effects of unemployment for Democrats and Republicans and found generally small and insignificant effects of unemployment rates on presidential vote shares. Kim, Elliot, and Wang (Reference Kim, Elliot and Wang2003) analyzed unemployment and presidential voting using a geographic methodology that weighted counties by their spatial proximity. They found evidence that voters in high unemployment counties were more likely to support Democratic candidates in presidential elections from 1992 to 2000, but that changes in unemployment during the election year were unrelated to presidential vote shares. Cho and Gimpel (Reference Cho and Gimpel2009) analyzed Democratic vote shares in the 2008 presidential election as a function of county-level unemployment, controlling for local gas prices and foreclosure rates. Their analysis revealed that the greater the increase in unemployment in a county between July and October of 2008, the lower the share of the Democratic presidential vote. The correlation between unemployment change and foreclosure rates was relatively small (ρ = .24).
A disconnect between aggregate and individual-level analyses is nothing new in the study of economics and voting (e.g., Fiorina Reference Fiorina1978). Typically, aggregate findings demonstrate greater clarity and consistency than individual-level findings. In the case of unemployment, however, the aggregate findings are inconsistent, whereas the individual-level findings demonstrate clear and consistent patterns in how individuals think about unemployment and political parties. One possible cause of the inconsistent aggregate findings about unemployment and elections may be different underlying assumptions about whether unemployment is a valence or partisan issue. Unemployment is often treated as a valence issue in aggregate analyses, even though considerable survey evidence suggests clear Democratic ownership of the issue.
HYPOTHESES
Several things can go awry in the aggregate analysis of unemployment and elections if hypotheses are not clearly specified and if the dependent variable is not appropriate to the hypothesis being tested. Some research designs are better suited for testing a reward-punishment hypothesis, and others are better for testing a partisan hypothesis. In general, if unemployment is a valence issue and voters exhibit reward-punishment behavior during elections, then high or rising unemployment should decrease the incumbent party's vote share, regardless of whether the incumbent party is Republican or Democrat. Alternatively, if unemployment is a partisan issue and voters exhibit partisan behavior during elections, then high or rising unemployment should increase the vote shares of Democratic candidates at the expense of Republicans.
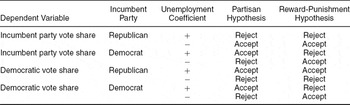
Table 3 indicates the expected relationships for various combinations of hypotheses and dependent variables. The sign for the unemployment coefficient indicates the direction of change in the dependent variable given an increase in unemployment. For example, if the dependent variable is the incumbent party's vote share and the incumbent party is Republican, then a positive coefficient would indicate rejection of both hypotheses, and a negative coefficient would indicate acceptance of both. Thus, the analysis of unemployment and the incumbent party's vote share cannot distinguish between the partisan and reward-punishment hypotheses when there is a Republican incumbent. Similarly, a positive relationship between unemployment and incumbent vote share given a Republican incumbent would be evidence against both a partisan and reward-punishment interpretation. Consequently, analysis of the incumbent party's vote share is informative for distinguishing between the two hypotheses only if there is a Democratic incumbent.
Predicted Relationships between Unemployment and Votes under Partisan and Reward-Punishment Hypotheses

If the dependent variable is the Democratic vote share, an analysis of unemployment and Democratic vote share can distinguish between the two hypotheses only when there is a Democratic incumbent. When there is a Republican incumbent, a positive unemployment coefficient for Democratic vote share would be expected under both the partisan and reward-punishment hypotheses. Similarly, a negative relationship between unemployment and Democratic vote share given a Republican incumbent would constitute evidence against both the partisan and reward-punishment hypotheses.
If the analysis includes multiple elections, then it is important to analyze the Democratic (or Republican, but with signs reversed) Party vote share instead of the incumbent party vote share to obtain clean tests for the partisan and reward-punishment hypotheses. When the partisan hypothesis is true, then the incumbent's vote share will be increasing with unemployment for a Democratic incumbent and decreasing with unemployment for a Republican incumbent, and the two effects may cancel each other. The information in Table 3 can be summarized in the following hypotheses.
Partisan Hypothesis: High or rising unemployment will increase the Democratic vote share, regardless of the incumbent party. Lower or falling levels of unemployment will decrease the Democratic vote share, regardless of the incumbent party.
Reward-Punishment Hypothesis: High or rising unemployment will increase the Democratic vote share when Republicans are the incumbent party and decrease the Democratic vote share when Democrats are the incumbent party. Low or falling unemployment will increase the Democratic vote share when Democrats are the incumbent party and decrease the Democratic vote share when Republicans are the incumbent party.
Support for the partisan hypothesis requires simply that unemployment and the Democratic vote share move in the same direction when the dependent variable is the Democratic share of the vote. That is, when unemployment is high or rising, the Democratic vote share should be high or rising, and when unemployment is low or falling, the Democratic vote share should also be low or falling. But to test the reward-punishment hypothesis, the party of the incumbent must be taken into account.
I tested these hypotheses with two sets of data, one for presidential elections and one for gubernatorial elections. For the analysis of gubernatorial elections, the reward-punishment hypothesis could apply either to the incumbent gubernatorial party or to the incumbent presidential party. In general, the research on gubernatorial elections does not provide clear guidance about whether the reward-punishment hypothesis applies to the party of the incumbent governor or to the party of the incumbent president.
Much of the research on gubernatorial elections concludes that national conditions and evaluations of presidential performance have a greater impact than state economies and state executives on state elections (e.g., Chubb Reference Chubb1988; Crew and Weiher Reference Crew and Weiher1996; Holbrook-Provow Reference Holbrook-Provow1987; Pelzman Reference Pelzman1987; Simon Reference Simon1989; Stein Reference Stein1990).Footnote 11 There are exceptions, however. In the gubernatorial elections of 1982 and 1986, Svoboda (Reference Svoboda1995) uncovered evidence in individual survey data that voters’ evaluations of the state economy were a significant predictor of gubernatorial vote choice, and Partin (Reference Partin1995) reported a similar finding for the 1990 gubernatorial elections. Howell and Vanderleeuw (Reference Howell and Vanderleeuw1990) and Hansen (Reference Hansen1999) discovered that evaluations of the state economy and state unemployment rates influenced governors’ approval ratings, and Niemi, Stanley, and Vogel (Reference Niemi, Stanley and Vogel1995) found that gubernatorial vote decisions were affected by tax increases and voters’ negative evaluations of the state economy. Atkeson and Partin (Reference Partin1995) argued that gubernatorial elections exhibit “functional responsibility,” in which voters hold governors responsible for state but not national economic conditions. They found little evidence that presidential approval affects gubernatorial voting; however, after reanalyzing the data, Carsey and Wright (Reference Carsey and Wright1998) found that presidential approval does affect gubernatorial voting decisions.
With respect to unemployment in particular, Kenney (Reference Kenney1983) found that state-level unemployment did not adversely affect the incumbent party of the governor in analysis of gubernatorial elections in 14 states from 1946 to 1980, but he also found little evidence for a partisan effect of unemployment on Democratic vote shares. Leyden and Borrelli (Reference Leyden and Borrelli1995) observed that higher levels of state unemployment negatively affected the vote share of the incumbent gubernatorial party, but only in states with unified government. Finally, from their analysis of gubernatorial elections in 47 states from 1950 to 1998, Ebeid and Rodden (Reference Ebeid and Rodden2006) reported that change in unemployment rates during the year of the election had a statistically significant effect on the incumbent party's share of the vote, but only in states that had a more industrialized and diversified economy. Most recently, Brown's (Reference Brown2010) analysis of gubernatorial popularity and state-level unemployment uncovered evidence in 2006 that Republican party identifiers, but not Democratic identifiers, gave lower evaluations to Democratic governors. His finding suggests that analyses of gubernatorial elections must take into account both “divided federalism”—governors and presidents of opposite parties—and voters’ partisan preferences.
DATA AND ANALYSIS
The presidential data in the following analyses include county-level election returns and county-level unemployment data for the 1996–2008 presidential elections, and the gubernatorial data include county-level vote tallies and county-level unemployment data for 175 off-year gubernatorial elections from 1994 to 2010.Footnote 12 These data were combined with county-level data on median household incomes, county demographic data on age (percent 18–30 and 65 and older), percent urban, percent African American, and education (percent without a high school diploma and percent with a four-year college degree or higher).Footnote 13 The dependent variable for all the analyses is the Democratic percent of the two-party vote for president or governor. This variable is lagged one election and included on the right-hand side to control for previous political and partisan forces. Unemployment is included in the analysis in two forms: the unemployment rate in the county in October of the election year, and the change in unemployment from January to October of the election year.Footnote 14 The analysis includes 3,111 counties.Footnote 15 In Tables 4 and 5, the data are pooled across elections and estimated with fixed-year and state effects. The analysis was also conducted with county fixed-effects. Those results are displayed and discussed in the Appendix.
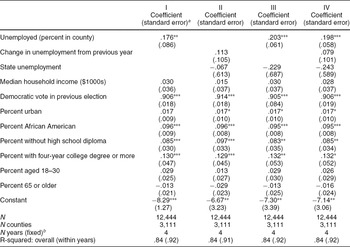
Panel Regression of County-level Unemployment and the Democratic Percent of the Two-party Vote for President, 1996–2008

aStandard errors are bootstrapped with 250 replications; significance tests based on the normal distribution.
bState effects were fixed through inclusion of state-dummy variables not reported here.
*statistical significance at .10, two-tailed test;
**statistical significance at .05, two-tailed test;
***statistical significance at .01, two-tailed test.
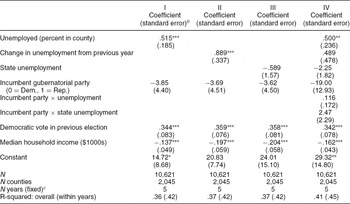
Panel Regression of County-level Unemployment and the Democratic Percent of the Two-party Vote for Governor, 1994–2010a

aDemographic variables were included for all models. The following results are for Model IV: Percent African American, .250 (.024); Percent aged 18–30, .024 (.036); Percent without high school diploma, .289 (.063); Percent with four-year college degree or more, .364 (.050); Percent 65 or older, −.057 (.036); Percent urban, .020 (.006).
bStandard errors are bootstrapped with 250 replications; significance tests are based on the normal distribution.
cState effects were also fixed through inclusion of state-dummy variables.
*statistical significance at .10, two-tailed test;
**statistical significance at .05, two-tailed test;
***statistical significance at .01, two-tailed test.
The main fixed-year results follow in three tables. Table 4 presents regression estimates for four presidential elections from 1996 to 2008, and Table 5 gives results for the 175 midterm gubernatorial elections. Table 4, which combines Republican and Democratic incumbent administrations, demonstrates the impact of unemployment generally on U.S. presidential elections, but cannot fully distinguish between the partisan and reward-punishment hypotheses at the presidential level. Because of the larger number of gubernatorial elections, Table 5 includes interactions between incumbent party and unemployment and therefore allows a direct test of the partisan and reward-punishment hypotheses. However, further tests are conducted in Table 7, which analyzes the relationship between unemployment and vote shares by different incumbent governing parties.
Table 4 reports estimates from a panel regression based on county-level unemployment and county-level percentages of the Democratic two-party vote across all four elections. The estimation makes use of 12,444 observations (3,111 counties × four elections), with fixed effects for election years and states, and with controls for the median income level in the county, the Democratic vote share in the previous presidential election, and various county-level demographic variables. Unemployment enters the analysis as the seasonally unadjusted unemployment rate in the county in October of the election year and as the change in unemployment from January to October of the election year (i.e., October rate minus January rate).
Table 4 presents several different specifications. Results of Model I (first column) are based on just the October county-level unemployment rate in the year of the election. Model II (second column) includes the change in unemployment during the election year (January through October) and in state-level unemployment, Model III (third column) includes county and state unemployment, and Model IV (fourth column) includes all three unemployment measures. All standard errors are bootstrapped from 250 replications, and hypotheses tests are based on the symmetric normal distribution.
All four models in Table 4 fit the data well. The overall R-squared values are .84, and the percent of variance explained within years is even higher. Model I predicts the direction of the vote outcome correctly in 86.5% of the counties over four elections. Most importantly, the October unemployment rate is positive and statistically significant in Models I, III, and IV, with coefficients several times larger than their standard errors. Once the October unemployment rate is controlled, however, the change in unemployment over the election year does not attain statistical significance in any of the models. The coefficient for state-level unemployment is negative, but nowhere near statistical significance. When it is excluded from the estimation (Model I), it appears to bias the October unemployment coefficient downward.Footnote 16 In general, the positive and significant sign of the October county-level unemployment coefficient indicates quite clearly that higher county-level unemployment favors candidates of the Democratic Party. Other things being equal, the higher the county-level unemployment rate in October of the presidential election year, the higher the county-level percentage of the two-party vote for the Democratic candidate.
Specifically, an increase in unemployment of one point (for example, 6% to 7%) across counties is predicted to yield the Democratic candidate a gain of roughly .203 (Model III) of 1% of the two-party vote. This may not seem like an especially large change in the Democratic vote percentage, but it is large enough to have an impact in some states in some years. Consider, for example, an increase or decrease in unemployment by 2.5 points (roughly one standard deviation change in the average unemployment across counties from 1992 to 2008). A change in unemployment of that magnitude predicts a change in the two-party Democratic vote of one-half of 1%, which is sufficient to have changed the popular vote outcome in 12 states between 1992 and 2008.Footnote 17
Table 5 displays similar results for midterm gubernatorial elections across 35 states from 1994 to 2010. Like the previous table, it presents several different specifications. In Models I and IV, the county unemployment rate in October of the election year has a positive and statistically significant effect on the Democratic vote. Change in unemployment over the year of the election is also a statistically significant predictor of Democratic voting in Model II, but it fades in significance when county-level unemployment is included as a predictor (Model IV). As in the presidential models, state-level unemployment is negatively signed, and even though the magnitude of the coefficient is large in Model IV, it falls far short of conventional statistical significance.Footnote 18 The political effects of unemployment therefore appear to play out most significantly at the local level of counties. Compared with the presidential results, the October county-level unemployment rate has a much larger effect on the Democratic gubernatorial vote than on the Democratic presidential vote. An increase in the unemployment rate of one point leads to an increase in the Democratic percentage of the two-party vote of .515 points (Model I).
Before turning to tests of the partisan and reward-punishment hypotheses, it is worth investigating a possible threat to the results in Tables 4 and 5. Counties that typically vote Democratic may naturally have higher unemployment rates than Republican counties because Democratic voters are demographically more susceptible to unemployment than Republican voters. County-level unemployment rates may therefore be proxies for the political composition of the counties. If so, then the estimated effects of unemployment in Tables 4 and 5 may be biased despite efforts to control for county-level demographic indicators of party preference.
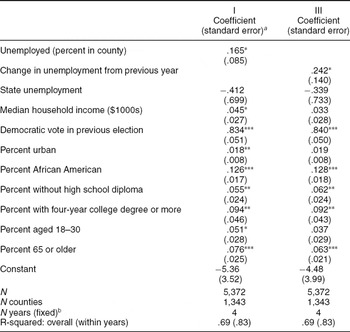
One way to check if unemployment merely proxies voting patterns within counties is to estimate the models in Tables 4 and 5 for bedrock Republican counties. In counties that regularly cast a majority of votes for Republican candidates, the relationship between unemployment and Democratic vote share should disappear or be seriously attenuated if it is spurious. Table 6 replicates the results in Table 4 for presidential elections for only those counties that cast a majority of the two-party vote for Republican candidates in five consecutive presidential elections from 1992 through 2008. The results indicate some attenuation of the effects in Table 4, but clear positive effects still remain. The coefficient for the October unemployment rate (first column of results) declines from .203 to .165 with a wider confidence band, but is still statistically significant with a p-value of .053. The coefficient for change in unemployment over the previous year, however, doubles in magnitude from .113 to .242 and, in contrast to the full sample estimation, attains statistical significance at a traditional level.
Panel Regression of County-level Unemployment and the Democratic Percent of the Two-party Vote for President, 1996–2008, in Counties Voting Republican for Five Consecutive Elections

a Standard errors are bootstrap with 250 replications; statistical tests are based on the normal distribution.
b State effects were fixed through inclusion of state-dummy variables not reported here.
*statistical significance at .10, two-tailed test;
**statistical significance at .05, two-tailed test;
***statistical significance at .01, two-tailed test.
Gubernatorial elections exhibit similar results when restricted to 468 counties that cast a majority of Republican votes for governor over six consecutive gubernatorial elections. The full results are not reported here, but the coefficient for the October unemployment rate (corresponding to Model I in Table 5) is .418 with a bootstrap standard error of .174, which corresponds to a p-value of .016. This indicates some attenuation from the corresponding coefficient of .515 in Table 5, but the result is still quite strong. Generally, then, unemployment yields a Democratic electoral benefit even in bedrock Republican counties.
Turning now to the tests of the partisan and reward-punishment hypotheses, the models of presidential elections in Table 4 cannot fully distinguish between the partisan and reward-punishment hypotheses because incumbency effects cannot be estimated with years fixed. However, with 35 gubernatorial elections each midterm year, the party of the incumbent governor varies sufficiently across elections, even with years fixed, to allow for a test of these hypotheses. The partisan hypothesis predicts a positive coefficient for unemployment regardless of the incumbent party. The reward-punishment hypothesis, in contrast, predicts that unemployment will have a positive effect on the Democratic vote share only when Republicans are the incumbent party, and a negative effect when the Democrats have held office the previous four years.
Model IV of Table 5 includes an interaction between the party of the incumbent governor and unemployment. With the incumbent party coded as 1 for Republicans and 0 for Democrats, the partisan hypothesis predicts that the county-level unemployment variable should by itself have a positive and significant effect on the Democratic vote—that is, Democrats should benefit electorally from higher unemployment even when they have controlled the governor's office for the previous four years. The reward-punishment hypothesis predicts that the coefficient for county unemployment alone should be negative—higher unemployment following Democratic control should penalize Democratic candidates. Both the partisan and reward-punishment hypotheses predict a positive effect for the interaction between incumbent party and unemployment, and thus the sign of the coefficient for the county unemployment variable is the key to distinguishing the two hypotheses.
The interaction between incumbent party and county unemployment in Model IV of Table 5 is positive as both hypotheses predict, even though it falls short of statistical significance. More importantly, however, the coefficient for county unemployment is positive and statistically significant, indicating that when the Democrats are the incumbent party, higher unemployment still boosts the Democratic vote share. Thus, the basic finding that higher levels of county-level unemployment translate into higher vote shares for Democratic candidates holds even after four years of Democratic control.Footnote 19
Further tests of the partisan and reward-punishment hypotheses are presented in Table 7.
Effects of Unemployment on Democratic Percentage of the Two-party Vote by Type of Electiona

a Cell entries are coefficients from fixed-effects panel regression using model IV (Table 4) and model I (Table 5) without incumbency. Pooled results are from model IV (Table 4) for presidential elections and model I (Table 5) for gubernatorial elections. Standard errors are bootstrapped from 250 replications. Significance levels are noted as in previous tables.
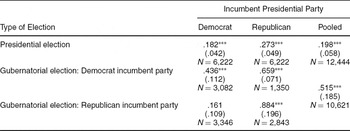
Table 7 reports unemployment coefficients for different combinations of the incumbent presidential party and the incumbent gubernatorial party. To estimate effects of presidential incumbency, the data were partitioned into two subsets, one including all county-years where Democrats were the incumbent presidential party (1996 and 2000) and the other including county-years where the Republicans were the incumbent party (2004 and 2008). The coefficients in Table 7 were obtained from regressions using the same specification as Model IV in Table 4 and Model I in Table 5. The third “pooled” column in Table 7 establishes correspondence to the results in Tables 4 and 5. Following the specification of hypotheses in Table 3, when the dependent variable is the Democratic vote percentage, the coefficient for the unemployment variables must be positive for both Republican and Democratic incumbent parties to reject the reward-punishment hypothesis in favor of the partisan hypothesis.
For presidential elections, the results in Table 7 provide strong support for the partisan hypothesis and indicate rejection of the reward-punishment hypothesis. If the reward-punishment hypothesis were true, then higher unemployment should have a negative effect on the Democratic vote when Democrats controlled the presidency and a positive effect when Republicans controlled the White House for the past four years. To the contrary, however, the effect of unemployment on the Democratic percentage of the two-party presidential vote in Table 7 is positive and statistically significant when both Republicans and Democrats have been the incumbent party. After Democratic control, the coefficient for county unemployment is .182, and after Republican control, it is .273.
The reward-punishment logic is slightly more complicated for gubernatorial elections because the incumbent gubernatorial party may be different from the incumbent presidential party. As noted earlier, research on gubernatorial elections consistently shows that national economic and political factors have important effects on state-level elections. Thus, the extent to which voters punish or reward governors for high or rising unemployment may depend on whether the incumbent presidential party is the same or different from the incumbent gubernatorial party. For this reason, the analysis of gubernatorial elections in Table 7 was conducted separately for Democratic and Republican presidential incumbent parties.
The results for gubernatorial elections in Table 7 again provide strong support in favor of the partisan hypothesis and against the reward-punishment hypothesis. Consider first the cases where the incumbent presidential party and the party of the incumbent governor are the same. In these situations, voters should have no trouble assigning blame or credit for high or rising unemployment, and by the logic of Table 3, if the reward-punishment hypothesis were true, then unemployment should have a negative effect on the Democratic vote when Democrats have controlled both offices. Similarly, unemployment should have a positive effect on the Democratic vote when Republicans have controlled both offices. This is not what the empirical analysis shows, however. High or rising unemployment favors Democratic candidates, even when Democrats have controlled both the White House and the governor's mansion for the past four years. The value of the unemployment coefficient is .436 and statistically significant when Democrats have controlled both offices, and the coefficient is .884 and statistically significant when Republicans have controlled both offices.Footnote 20
When control of the two offices has been split between the parties, the evidence again supports the partisan hypothesis over the reward-punishment scenario. When Republicans have controlled the White House, the coefficient for unemployment given a Democratic incumbent gubernatorial party is .659.Footnote 21 The only situation where Democratic gubernatorial candidates do not benefit significantly from high or rising unemployment is when the Democrats have controlled the White House and a Republican incumbent governor is running for reelection. In this situation, the unemployment coefficient is positive (.161), but it does not attain statistical significance.
Viewing the coefficients in Table 7 from a different perspective clarifies the effects of national forces. The effects of unemployment in gubernatorial elections depend considerably on which party has controlled the White House over the past four years. When the incumbent gubernatorial party is Democratic, the effect of a one-point increase in unemployment is .436 when Democrats control the White House and .659 when Republicans are the incumbent presidential party. When the incumbent gubernatorial party is Republican, the effect of a one-point increase in unemployment is .161 following Democratic presidential administrations and .884 following an incumbent Republican presidential administration.Footnote 22
Finally, Table 7 reveals that Democrats benefit more from high or rising unemployment when Republicans are the incumbent party. For presidential elections, the unemployment coefficient increases from .182 when Democrats are the incumbent party to .273 when Republicans are the incumbent party. For gubernatorial elections, when Republicans are the incumbent party, the Democratic advantage jumps from .161 to .884. Thus, not only do national forces have a strong impact on gubernatorial elections but Democratic candidates at all levels also benefit much more from high or rising unemployment when Republicans have controlled the White House for the previous four years.
CONCLUSION
The analysis of county-level unemployment and voting patterns in gubernatorial and presidential elections yields consistent evidence that higher rates of unemployment benefit Democratic candidates. High unemployment has a larger positive impact on the Democratic vote share when Republicans are the incumbent party than when Democrats are the incumbent party, but the positive relationship between unemployment rates and the Democratic vote holds regardless of the incumbent party. Unemployment, therefore, does not conform to the usual reward-punishment perspective of economics and elections. When Democrats are in power and unemployment increases, for example, they are not punished; when Democrats are in power and unemployment decreases, they are not rewarded.
The explanation for these findings follows from evidence that unemployment is a partisan issue for voters, not a valence issue, and that the Democratic Party “owns” unemployment. Voters who see unemployment as a problem and prefer government action clearly favor the Democratic Party over the Republican. When unemployment is high or rising, Democratic candidates can successfully convince voters that they are the party best able to solve the problem. Voters turn to Democratic candidates during these times. But when unemployment is low or falling, Democratic candidates cannot so easily differentiate themselves from Republicans and capitalize on their ownership of the unemployment issue. During these times, Republicans can emphasize issues about national security or the size of the federal government that work to the advantage of Republican candidates.
The electoral implications of unemployment are consistent with the strategic policy positions of politicians in both major parties. Given the historical Democratic electoral advantage from high or rising unemployment, Democrats continue to embrace the New Deal approach of government spending and the expansion of government programs to provide relief for unemployment. Perpetuating their party's reputation among voters as the party best able to handle unemployment is a top priority. The strategic objective for Republican politicians is to counteract or eliminate the longstanding Democratic electoral advantage from unemployment. To this end, Republican politicians since 1980 have advocated tax cuts and less federal regulation as alternatives to more government spending to stimulate economic growth and produce jobs. Both parties’ strategies were manifested clearly in the American Recovery and Reinvestment Act (2009), for example, which brought the Democratic and Republican positions on taxes and spending into sharp contrast. Additionally, Republicans have initiated efforts to limit deficit spending and impose other economic austerity measures that complicate efforts by incumbent Democrats to increase government spending. These policies serve to deny Democrats recourse to the main policy tool they have advocated historically to remedy unemployment.
It remains unclear whether increases in government spending are objectively more effective than tax cuts for generating economic growth (e.g., Alesina and Ardagna Reference Alesina and Ardagna2010; Romer and Romer Reference Romer and Romer2010). For the major political parties, however, political reality is ultimately more important than economic reality. The overriding political objective for both parties is to be perceived by voters as the party best able to handle unemployment. The contest to convince voters that spending or tax cuts are essential for producing jobs and economic prosperity has therefore become the defining political battle in contemporary partisan debates about the national economy. Yet until voters’ beliefs about which party can best handle the problem of unemployment begin to change, the Democratic electoral advantage with regard to unemployment is likely to persist.
APPENDIX
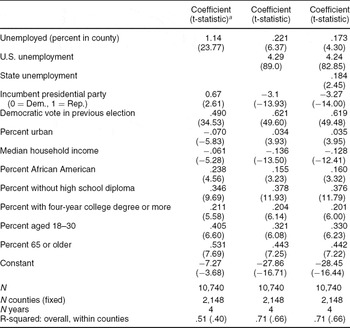
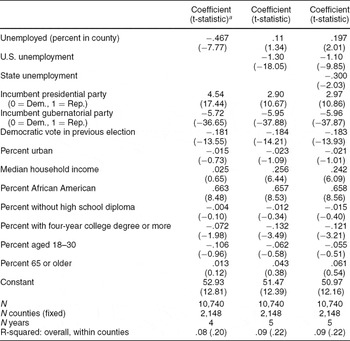
The fixed-county analysis is equivalent to including a dummy variable for each county, so that only the variation in unemployment within counties over time will affect vote outcomes. The drawback to this approach is that there are relatively few time points in the data. The presidential data contain five elections and the gubernatorial data only six. This makes it difficult, despite the aggregation over counties, to disentangle the effects of county-level unemployment trends from trends in state and national unemployment. Additionally, it is difficult to disentangle national and state unemployment from other state and national factors that vary over time (e.g., quality of gubernatorial candidates, changing social issues, scandals, and so forth). In the analysis with fixed-year effects, where state effects are also fixed, national unemployment is constant, and unobserved state-level factors will be swept into the constant term. Any remaining variation in state-level unemployment can be estimated across 35 state-level observations in the gubernatorial analysis and 49 state observations in the presidential analysis. The upshot is that results are much more stable for the fixed-year analysis than for the fixed-county analysis. With the fixed-county gubernatorial analysis, it is much more difficult to account for differences across states that could be affecting the results. Nevertheless, the fixed-county results are reported in Tables A1 and A2. In general, the results for presidential elections are quite similar to those for the fixed-year analysis. The coefficient for county-level unemployment is similar to that for the fixed-year analysis. In addition, national and state unemployment exert strong positive effects on the Democratic vote.
The fixed-county analysis for the gubernatorial analysis is consistent with Table 6 in that Democrats benefit electorally from increasing unemployment at the county level. However, Republicans benefit from rising unemployment at the state and national levels. Whether these results are a consequence of important differences across states that the fixed-county model cannot capture, or whether they are true effects, is unclear.
County Fixed-effect Analysis of Unemployment and Presidential Elections

County Fixed-effect Analysis of Unemployment and Gubernatorial Elections




Comments
No Comments have been published for this article.