





Introduction
Patients with functional single-ventricle hearts proceed through staged surgical palliation in early childhood resulting in the Fontan procedure, whereby the inferior vena cava is connected to the pulmonary artery. The haemodynamics of the Fontan circulation, which lacks a sub-pulmonary pump, require optimal pressure for adequate pulmonary blood flow and resultant cardiac output with elevated pressures being intimately related to morbidity and mortality. Reference Rychik, Atz and Celermajer1–Reference Jalal, Gewillig and Boudjemline4 The gold standard for determining these pressures has been an invasive cardiac catheterisation. Reference Rychik, Atz and Celermajer1,Reference Rychik5 Patients with Fontan physiology are also evaluated with non-interventional echocardiography as a standard of care. In adults, a key component of echocardiographic evaluation has been the use of a “sniff test.” Reference Rudski, Lai and Afilalo6 The sniff test evaluates the percentage of diameter change in the inferior vena cava during inspiration, the collapsibility index, as a surrogate of downstream right atrial pressure. Reference Kircher, Himelman and Schiller7,Reference Brennan, Blair and Goonewardena8 This non-invasive technique has been rigorously studied and correlated with right atrial or central venous pressure in patients with biventricular anatomy. Reference Klangthamneam, Meemook, Petnak, Sonkaew and Assavapokee9 This technique has not yet been validated as a measure of pressure assessment in patients with Fontan circulation. Our study aims to evaluate the association between the collapsibility index measured on transthoracic echocardiography and directly measured Fontan pressures.
Methods
Study population
This was a two-centre prospective cohort study of patients with functionally single-ventricle hearts that had previously undergone the Fontan procedure and were undergoing clinically indicated cardiac catheterisation and same day transthoracic echocardiogram as part of their routine Fontan surveillance from January 2020 to December 2024 at a tertiary referral centre. Institutional review board approval was obtained at both participating institutions independently. Informed consent was waived by the institutional review boards because transthoracic echocardiography was previously scheduled and inspiratory sniff assessment is commonly utilised during echocardiographic evaluation of central venous pressure per the American Society of Echocardiography guidelines. Patients were identified for the study upon referral for the clinically indicated cardiac catheterisation as part of routine Fontan surveillance. Patients of all ages were eligible for inclusion. All patients in the study underwent extracardiac total cavopulmonary connection. Patients with absent or interrupted inferior vena cava, pregnant women, neonates, decisionally impaired adults, prisoners, and those unable to perform a sniff manoeuvre were excluded.
Variables and outcomes
Standard transthoracic echocardiography protocols at both institutions were prospectively amended to include assessment of inferior vena cava collapsibility using the inspiratory sniff manoeuvre in subcostal long-axis imaging in accordance with the American Society of Echocardiography guidelines. Eligible patients meeting inclusion criteria and who were scheduled to undergo both cardiac catheterisation and transthoracic echocardiogram on the same day were reviewed. Echocardiograms were performed prior to induction of anaesthesia and cardiac catheterisation to minimise differences in physiology. Transthoracic echocardiograms were evaluated by a single experienced cardiologist at each respective institution, two in total. Echocardiographic measurements were blinded from catheterisation values.
Measurements of the inferior vena cava and degree of collapsibility were obtained from subcostal view, 2–3 cm distal to inferior vena cava–right atrial junction per the American Society of Echocardiography guidelines. Reference Rudski, Lai and Afilalo6 The inferior vena cava diameter was measured at end-expiration and during a rapid inspiratory sniff manoeuvre (see Figure 1) using M-mode acquisition. The sniff manoeuvre was repeated multiple times in each patient to optimise image quality and respiratory effort. A single technically adequate measurement demonstrating the greatest inspiratory effort was utilised for assessment, consistent with routine echocardiographic practice. The collapsibility index was calculated as the percentage change in the diameter of the inferior vena cava between these conditions. An additional echocardiogram parameter studied was the inferior vena cava to abdominal aorta ratio. The abdominal aorta diameter was measured near the level of the diaphragm, proximal to the coeliac trunk. The presence of a Fontan fenestration was noted when present.
Graphical illustration of a patient with Fontan anatomy at rest (left) and performing a “sniff test” (right) with the negative intrathoracic pressure affecting IVC diameter. IVC = inferior vena cava.

Figure 1. Long description
Panel A: A diagram of a patient with Fontan anatomy at rest. The inferior vena cava is connected to the pulmonary artery. The heart and major blood vessels are shown with the inferior vena cava highlighted. Panel B: A diagram of a patient performing a sniff test. Negative intrathoracic pressure affects the diameter of the inferior vena cava. The heart and major blood vessels are shown with the inferior vena cava highlighted and arrows indicating the change in diameter during inspiration.
Invasive haemodynamics were obtained during cardiac catheterisation using standard techniques with variables studied including Fontan pressure, end-diastolic ventricular pressure, cardiac output, pulmonary blood flow, and systemic and pulmonary vascular resistance with values obtained prior to any catheter-based intervention, if performed. Cardiac output and pulmonary blood flow were calculated using the Fick principle. Fontan pressures of 14 mmHg or less were classified as non-elevated, and Fontan pressures equal to or greater than 15 mmHg were classified as elevated. Pulmonary vascular resistance/systemic vascular resistance ratio less than 0.15 was classified as non-elevated, while a ratio equal to or greater than 0.15 was classified as elevated. A pulmonary vascular resistance indexed (WU/m2) value of less than 2.5 was classified as non-elevated, while a value equal to or higher than 2.5 was classified as elevated. These normative thresholds for Fontan pressure (<15 mmHg), indexed pulmonary vascular resistance (<2.5 WU/m2), and pulmonary vascular resistance/systemic vascular resistance ratio (<0.15) are consistent with guidelines and studies linking adverse haemodynamics and clinical outcomes. Reference Rychik, Atz and Celermajer1,Reference Miranda, Borlaug, Hagler, Connolly and Egbe10
Statistical analysis
The association of collapsibility index and inferior vena cava/abdominal aorta ratio with the directly measured cardiac catheterisation variables was analysed. Given the limited sample size of the study, both continuous correlation analysis and categorical threshold comparisons were evaluated. Continuous data were expressed as mean (standard deviation). Categorical variables were expressed as frequency or proportion. Comparisons between categorical variables were performed with chi-square test or Fisher’s exact test as applicable. Continuous variables were compared between groups using Student’s t-test for normally distributed variables and Wilcoxon Mann–Whitney U test for non-parametric variables. Correlation between collapsibility index and Fontan pressure was assessed using Pearson’s correlation analysis. p value of <0.05 was utilised to define statistical significance. Statistical analysis was performed on JMP ® Pro Version 16.0.
Results
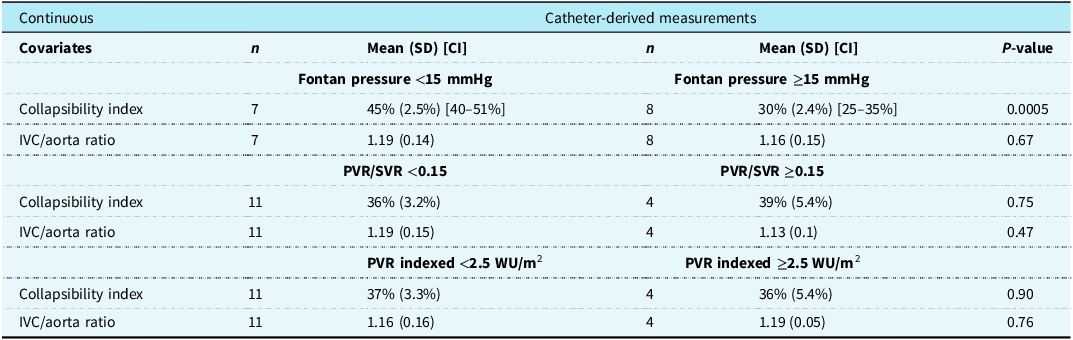
Fifteen patients were enrolled and analysed for the study with a mean age of 17.4 (7.5) years. Five of 15 patients had a Fontan fenestration present. Findings are summarised in Table 1. Mean Fontan pressure for the cohort was 14.2 (3.1) mmHg. Mean indexed pulmonary vascular resistance and pulmonary vascular resistance/systemic vascular resistance ratio were 1.86 (0.85) WU/m2 and 0.11 (0.05), respectively. Mean ventricular end-diastolic pressure was 8.5 (3.8) mmHg and did not demonstrate an apparent relationship with inferior vena cava collapsibility index.
Comparison of continuous variables derived on echocardiography with catheter-derived measurements

Table 1. Long description
A table comparing catheter-derived measurements with continuous variables. The table has 4 rows and 8 columns. The columns are labeled as Covariates, n, Mean (SD) [CI], n, Mean (SD) [CI], and P-value. The rows are grouped into three sections based on different conditions: Fontan pressure <15 mmHg vs. >=15 mmHg, PVR/SVR <0.15 vs. >=0.15, and PVR indexed <2.5 WU/m2 vs. >=2.5 WU/m2. Each section compares the Collapsibility index and IVC/aorta ratio under different conditions. For Fontan pressure <15 mmHg vs. >=15 mmHg: Collapsibility index has 45 percent (2.59) [40–51 percent] for 7 patients and 30 percent (2.4) [25–35 percent] for 8 patients with a P-value of 0.0005. IVC/aorta ratio is 1.19 for both groups with P-value of 0.67. For PVR/SVR <0.15 vs. >=0.15: Collapsibility index is 36 percent (3.2) for 11 patients and 39 percent (5.4) for 4 patients with a P-value of 0.75. IVC/aorta ratio is 1.19 for both groups with a P-value of 0.47. For PVR indexed <2.5 WU/m2 vs. >=2.5 WU/m2: Collapsibility index is 37 percent (3.3) for 11 patients and 36 percent (5.4) for 4 patients with a P-value of 0.90. IVC/aorta ratio is 1.16 for both groups with a P-value of 0.76.
IVC = inferior vena cava; PVR = pulmonary vascular resistance; SVR = systemic vascular resistance; SD = standard deviation; CI = confidence interval (where applicable); n, sample size; P-value < 0.05, statistically significant.
Inferior vena cava collapsibility index was significantly higher for patients with non-elevated Fontan pressure versus patients with elevated Fontan pressure (45.4 [2.5]% versus 29.6 [2.4]%, respectively; p = 0.0005) (Table 1). Inferior vena cava/abdominal aorta ratio was not significantly different in patients with non-elevated versus elevated Fontan pressure (1.19 versus 1.16, respectively, p = 0.67). When comparing patients based on non-elevated versus elevated pulmonary vascular resistance/systemic vascular resistance ratios, neither the collapsibility index (36.43 [3.24]% versus 38.51 [5.37]% respectively, p = 0.75) nor the inferior vena cava/abdominal aorta ratio (1.19 [0.04] versus 1.13 [0.07], respectively, p = 0.47) was statistically different. When comparing patients with non-elevated versus elevated indexed pulmonary vascular resistance, there was no significant difference in collapsibility index (37.21 [3.25]% versus 36.37 [5.39]%, p = 0.9) or inferior vena cava/abdominal aorta ratio (1.16 [0.04] versus 1.19 [0.07], p = 0.76).
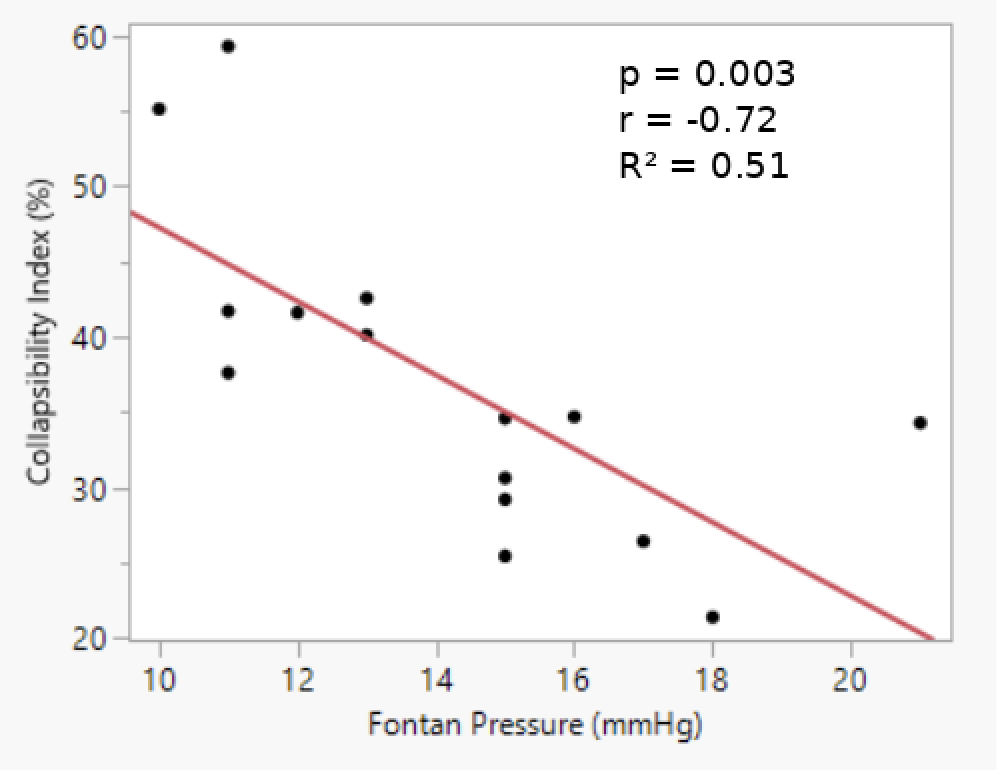
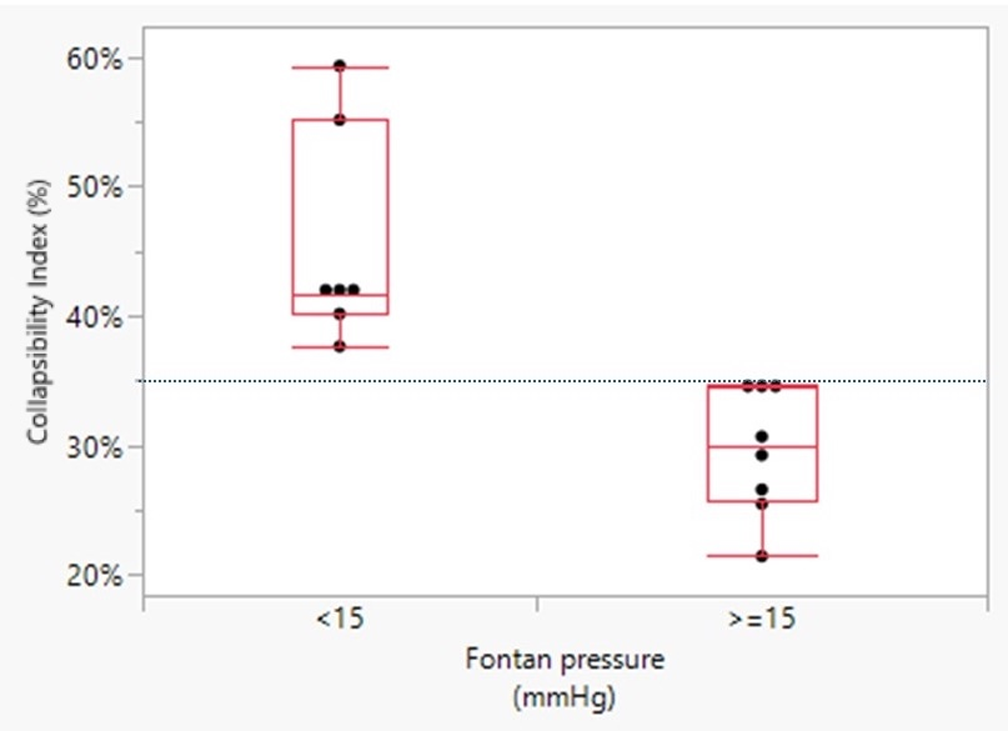
Inferior vena cava collapsibility index demonstrated a moderate inverse correlation with Fontan pressure (Pearson’s r = −0.72, R2 = 0.51, p = 0.003) (Figure 2). Increasing Fontan pressure was associated with reduced inferior vena cava collapsibility index. A collapsibility index threshold of 35.0% demonstrated a 100% positive predictive value for elevated Fontan pressure within this cohort (Figure 3). Given the limited sample size of the present study, this observation is limited to this small cohort, should be interpreted as hypothesis-generating, and requires validation in larger studies.
Scatter plot comparing Fontan pressure and CI. CI = collapsibility index; IVC = inferior vena cava.

Analysis of collapsibility index in patients with non-elevated versus elevated Fontan pressures/Whisker plot represents minimum and maximum value; box represents 25 to 75th percentile and median value.

Discussion
Early identification of Fontan pressure and haemodynamic derangements are paramount to optimal long-term palliated single-ventricle physiology care. Outside of late-stage end organ or lymphatic dysfunction, elevation in Fontan pressure is often subtle and may go undiagnosed until an invasive measurement is performed. Therefore, a less invasive screening method would be a valuable tool to identify patients at risk and allow for earlier intervention. Echocardiography is the first line imaging study to assess patients with Fontan physiology. Our study demonstrates a novel strategy for evaluating Fontan pressures, with a higher inferior vena cava collapsibility index associated with lower Fontan pressure. As echocardiographic assessment is recommended more frequently than other imaging or invasive modalities, Reference Rychik, Atz and Celermajer1 this suggests that this variable could provide additional information regarding Fontan pressures during routine echocardiographic surveillance. In patients with Fontan physiology, pulmonary vascular resistance, ventricular diastolic function and systemic vascular compliance, and the stability of the central venous pressure play a central role in optimal haemodynamics. Reference Liang, Senzaki, Kurishima, Sughimoto, Inuzuka and Liu11 Assessing single ventricle (more notably right ventricle) size and systolic function can be difficult secondary to complex chamber geometry and wall motion abnormalities causing interobserver variability. Reference Margossian, Schwartz and Prakash12 Using standard algorithms for assessment in biventricular circulation, evaluating diastolic function for this cohort demonstrates abnormalities regardless of systolic function or clinical state. Reference Margossian, Schwartz and Prakash12–Reference Olivier, O’leary and Pankratz14 Similarly, tissue Doppler assessment is also distorted, making reliable quantification of systolic and diastolic function fraught with error. Reference Vitarelli, Conde and Cimino15
Kircher et al. demonstrated the utility of inferior vena cava collapsibility index as a non-invasive estimate of central venous pressure. Reference Kircher, Himelman and Schiller7 Subsequent studies have confirmed this relationship with larger cohorts and validated its use in routine assessment with adult patients. Reference Rudski, Lai and Afilalo6,Reference Brennan, Blair and Goonewardena8 While the relationship between inferior vena cava collapsibility and downstream venous pressure is well established in patients with biventricular circulation, Fontan physiology differs substantially given the absence of a sub-pulmonary ventricle and dependence of pulmonary blood flow on passive systemic venous return. In Fontan circulation, respiratory mechanics, systemic venous pathway compliance, appropriate ventricular diastolic function, and pulmonary vascular resistance all significantly influence Fontan pressure, systemic venous return, and cardiac output. Characterising systemic venous flow in Fontan patients is therefore challenging. Oka et al. demonstrated that reversal of flow in the hepatic vein peak velocity relative to forward flow was increased in patients noted to have higher inferior vena cava pressure with a mean ratio of 0.73:1 among all patients. Reference Oka, Kato and Fumino16 Most recently, Miyake et al. compared inferior vena cava diameter and respiratory collapse retrospectively with cardiac catheterisation variables obtained the day prior in 21 adult patients with Fontan physiology. Reference Miyake, Doi, Noguchi, Uehara and Tamura17 Using the American Society of Echocardiography guidelines for approximation of central venous pressure, there was a significant correlation with central venous pressure grade by echocardiography and inferior vena cava diameter with Fontan pressure. However, central venous pressure grade by echocardiography was lower than those by cardiac catheterisation. Our study supports Miyake’s findings in that we demonstrated an inverse association between inferior vena cava collapsibility index and invasively measured Fontan pressure. While the collapsibility index threshold demonstrated potential discriminatory ability in identifying elevated Fontan pressure in this cohort, the inverse relationship between collapsibility index and Fontan pressure across a continuous range may better reflect the underlying Fontan physiology.
Our findings suggest that inferior vena cava collapsibility may provide additional non-invasive information regarding Fontan haemodynamics. Interestingly, inferior vena cava collapsibility index was not associated with pulmonary vascular resistance or pulmonary vascular resistance/systemic vascular resistance ratio within the study cohort. This may suggest that the collapsibility index may reflect aspects of Fontan haemodynamics beyond pulmonary vascular resistance, although additional investigation is required to better define these relationships. Additional investigation is needed to further define the haemodynamic associations reflected by the inferior vena cava collapsibility index in Fontan physiology. Our study supports an increasing number of investigations attempting to minimise invasive procedures while maintaining a high standard of care through non-invasive imaging. Brown et al. reviewed 114 children with single-ventricle physiology evaluated for superior cavopulmonary connection and found that in those without suspected abnormalities after comprehensive echocardiography, catheterisation rarely revealed new findings or altered clinical course. Reference Brown, Gauvreau and Moran18 Similarly, Ro et al. analysed 99 patients prior to Fontan completion and developed non-invasive criteria that identified a “no-cath” group with a 93% negative predictive value, accurately excluding those unlikely to benefit from invasive assessment. Reference Ro, Rychik, Cohen, Mahle and Rome19 Our findings suggest that inferior vena cava collapsibility index may provide additional non-invasive information regarding Fontan haemodynamics; however, larger studies are needed before clinical application can be established.
Additional strategies to accurately assess Fontan pressure have been undertaken. Mastutani et al. demonstrated that peripheral venous pressure measurements can accurately reflect central venous physiology in patients with Fontan anatomy. Reference Masutani, Kurishima and Yana20 Subsequent studies have confirmed these findings and suggested that this technique can reduce the need for frequent invasive procedures. Reference Tan, Small, Gallotti, Moore and Aboulhosn21,Reference Miranda, Egbe, Van De Bruaene, Connolly, Burchill and Jain22 Miranda et al. also demonstrated that peripheral venous pressure monitoring is not only reliable in resting conditions but is accurate during exercise as well. Beyond one-time measurements, Bradley et al. demonstrated that implantable haemodynamic monitoring was a safe and feasible option for Fontan patients and may afford clinicians the ability to capture clinically relevant information in multiple physiologic states. Reference Bradley, Jassal, Moore-Clingenpeel, Abraham, Berman and Daniels23 These studies suggest that peripheral venous pressure monitoring and implantable haemodynamic devices, in addition to echocardiographic inferior vena cava assessment, may represent complementary non-invasive alternatives to cardiac catheterisation for estimating Fontan pressures. Additional investigation is warranted to determine if these techniques could be integrated into longitudinal surveillance.
Limitations
There are several limitations in our study. Our cohort is a relatively small sample size, limiting statistical power and precision of threshold-based analyses. Although measurements were performed prospectively and by blinded investigators with multiple sniff manoeuvres being performed to optimise image quality, formal interobserver and intraobserver variability assessments were not performed. Measurement-selection bias may have been introduced by selecting the acquisition demonstrating the greatest inspiratory effort. Future studies should incorporate reproducibility analyses to further define the reliability of the inferior vena cava collapsibility measurements in Fontan patients. Small differences in inferior vena cava diameter measurement may significantly alter calculated collapsibility index values, particularly in Fontan physiology where respiratory variation may be altered. Cardiac catheterisation was performed under general anaesthesia which may influence Fontan pressures. Detailed characterisation of Fontan subtype, ventricular morphology, atrioventricular valve regurgitation, and rhythm status was not controlled for in our study given the sample size and may represent potential confounding variables. Our multi-centre study may not reflect a diverse population. Patients undergoing echocardiograms pre-procedure had restrictions in regard to their fluid status and may not reflect a normovolemic state at the time of the study. Patient compliance with sniff test, while reliable in adults, may be more variable across a heterogenous age range.
Conclusions
Results of this pilot study suggests a moderate inverse relationship between collapsibility index and invasively measured Fontan pressure. Given the small sample size, further data collection is needed to provide stronger evidence of this relationship in the future to validate its clinical utility before use in clinical practice. If these findings continue to display a significant relationship in larger prospective studies, this echocardiographic technique may be used to monitor Fontan pressures and could potentially reduce the frequency of invasive procedures; however, larger prospective validation is needed prior to clinical application or reduction in invasive procedures.
Financial support
We received $5,000 from the Talwalkar Mentorship Research Award for outstanding guidance and training for research and clinical programmes at Oregon Health and Science University.
Competing interests
None. All authors contributed to the study conception, design, and/or preparation. The first draft of the manuscript was written by Matthew Campbell and provided to the lead authors at both institutions to disseminate selected authors for review. The lead investigator at both institutions reviewed the manuscript and approved submission.
Appendix
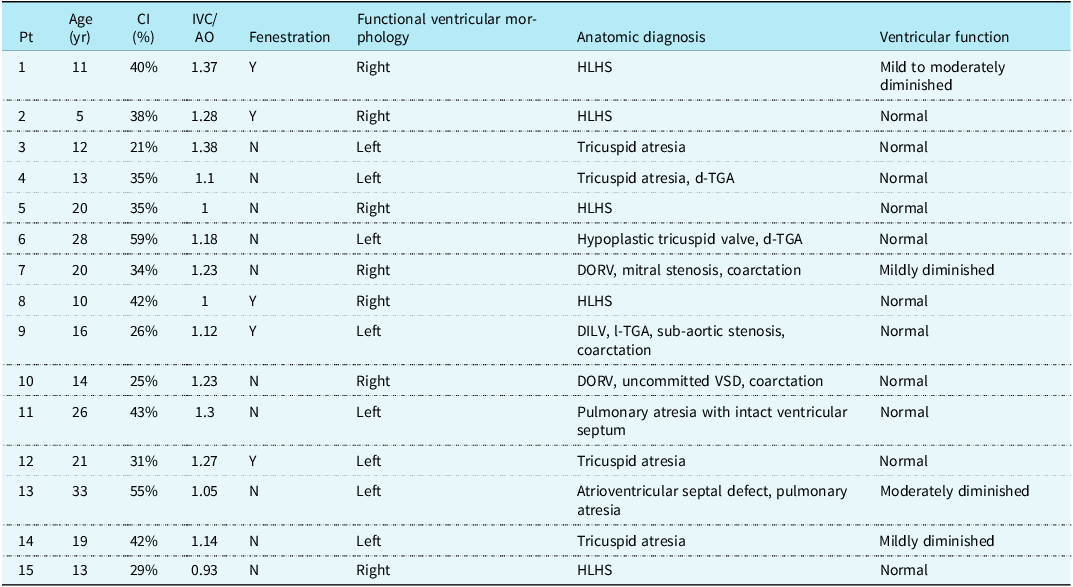
Echocardiographic findings

Table A1. Long description
The table presents echocardiographic findings for 15 patients. It includes columns for patient number, age in years, collapsibility index in percent, IVC/AO ratio, presence of fenestration, functional ventricular morphology, anatomic diagnosis, and ventricular function. Row 1: Patient 1, age 11, CI 40 percent, IVC/AO 1.37, fenestration present, right functional ventricular morphology, HLHS anatomic diagnosis, mild to moderately diminished ventricular function. Row 2: Patient 2, age 5, CI 38 percent, IVC/AO 1.28, fenestration present, right functional ventricular morphology, HLHS anatomic diagnosis, normal ventricular function. Row 3: Patient 3, age 12, CI 21 percent, IVC/AO 1.38, no fenestration, left functional ventricular morphology, tricuspid atresia anatomic diagnosis, normal ventricular function. Row 4: Patient 4, age 13, CI 35 percent, IVC/AO 1.1, no fenestration, left functional ventricular morphology, tricuspid atresia, d-TGA anatomic diagnosis, normal ventricular function. Row 5: Patient 5, age 20, CI 35 percent, IVC/AO 1, no fenestration, right functional ventricular morphology, HLHS anatomic diagnosis, normal ventricular function. Row 6: Patient 6, age 28, CI 59 percent, IVC/AO 1.18, no fenestration, left functional ventricular morphology, hypoplastic tricuspid valve, d-TGA anatomic diagnosis, normal ventricular function. Row 7: Patient 7, age 20, CI 34 percent, IVC/AO 1.23, no fenestration, right functional ventricular morphology, DORV, mitral stenosis, coarctation anatomic diagnosis, mildly diminished ventricular function. Row 8: Patient 8, age 10, CI 42 percent, IVC/AO 1, fenestration present, right functional ventricular morphology, HLHS anatomic diagnosis, normal ventricular function. Row 9: Patient 9, age 16, CI 26 percent, IVC/AO 1.12, fenestration present, left functional ventricular morphology, DILV, l-TGA, sub-aortic stenosis, coarctation anatomic diagnosis, normal ventricular function. Row 10: Patient 10, age 14, CI 25 percent, IVC/AO 1.23, no fenestration, right functional ventricular morphology, DORV, uncommitted VSD, coarctation anatomic diagnosis, normal ventricular function. Row 11: Patient 11, age 26, CI 43 percent, IVC/AO 1.3, no fenestration, left functional ventricular morphology, pulmonary atresia with intact ventricular septum anatomic diagnosis, normal ventricular function. Row 12: Patient 12, age 21, CI 31 percent, IVC/AO 1.27, fenestration present, left functional ventricular morphology, tricuspid atresia anatomic diagnosis, normal ventricular function. Row 13: Patient 13, age 33, CI 55 percent, IVC/AO 1.05, no fenestration, left functional ventricular morphology, atrioventricular septal defect, pulmonary atresia anatomic diagnosis, moderately diminished ventricular function. Row 14: Patient 14, age 19, CI 42 percent, IVC/AO 1.14, no fenestration, left functional ventricular morphology, tricuspid atresia anatomic diagnosis, mildly diminished ventricular function. Row 15: Patient 15, age 13, CI 29 percent, IVC/AO 0.93, no fenestration, right functional ventricular morphology, HLHS anatomic diagnosis, normal ventricular function.
Pt = patient; yr = year; CI = Collapsibility Index; %, percent; IVC = inferior vena cava; AO = abdominal aorta; Fenestration = Fontan fenestration is present; Y = yes; N = no; HLHS = hypoplastic left heart syndrome; d-TGA = d-transposition of the great arteries; DORV = double-outlet right ventricle; DILV = double-inlet left ventricle; l-TGA = I-transposition of the great arteries; VSD = ventricular septal defect. Functional ventricular morphology was determined based on the dominant ventricle by echocardiographic evaluation.
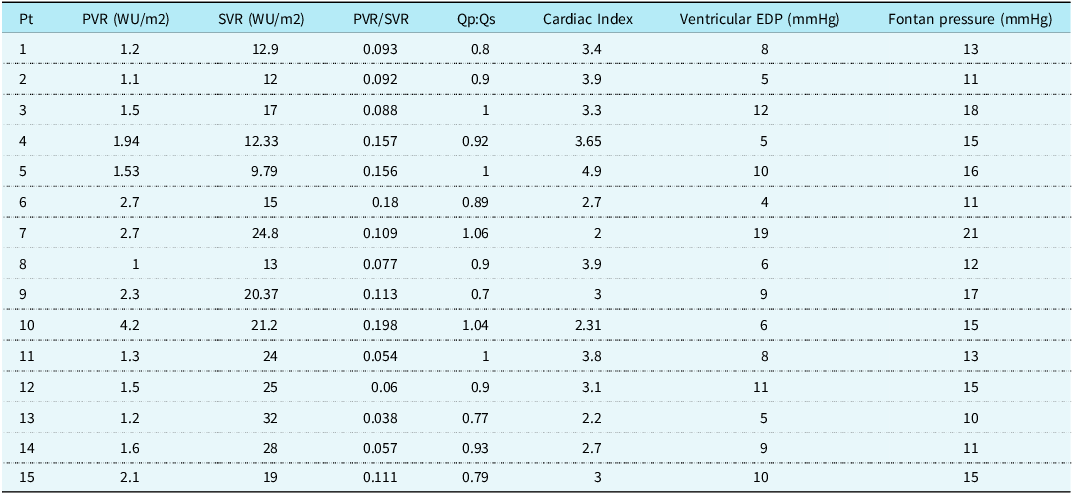
Haemodynamic catheterisation findings

Table A2. Long description
A table comparing haemodynamic catheterisation findings across different patients. The table has 15 rows and 8 columns. The columns are labeled as Pt, PVR (WU/m2), SVR (WU/m2), PVR/SVR, Qp:Qs, Cardiac Index, Ventricular EDP (mmHg), and Fontan pressure (mmHg). Row 1: Pt 1, PVR 1.2, SVR 12.9, PVR/SVR 0.093, Qp:Qs 0.8, Cardiac Index 3.4, Ventricular EDP 8, Fontan pressure 13. Row 2: Pt 2, PVR 1.1, SVR 12, PVR/SVR 0.092, Qp:Qs 0.9, Cardiac Index 3.9, Ventricular EDP 5, Fontan pressure 11. Row 3: Pt 3, PVR 1.5, SVR 17, PVR/SVR 0.088, Qp:Qs 1, Cardiac Index 3.3, Ventricular EDP 12, Fontan pressure 18. Row 4: Pt 4, PVR 1.94, SVR 12.33, PVR/SVR 0.157, Qp:Qs 0.92, Cardiac Index 3.65, Ventricular EDP 5, Fontan pressure 15. Row 5: Pt 5, PVR 1.53, SVR 9.79, PVR/SVR 0.156, Qp:Qs 1, Cardiac Index 4.9, Ventricular EDP 10, Fontan pressure 16. Row 6: Pt 6, PVR 2.7, SVR 15, PVR/SVR 0.18, Qp:Qs 0.89, Cardiac Index 2.7, Ventricular EDP 4, Fontan pressure 11. Row 7: Pt 7, PVR 2.7, SVR 24.8, PVR/SVR 0.109, Qp:Qs 1.06, Cardiac Index 2, Ventricular EDP 19, Fontan pressure 21. Row 8: Pt 8, PVR 1, SVR 13, PVR/SVR 0.077, Qp:Qs 0.9, Cardiac Index 3.9, Ventricular EDP 6, Fontan pressure 12. Row 9: Pt 9, PVR 2.3, SVR 20.37, PVR/SVR 0.113, Qp:Qs 0.7, Cardiac Index 3, Ventricular EDP 9, Fontan pressure 17. Row 10: Pt 10, PVR 4.2, SVR 21.2, PVR/SVR 0.198, Qp:Qs 1.04, Cardiac Index 2.31, Ventricular EDP 6, Fontan pressure 15. Row 11: Pt 11, PVR 1.3, SVR 24, PVR/SVR 0.054, Qp:Qs 1, Cardiac Index 3.8, Ventricular EDP 8, Fontan pressure 13. Row 12: Pt 12, PVR 1.5, SVR 25, PVR/SVR 0.06, Qp:Qs 0.9, Cardiac Index 3.1, Ventricular EDP 11, Fontan pressure 15. Row 13: Pt 13, PVR 1.2, SVR 32, PVR/SVR 0.038, Qp:Qs 0.77, Cardiac Index 2.2, Ventricular EDP 5, Fontan pressure 10. Row 14: Pt 14, PVR 1.6, SVR 28, PVR/SVR 0.057, Qp:Qs 0.93, Cardiac Index 2.7, Ventricular EDP 9, Fontan pressure 11. Row 15: Pt 15, PVR 2.1, SVR 19, PVR/SVR 0.111, Qp:Qs 0.79, Cardiac Index 3, Ventricular EDP 10, Fontan pressure 15.
Pt = patient; PVR = pulmonary vascular resistance; SVR = systemic vascular resistance; WU/m2 = Indexed Woods Units; Qp:Qs = pulmonary blood flow:systemic blood flow; EDP = end-diastolic pressure.


 Open access

