


There is a saying that “a picture is worth a thousand words”. Crime mapping has emerged as a major tool in crime prevention (Weisburd and McEwen Reference Weisburd and McEwen2015). If we want to stop crime, we have to understand the geographical area and people who are residing in that particular area. Place plays a vital role in understanding crime and how it can be tackled for any law enforcement agency. By identifying the area and timing of the occurrence of crimes, we can easily understand the crime pattern and target of criminals. Mapping the crime can help police organizations and other agencies to protect members of society and their property. After analysing hot spot areas, measures like increased patrolling, surveillance systems, awareness programmes and involvement of the members of society may be used to control and prevent crimes.
REVIEW OF THE LITERATURE
Environmental criminology talks about the importance of places which are crime attractors. In many cases, the crime attractors are public facilities like shopping malls, high schools, taverns, convenience stores, apartment buildings and public housing projects. Different types of facilities increase or decrease crime in their immediate environment. Defensible space features of the built environment, demographics and, to some extent, the temporary environment are the major variables affecting the rates of crimes (Perkins et al. Reference Perkins, Wandersman, Rich and Taylor1993).
A study which analysed hot spots confirmed that burglary (house breaking) clusters in both space and time (Johnson and Bowers Reference Johnson and Bowers2004). Similarly, a study using nearest neighbourhood hierarchical clustering (NNHC) in the Jaipur capital of Rajasthan, India identified five motor vehicle theft hot spots, which accounted for just .09% of area, but over 13% of these incidents, and four burglary/house breaking hot spots, which accounted for less than 1% of the city area, but for nearly 23 % of the incidents (Mazeika and Kumar Reference Mazeika and Kumar2017).
In a study carried out on crime mapping of motor vehicle thefts in Adelaide, South Australia (Henry and Bryan Reference Henry and Bryan2000), it was found that the density of thefts was highest near major commercial and entertainment centres (for example, the business district, retail and recreational areas). Brantingham and Brantingham (Reference Brantingham and Brantingham1982) found a positive correlation between rates of burglaries and commercial landmarks like fast food restaurants, traditional restaurants and pubs. A study showed that “burglars are attracted to neighbourhoods that are nearby their homes, nearby the city centre, affluent, physically accessible, and characterised by social disorganization” (Bernasco Reference Bernasco2006).
Places where crimes occur also have certain characteristics. The risk of cars being stolen increases when they are parked in temporary parking areas (Clarke and Mayhew Reference Clarke and Mayhew1994). One study found that burgled homes were lacking in territorial markers like walls and fences communicating privacy and individuality (Brown and Altman Reference Brown and Altman1982); another showed that houses which were near the city centre and houses which were relatively unoccupied were most likely to burgled (Cohen and Cantor Reference Cohen and Cantor1981). A study done to understand the characteristics of repeatedly victimized places for auto thefts used five variables, i.e. watchers, activity nodes, location, lighting and security (WALLS) indices. The results showed that locality and security indices were the affecting variables/predictors for repeat victimization (Levy and Tartaro Reference Levy and Tartaro2010).
Various studies have shown that crime prevention measures can reduce crimes to some extent. The presence of guards has a deterrent effect on offenders (Hannan Reference Hannan1982). According to routine activity theory, a capable guardian which includes human actors, such as police or security guards, or physical devices, such as closed-circuit television (CCTV) monitors can deter offenders (Eck and Weisburd Reference Eck and Weisburd1995). A study showed that the presence of motivated offenders and the absence of capable guardians both have a significant effect on the rates of auto thefts (Hollinger and Dabney Reference Hollinger and Dabney1999). A meta-analytic study showed that CCTV had a substantial anticipated effect on crime, with an overall reduction in crime of 21% in experimental compared with comparable control areas. CCTV was most effective in reducing crime in car parks, and most effective when combined with improved street lighting and targeted at vehicle crimes (Welsh and Farrington Reference Welsh and Farrington2009). Another study showed that CCTV caused a modest (16%) but significant reduction in crime in experimental areas compared with control areas. This decrease was mainly due to the installation of CCTVs in car parks, which caused a 51% decrease in crime (Welsh and Farrington Reference Welsh and Farrington2004). In England, a study by Tilley (Reference Tilley1993) covering Bradford, Lewisham, Coventry, Hartlepool, Hull and Wolverhampton showed strong evidence that schemes deploying CCTV have generally led to reductions in various categories of car crime. At the same time, there is not much evidence that the CCTV systems alone lead to reductions in vehicle-related crimes (Reid and Andresen Reference Reid and Andresen2014). A study performed in Glasgow showed that the number of crimes rose after the installation of CCTV cameras (Ditton and Short Reference Ditton and Short1999). This has been partly attributed to the increase in visibility of crimes caused by CCTV. Certain mechanisms of implementing CCTV surveillance along with other crime prevention measures may have an effect on vehicle crimes (Tilley Reference Tilley1993).
Focused police actions including patrolling can prevent crime and disorder in crime hot spots (Braga Reference Braga2005). Bike patrolling reduces the vehicle thefts in those areas (Barclay et al. Reference Barclay, Buckley, Brantingham, Brantingham and Whinn-Yates1996). Observable police patrolling has a significant deterrent effect on vehicle thefts (Di Tella and Schargrodsky Reference Di Tella and Schargrodsky2004). High crime prevention through environmental design, which includes proper lighting of the area, is also associated with lower victimization (Marzbali et al. Reference Marzbali, Abdullah, Razak and Tilaki2012). Results of a study proved that considerately positioned street lighting can reduce crime in that area (Painter Reference Painter1996). On the other hand, a study showed that improved street lighting did not reduce the number of reported crimes (Atkins, Husain, and Storey Reference Atkins, Husain and Storey1991).
A survey on the desired crime prevention strategies by the public showed that CCTV ranked third behind more police patrols and more or brighter street lights (Bennett and Gelsthorpe Reference Bennett and Gelsthorpe1996). In a study done to evaluate the effectiveness of various security measures it was found that presence of security guards in housing blocks was one of the most effective measures in preventing residential burglary while property marking, focused policing, neighbourhood watch and lighting were found to be less effective measures. Preventive measures like fencing, increased police patrolling and CCTV were found to be doubtful measures. At the same time, fencing, CCTV and focused policing were found to be effective measures in crime involving cars. Increased patrolling, lighting and forming residents’ associations were found to be less effective measures and neighbourhood watch a doubtful measure (Poyner Reference Poyner1993).
Weisel (Reference Weisel2002) reported “studies show that alarms, combined with other security devices, reduce burglaries. Burglars are less likely to gain entry when a house has two or more security devices (including window locks, dead bolts, security lights, and alarms)”. Other measures which Weisel (Reference Weisel2002) has suggested to prevent burglary after reviewing the research on the effectiveness of these measures are installing burglar alarms, installing CCTV, hardening targets, marking property, increasing occupancy indicators, creating safe havens, improving visibility, implementing neighbourhood watch programmes, modifying building codes, modifying community design, reducing traffic access and reducing house access.
RESEARCH METHODOLOGY
The Study Area
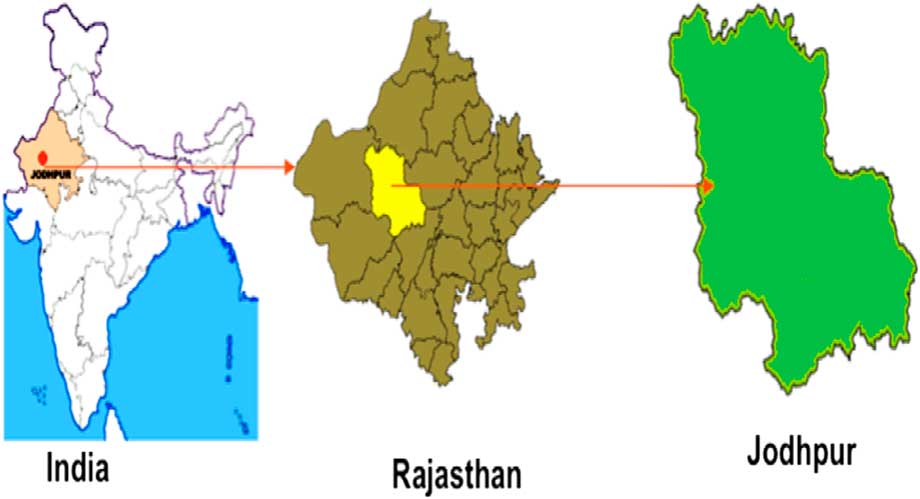
In Rajasthan, Jodhpur is the second largest city (see Figure 1). Jodhpur is a popular tourist destination, featuring many places, forts and temples set in the stark landscape of the Thar Desert. This district is situated at an altitude between 250 to 300 metres above sea level. The Jodhpur city area is divided into two zones (East Commissionerate and West Commissionerate) which have 12 police stations and 11 police stations, respectively.
Map Showing the Locations in India of Rajasthan and Jodhpur. For a colour figure, see the online version of the article

The study was conducted at eight police stations from both zones, i.e. Sardarpura, Chopasni Housing Board, Udai Mandir, Ratanada, Mahamandir, Shastri Nagar, Pratap Nagar and Basni police stations, where property crimes have occurred more in number.
Research Questions
(1) Which are the areas in Jodhpur where the crime rate in the cases of house breaking, motor vehicle theft and chain snatching is high?
(2) Which are the hot spot areas of property crimes?
(3) What are the demographics of the hot spot areas?
Objectives
(1) To make maps of police station areas where the crime rate in the cases of three types of property-related crimes (house breaking, auto theft and chain snatching) is high.
(2) To identify hot spot areas.
(3) To profile the locality of the hot spot areas.
Method of Data Collection
The data for the number of house breaking, auto theft and chain snatching crimes recorded in 2014 and 2015 in every police station of Jodhpur were collected from the East and West Commissionerate offices. Purposive sampling was done and the eight police stations were chosen because they had recorded the highest number of these types of property crimes. The locations of the spots where the crimes occurred were collected from the First Information Records from these police stations. Boundary area and raw map of the areas under the jurisdiction of each police station were also taken from the respective police stations. The researcher visited the hot spot areas and made observations about the demography of those areas. The data for crime analysis was collected from First Information Records supplemented in some cases by interviews of police officers. The researchers also visited the hot spot areas and made observations regarding the profile of those localities.
Data Analysis
Firstly, the researchers took the geospatial data in topographical sheet and Google maps satellite view and used software mapmaker 4.0 and ARCGIS 10.0. GPS (Global Positioning System) was used to collect the crime incidence data locations. GPS helped to collect the latitude and longitude positions of each particular crime point. Geocoding or address matching is the process of transforming tabular and geographic data, some non-spatial attributes or addresses in this study, to georeferencing spatial data. Since nearly all the crime incidents, except chain snatching, took place near roads and the geographic variables kept in the police records did not indicate the exact whereabouts of where the crime occurred, the centre point of a building block inevitably became the georeference point or the geocode of a crime location. The non-spatial data that are attribute data mainly collected from all police stations and crime branch offices were analysed using SPSS software.
RESULTS AND DISCUSSION
Crime Mapping
(1) Basni Police Station
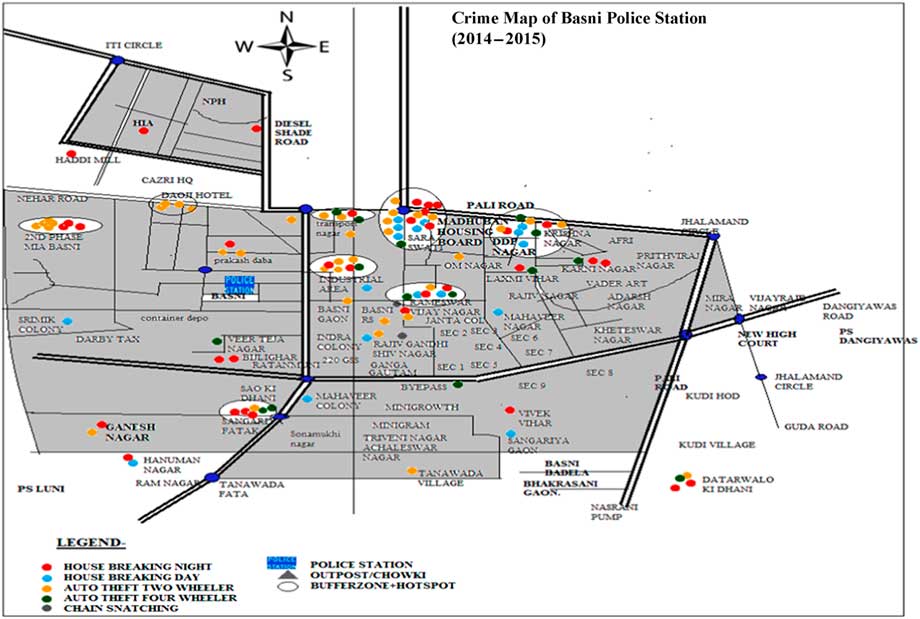
After studying the area of Basni Police Station, we found that Saraswati Nagar (a residential colony) witnessed the highest number of property crimes (see Figure 2). Other high crime areas include Madhuban housing board, Rameshwar Nagar and second-phase Basni, high in auto theft and house breaking crimes. Saraswati Nagar is a well-developed area and people of this area are well educated. In this area the neighbours almost do not know each other because most of the residents are migrants from outside the city. The Madhuban Housing Board also faces the same problem of neighbours not knowing each other. Most of the residents of this area are businessmen who often travel outside the city. The industrial area and transport nagar are mainly hot spots for auto theft and house breaking. There is a lack of proper security manpower and CCTV camera installation in these areas.
Crime Map of Basni Police Station (2014–2015). For a colour figure, see the online version of the article

(2) Chopasni Housing Board Police Station
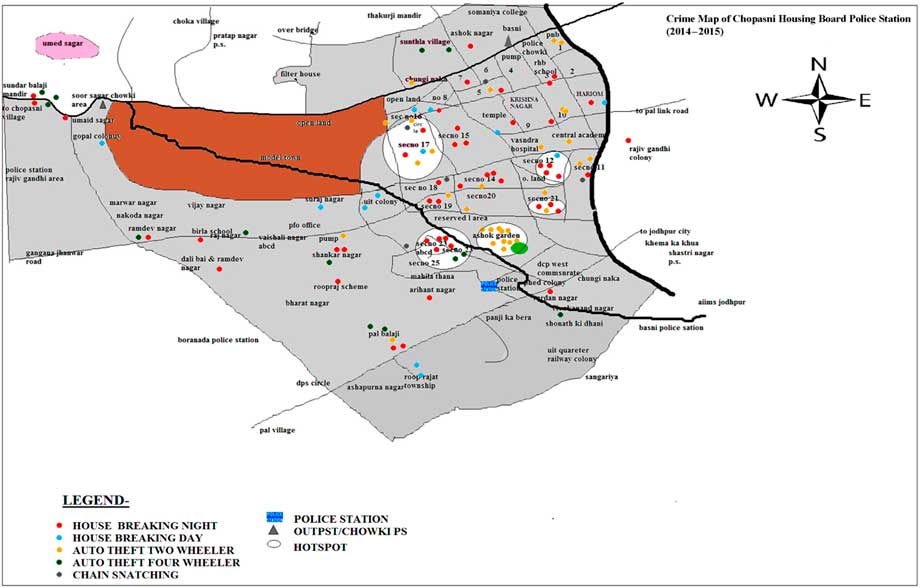
After making observations and interviewing police officers it was found that Ashok Garden witnessed the most number of auto thefts because of lack of security and surveillance systems (see Figure 3). Ashok Garden is only 200 metres from the main gate of the West Police Commissionerate Office. Sectors 17, 12, 23 and 21 are affluent areas. Residents do not know each other. Police patrolling is mainly done on the main highway and not along the inner streets of that particular area.
Crime Map of Chopasni Housing Board Police Station (2014–2015). For a colour figure, see the online version of the article

(3) Sardarpura Police Station
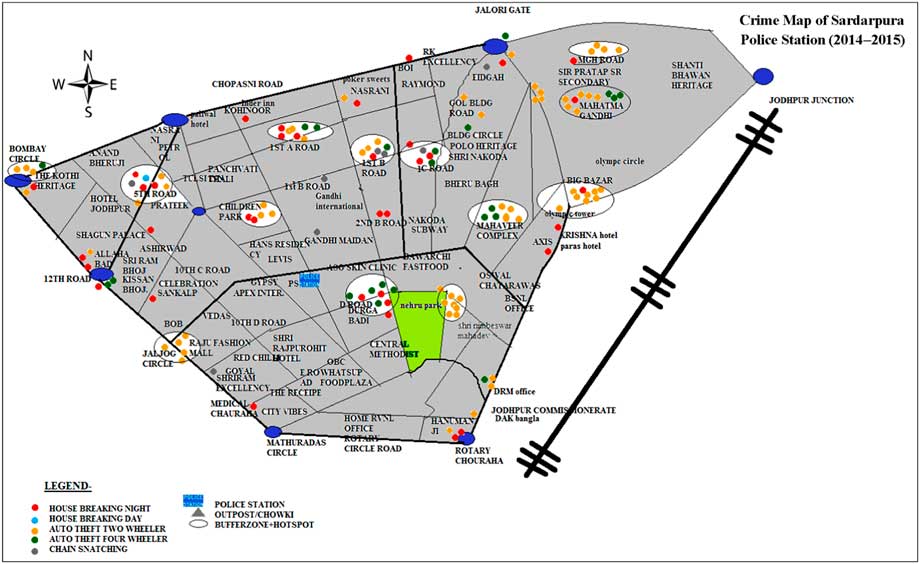
After studying the crime map of Sardarpura, we found that the number of auto thefts is very high near parking areas of Mahatma Gandhi Hospital. Areas near Nehru Park witnessed both house breaking and auto thefts. Big Bazaar (shopping complex) and Jaljog Circle areas were hot spots for vehicle thefts. In the Nehru Park area, there are no security guards and parking areas are not well planned. The problem is the same at Mahatma Gandhi Hospital and Big Bazaar. The crime of auto thefts is high because of lack of proper security arrangements like deployment of guards and proper checking. The other areas like 5th road, Sardarpura-C road and 1st B road are main markets of jewellery and electric and electronic appliances. It is a hot spot of house breaking and shoplifting. The 12th road and Jaljog Circle which are mainly famous for small hotels and restaurants on the main road are a hot spot for auto thefts. According to the police records, auto theft seems to be the most common occurring crime in this area (see Figure 4).
Crime Map of Sardarpura Police Station (2014–2015). For a colour figure, see the online version of the article

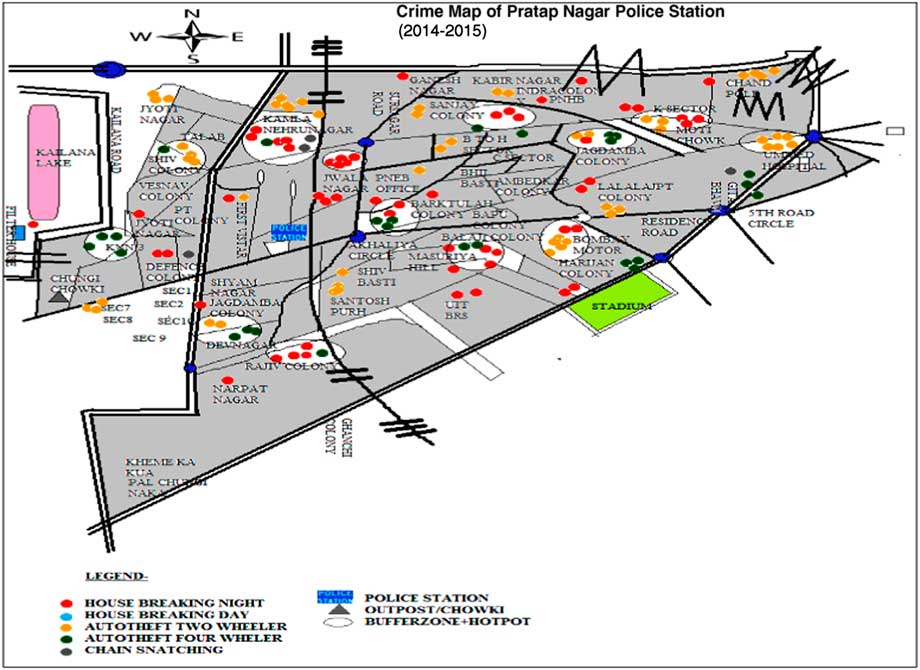
(4) Pratap Nagar Police Station
After studying the crime map of Pratap Nagar Police Station, it was seen that incidents of house breaking took place all over the area (see Figure 5). Rajiv Colony and Jwala Nagar, which are both affluent residential areas, are hot spots of house breaking. Most of the areas have proper lighting but this is not useful as other crime prevention measures like the presence of security guards and CCTVs were missing. The Ummed Hospital area is a hot spot for auto vehicle thefts.
Crime Map of Pratap Nagar Police Station (2014–2015). For a colour figure, see the online version of the article

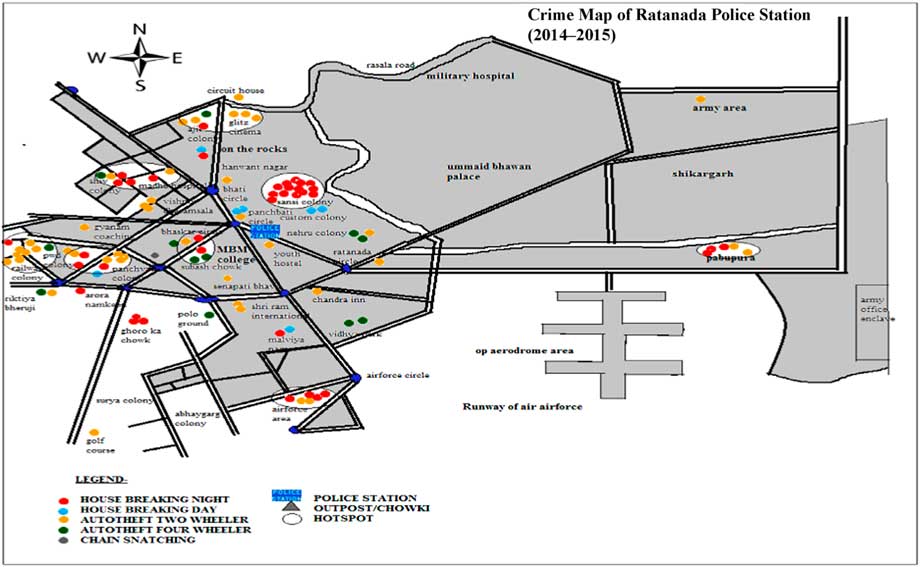
(5) Ratanada Police Station
The Ratanada Police Station area has many three-star and five-star hotels. It also contains air force and military deployment quarters. In this area, Sansi Colony is a hot spot area of house breaking crimes (see Figure 6). This colony is a slum area and it is also infamous for the illegal production of home-made alcohol. The Railway Colony Hospital area is a hot spot for auto thefts and house breaking. Glitz Cinema Hall and National Handloom (a shopping complex where all household items can be purchased), which are famous places for shopping, are also hot spots of auto thefts. There is also lack of a proper parking area in these areas as most of the vehicles are parked on the roads around the shopping areas. Surprisingly, the quarters of the people who keep India secure, i.e. the air force quarters, also witnessed a lot of house breaking during their vacations because of lack of security measures in that area. The quarters were not properly fenced and patrolling was also not conducted in that area.
Crime Map of Ratanada Police Station (2014–2015). For a colour figure, see the online version of the article

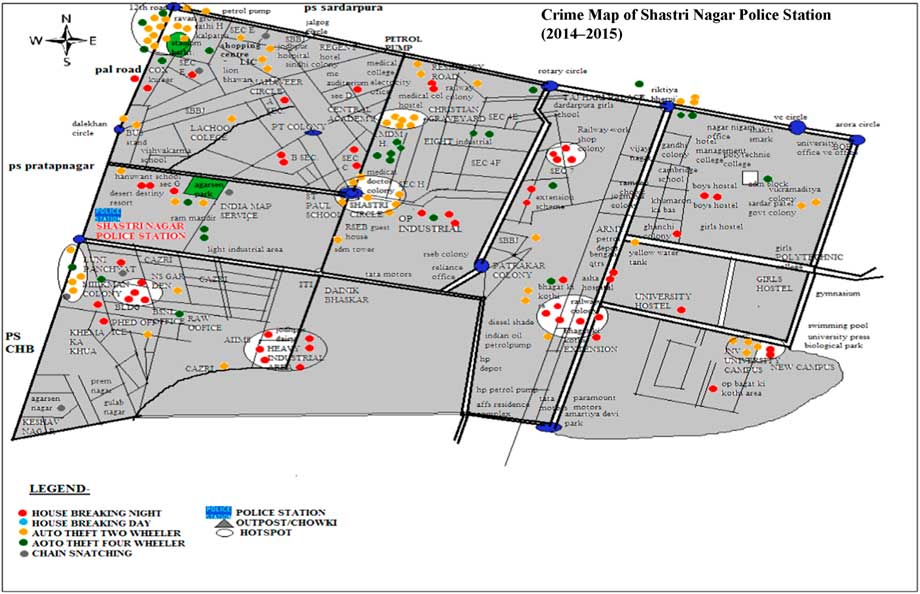
(6) Shastri Nagar Police Station
Studying the crime map of Shastri Nagar Police Station, we found that house breaking and auto thefts took place all over the area (see Figure 7). It is one of the largest police jurisdiction areas in Jodhpur. The main hot spots are near Rawan Ka Chabutra (playground) and Barkatullah Khan Stadium parking areas. Many ceremonies and festivals are conducted in this area. There is lack of security measures like proper walls and gates in this area. Parking is also not done in a proper manner by the public, as the vehicles are parked all over the playground and all around the stadium. The same problem also exists at Mathura Das Hospital as proper checking is not done by the private security guards. The heavy industrial area reported thefts of metals like wire, air conditioners, iron material, machines, etc. as only two guards were deployed and CCTV cameras were not installed inside these factories.
Crime Map of Shastri Nagar Police Station (2014–2015). For a colour figure, see the online version of the article

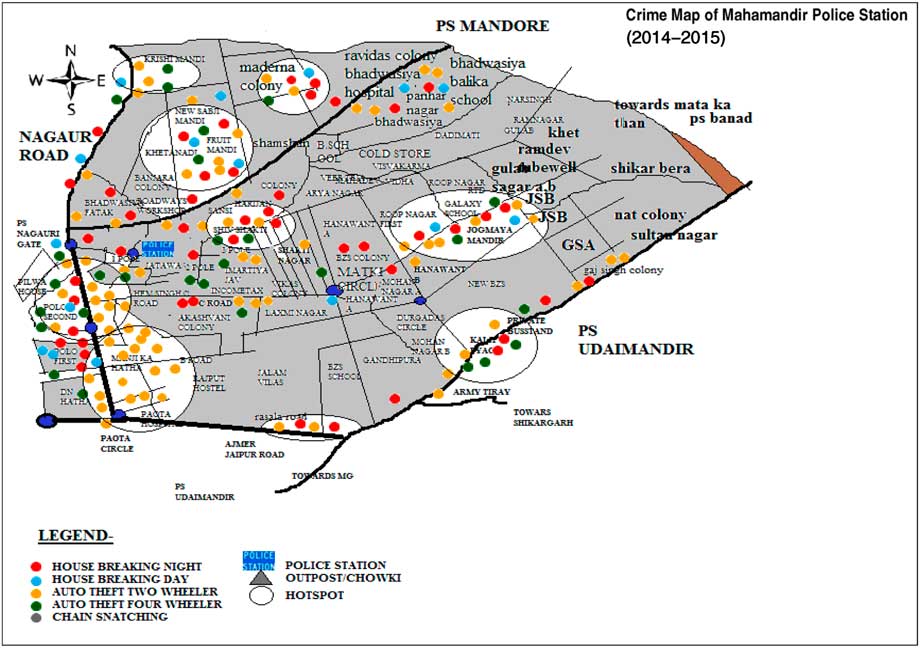
(7) Mahamandir Police Station
The area of Mahamandir Police Station is situated near the Nagaur Highway (see Figure 8). The area includes government employee quarters, private residences and commercial markets. Even though there is proper lighting on this Nagaur Highway, it is still a hot spot for auto thefts because of the carelessness of vehicle owners as they do not park their vehicles in proper parking areas.
Crime Map of Mahamandir Police Station (2014–2015). For a colour figure, see the online version of the article

(8) Udai Mandir Police Station
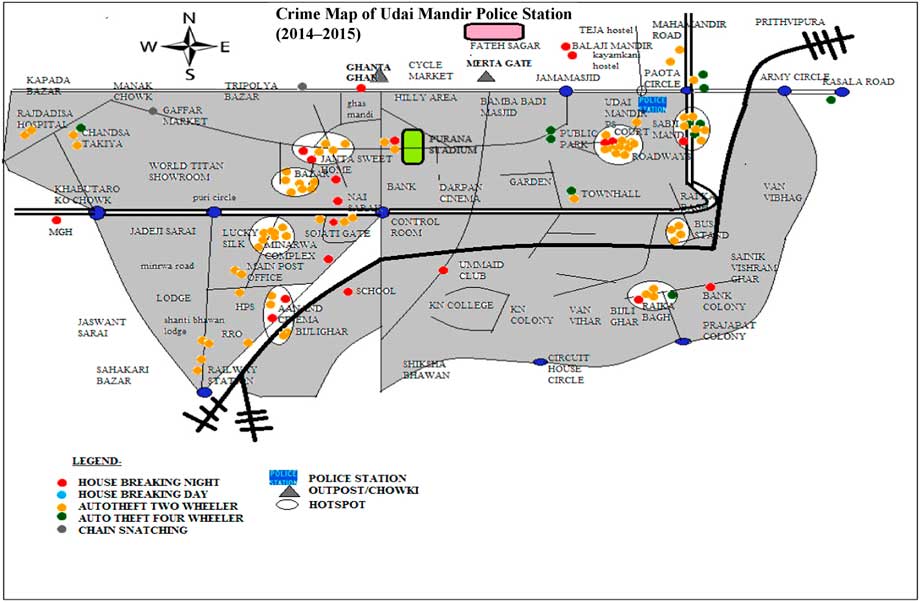
The Udai Mandir Police Station covers a small area as compared with other police stations in Jodhpur city. The occurrence of house breaking is considerably less because it is a small area and proper patrolling is done by police officers (see Figure 9). Sabji Mandi, a wholesaler fruit and vegetable market, and the public parking area which is located at the back side of Jodhpur high courts witnessed high rates of auto vehicle thefts because of a lack of security arrangements and improper parking.
Crime Map of Udai Mandir Police Station (2014–2015). For a colour figure, see the online version of the article

Crime Analysis of House Breaking Crimes and Motor Vehicles Thefts
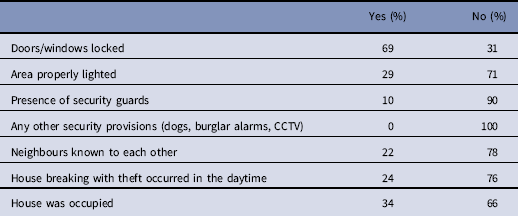
Based on the theories of environmental criminology and the review of literature, 100 cases of house breaking were analysed in order to assess the situation and the place of the commission of crime. The results are given in Table 1.
Cases of House Breaking

CCTV, closed-circuit television.
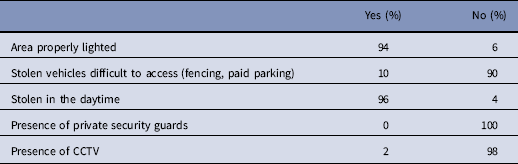
Similarly, 100 cases of motor vehicle thefts were analysed in order to assess the situation and the place of the commission of crime. The results are given in Table 2.
Cases of Motor Vehicle Thefts

CCTV, closed-circuit television.
The police station jurisdictions which had high number of property crimes also showed the following results:
(1) Rate of accused arrested was low (less than 35%);
(2) Frequency of patrolling was not satisfactory at the time of incident (according to the residents);
(3) Staff of police station was lower than the sanctioned strength;
(4) Most of the hot spots were densely populated areas;
(5) Most of these police station jurisdictions which reported a high number of these crimes had a huge population of unemployed youth, drug addicts, gypsies, slum dwellers, habitual offenders, etc.
Summary of the Findings
The crime maps of areas under the jurisdiction of various police stations show that the hot spots in most cases for auto thefts were public places like hospitals, public parking spaces, parks, parking areas near playgrounds, etc. Auto thefts also took place near shopping malls and commercial markets. The profile of hot spots of house breaking was varied, ranging from affluent areas to slum colonies and isolated factories and dwellings to densely populated areas. There were no particular hot spots for chain snatching. One surprising point was observed that many hot spots were located very near to the police stations which may be attributed to the police being complacent during patrolling in those areas.
After reviewing the overall characteristics of the hot spots of burglary or house breaking it was found that the hot spots were either industrial areas or semi-commercial areas (areas where both residential dwellings and infrastructure existed), socially disorganized areas or areas where there was no solidarity amongst the residents/neighbours living there. Government quarters were also targeted by the offenders as these quarters were not permanent residences and would often remain unoccupied during festival seasons, as the occupants would visit their home towns. Most of the houses located in the hot spots also lacked territorial marking like walls or fences. These housing areas also lacked other security or preventive mechanisms like CCTV, security guards, burglar alarms, proper lighting, etc.
While reviewing the hot spots of auto thefts or motor vehicles, it was found that the hot spots were generally temporary parking areas around public places like shopping markets, hospitals, parks, etc. These parking areas did not have adequate security measures like security guards, barriers/gates and CCTVs. Also most of the motor vehicle thefts occurred during the day time when police patrolling was minimal.
In consonance with the findings of other previous studies (Brantingham and Brantingham Reference Brantingham and Brantingham1982; Henry and Bryan Reference Henry and Bryan2000), many of hot spots of burglary and motor vehicle theft were located at commercial areas or near them. As pointed out by another study (Clarke and Mayhew Reference Clarke and Mayhew1994), many hot spots of auto thefts were temporary parking areas. As in other previous studies, the hot spots of auto thefts showed absence of CCTVs in those places but at the same time other security measures like guards, alarms, etc. were also missing; therefore, further analysis needs to be done to find out the exact effect of CCTV on crimes.
Recommendations
Security measures should be increased at these hot spots. Security around areas, especially around public places like hospitals, parks/gardens, etc., should be increased with focus on parking areas and as a previous study showed that presence of guards have a deterrent effect on offenders (Hannan Reference Hannan1982), there should be deployment of private security staff. Paid or secure parking areas should be increased as there were very few paid parking areas in the city. There is a lack of apartments and housing societies (residential areas which are governed by certain rules and regulations made by the residents) along with territorial marking in Jodhpur as most of the residential houses are not organized as formal societies. Hiring of private security guards is a rare occurrence in most of these localities. As previous studies (Poyner Reference Poyner1993) showed that the presence of private security guards was one of the most effective crime prevention measures, localities should employ private security guards or implement neighbourhood watch in order to prevent crime. Neighbourhoods could increase communication amongst their members, so that the entry of outsiders would be noticed easily. As the findings of this study and another study (Brown and Altman Reference Brown and Altman1982) showed that burgled homes were lacking in territorial markers like walls and fences, territorial markers including walls and gates around residential areas should be built. As previous studies (Barclay et al. Reference Barclay, Buckley, Brantingham, Brantingham and Whinn-Yates1996; Braga Reference Braga2005) showed that patrolling can reduce crime, the police should conduct patrolling more frequently and in a more systematic manner. Most auto vehicle thefts occurred during the day as there was much less patrolling during the day time. Tenant verification should be done properly by landlords and house owners. Social welfare policies should be conducted and counselling of youth should be done in these areas.
Hence this crime mapping and crime analysis of various police stations of Jodhpur may be used by the municipalities in order to bring some changes in the landscape as well as the police to increase patrolling and community policing in those areas.
Swikar Lama is an Assistant Professor in Criminology and Police Studies at Sardar Patel University of Police, Security and Criminal Justice, Jodhpur.
Sikandar Singh Rathore is a former Master of Arts student in Applied Criminology, Sardar Patel University of Police, Security and Criminal Justice, Jodhpur.