Introduction
The life history of an individual is defined by traits that describe its growth, reproduction, and survivorship. These traits, in turn, are affected by an individual’s biotic and abiotic environment (i.e., temperature, humidity, food availability, and the presence of competitors or predators). Interpreting the ecology, evolution, or behaviour of a species requires knowledge of its life history. Yet, for many organisms detailed life-history accounts are lacking.
Here, we report phenology and life-history data for two species of funnel weavers (Araneae: Agelenidae): the hobo spider Eratigena agrestis (Walckenaer) (formerly Tegenaria agrestis; Bolzern et al., Reference Bolzern, Burckhardt and Hänggi2013) and the giant house spider Eratigena atrica (Koch) (formerly Tegenaria duellica; Bolzern et al., Reference Bolzern, Burckhardt and Hänggi2013), with a focus on E. agrestis. These two congeneric species were introduced to the coastal Pacific Northwest of North America from Europe a century ago (Crawford and Vest Reference Crawford and Vest1989). Their range has since expanded across this region into a variety of habitats (Vetter et al. Reference Vetter, Roe, Bennett, Baird, Royce and Lanier2003). Eratigena atrica, in particular, is often found near or inside houses in its introduced range. Because specimens of both species are relatively large, brown, and highly mobile, they are regularly misidentified as brown recluse spiders, Loxosceles reclusa (Gertsch and Mulaik) (Araneae: Sicariidae) (Bennett and Vetter Reference Bennett and Vetter2004). Reports that E. agrestis bites can cause necrotic lesions have resulted in negative perception by the public, despite being unsubstantiated (McKeown et al. Reference McKeown, Vetter and Hendrickson2014). It is of interest to better understand the life cycle and life history of these spiders in the wild, both for their potential management and to inform further, more detailed, studies of their ecology and behaviour.
We recorded life-history traits of E. agrestis and E. atrica in natural habitats in southern British Columbia, Canada. We surveyed two sites to assess variations in life history among populations of the two study species. The two study sites feature marked differences in the relative abundance of the two species, and of a third native species that overlaps strongly in habitat use: the western black widow spider, Latrodectus hesperus Chamberlin and Ivie (Araneae: Theridiidae). Comparisons across study sites offer insight as to how varying heterospecific interactions and predation pressures may affect life history. The life-history data we present for these introduced species are a critical first step in understanding the impact they may have on native arthropod communities.
Methods
Study sites
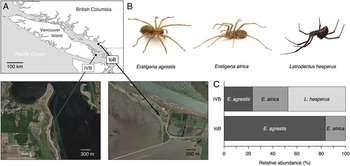
We studied populations of E. agrestis and E. atrica at two field sites separated by ~ 60 km in southern coastal British Columbia, Canada. The first site (48°34'58'N, 123°22'20'W; elevation: 3–4 m) was located at Island View Beach on the Saanich peninsula of southern Vancouver Island. The second site (49°13'11'N, 123°12'53'W; elevation: 0.5 m) was located at Iona Beach Regional Park on the mainland, in the Greater Vancouver Regional District (Fig. 1A–B). Both field sites are sand-dune habitats featuring open sandy areas interspersed with logs of driftwood. Eratigena agrestis and E. atrica commonly build their funnel-sheet webs beneath these logs. Both E. agrestis and E. atrica are abundant at Island View Beach, but E. agrestis predominates at Iona Beach (Fig. 1C). Latrodectus hesperus also builds cobwebs under driftwood logs at Island View Beach and can prey upon adults and juveniles of both Eratigena species (Salomon Reference Salomon2011).
(A) Map of the southern coast of British Columbia, Canada, with the locations of the field sites: Iona Beach and Island View Beach. (B) Images of female Eratigena agrestis, Eratigena atrica, and Latrodectus hesperus. (C) Relative abundance of E. agrestis, E. atrica, and L. hesperus spiders under driftwood logs at each site. Relative abundance is based on all spiders found between May 2005 and October 2006 at Island View Beach, and between May 2006 and April 2007 at Iona Beach. Black and white map from SimpleMappr (Shorthouse Reference Shorthouse2010); Island View Beach (IVB) map imagery © Google 2015; Iona Beach (IoB) map imagery © Google 2014; spider photographs from Sean McCann.

At both study sites, the sparse vegetation between logs consists of grasses, sedges, herbs, and dwarf shrubs. Predominant plant species at Island View Beach are Abronia latifolia Eschscholtz (Nyctaginaceae), Ambrosia chamissonis (Lessing) Greene (Asteraceae), Carex macrocephala Willdenow ex Sprengel (Cyperaceae), Convolvulus soldanella Linnaeus (Convolvulaceae), Festuca rubra Linnaeus (Poaceae), Grindelia integrifolia Candolle (Asteraceae), Linaria genistifolia dalmatica (Linnaeus) Maire and Petitmengin (Plantaginaceae), Lomatium nudicaule (Pursh) Coulter and Rose (Apiaceae), Poa Linnaeus (Poaceae) species, Polygonum paronychia Chamisso and Schlechtendal (Polygonaceae), and Rumex acetosella Linnaeus (Polygonaceae). Predominant plant species at Iona Beach are Carex macrocephala, Elymus Linnaeus (Poaceae) species, Lathyrus japonicas Willdenow (Fabaceae), Poa species, and Rumex acetosella, with patches of the moss Racomitrium canescens (Hedwig) Bridel (Grimmiaceae). Both sites are relatively windy, and are susceptible to flooding during winter storms, and to disturbance by humans.
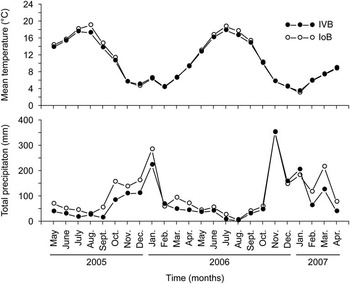
Annual temperature profiles of Island View Beach and Iona Beach were similar over the course of the surveys at each site (Fig. 2), based on data from weather stations located within 6 km of each site at similar elevations (Environment Canada 2015). In 2006, the highest average monthly temperatures were 17.8 °C and 18.7 °C (in July) for Island View Beach and Iona Beach, respectively, and the lowest average monthly temperatures were 4.4 °C (in February and December) and 4.3 °C (in February) for Island View Beach and Iona Beach, respectively. Iona Beach received slightly more precipitation over the course of the study period (1199 mm) than Island View Beach (883.3 mm).
Mean temperature (°C) and total precipitation (mm) between May 2005 and April 2007 at Island View Beach (IVB) (Vancouver Island) and Iona Beach (IoB) (Greater Vancouver Regional District). Data were obtained from Environment Canada weather stations at the Vancouver International Airport and the Victoria International Airport, each situated <6 km from the relevant study site.

Survey protocol
For one year at both study sites, we conducted monthly surveys of driftwood logs to document ecological and life-history traits of E. agrestis and E. atrica. At each site, we followed spider populations within study areas that were comparable in size and microhabitat characteristics (Table 1). Logistical constraints limited our survey to one year per site. At Island View Beach, we surveyed from May 2005 to April 2006, at which point a major disturbance by vehicles compromised the integrity of the habitat and forced us to terminate the study. At Iona Beach, we surveyed from May 2006 to April 2007. In January 2007, an extensive and persistent snow cover prevented a survey of the Iona Beach site. The comparison among sites, therefore, is based on the assumption that the data reflect general annual patterns at each location (Fig. 2).
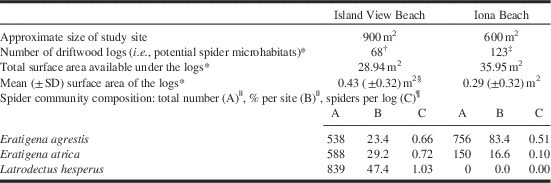
Summary of ecological characteristics of the study sites at Island View Beach and Iona Beach Regional Park (British Columbia, Canada).

* At the onset of the study.
† Two logs went missing, 14 were moved to new locations.
‡ Eight logs went missing, five were moved to new locations.
§ The mean surface area under a log was significantly greater at Island View Beach than at Iona Beach (Wilcoxon’s rank sum test: W=5744, P<0.0001).
|| Total number of individuals and % of the overall number of spiders per site over the survey period.
¶ Average number of spiders per log over the survey period.
At each site, we measured the length and width of each log to assess the space available underneath. We turned over all logs that were at least 0.30 m long and detached from the ground substrate, and surveyed these logs for the presence of spiders. This length represents the minimum log length used by E. agrestis, E. atrica, and L. hesperus (Salomon et al. Reference Salomon, Vibert and Bennett2010). At both sites, park visitors occasionally disturbed logs. These minor disturbances were typically restricted to only one or two logs. When logs were disturbed, we returned the affected logs to their original position, unless spiders had colonised the new underside. In the latter case, we surveyed the logs in their new position.
Variables measured
On each survey date and for each log, we recorded the following variables: (1) numbers of E. agrestis and E. atrica, (2) sex and age class of each individual (juvenile, sub-adult (i.e., penultimate instar), adult), (3) size (total body length) of each individual, (4) number of egg sacs, and (5) number of webs. We also recorded the number of L. hesperus and their cobwebs present under the logs. In spiders, total body length is an index of both age and feeding history (Toft and Wise Reference Toft and Wise1999; Uetz et al. Reference Uetz, Papke and Kilinc2002b). Using a glass vial, we carefully picked up each spider and measured total body length with calipers (the distance from the chelicerae to the tip of the abdomen) to the nearest 0.1 mm. We then returned the spiders to the exact locations under the logs where we had originally found them. We identified all juveniles to species level based on somatic characters (Vetter and Antonelli Reference Vetter and Antonelli2002). To reliably compare growth patterns of juveniles across species and field sites, we grouped measurements of spiderlings into five size categories: 1 (2–4 mm), 2 (4–6 mm), 3 (6–8 mm), 4 (8–10 mm), and 5 (>10 mm). We confirmed the accuracy of species identifications by collecting 63 juveniles at Iona Beach and by rearing them to adulthood in the laboratory. Voucher specimens have been deposited at the Royal British Columbia Museum (Victoria, British Columbia, Canada).
We collected 71 E. agrestis egg sacs at Island View Beach in December 2005 to determine (i) the number of eggs in each sac, (ii) the timing of emergence, and (iii) the number of moults before the spiders reached adulthood. We focussed on E. agrestis because E. atrica egg sacs were not available at the same time in the season. In a pilot study, we brought a dozen freshly deposited egg sacs indoors in September. Three months later no spiderlings had emerged from any of the sacs. This led us to suspect that E. agrestis egg sacs require an overwintering diapause. To maximise the chance of achieving hatching success, we randomly assigned each of the 71 egg sacs to one of two treatments. In the first treatment, we housed egg sacs outdoors until mid-February 2006, after which average temperatures increase (Fig. 2), and then moved them into a temperature-controlled growth chamber. There, we gradually increased the temperature over the course of 10 days from 10 °C to 22 °C, in increments of 2 °C every two days. We changed night temperature in the same manner, but from 5 °C to 16 °C. In the second treatment, we kept egg sacs outdoors until spiderlings emerged. This allowed us to determine when emergence would occur under natural conditions. We monitored both treatment groups daily until emergence occurred, recording the date of emergence and the number of spiderlings for each egg sac. Immediately upon emergence, we randomly selected four spiderlings per egg sac and placed each one into its own plastic Petri dish (60×10 mm; n=120). In two instances, the brood selected consisted of only three spiderlings, in which case we selected all three. Three times per week, we provided water and a diet of vinegar flies (Drosophila melanogaster Meigen, Diptera: Drosophilidae), house flies (Musca domestica Linnaeus, Diptera: Muscidae), house crickets (Acheta domesticus (Linnaeus), Orthoptera: Gryllidae), and yellow mealworms (Tenebrio molitor Linnaeus, Coleoptera: Tenebrionidae), and noted the date of each spider moult. We retained all laboratory-reared spiders for use in experiments.
Two days after E. agrestis spiderlings first started to emerge in the laboratory, we transferred each brood to a separate Petri dish (150×25 mm). Each brood was large and mobile, making it difficult to count the number of spiderlings. To ensure data accuracy, we counted each brood three times and calculated the mean number of spiderlings in each brood.
We compared the total body length of adult E. agrestis females across field sites (at least 10 females per site) in September, October, November, and December. We could not assess reproductive rate for either species because it was not possible to associate egg sacs with specific females in the field, and because females did not produce egg sacs under laboratory conditions. We measured the longevity of laboratory-reared individuals that survived to maturity. We performed all data analyses in R 3.2.0 (R Core Team 2015).
Results
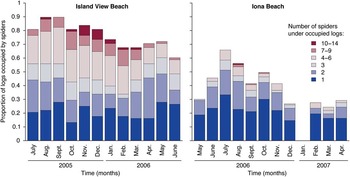
Over the 12-month survey period at each site, we observed a total of 756 E. agrestis, 150 E. atrica, and 0 L. hesperus spiders underneath 123 logs at Iona Beach, and a total of 538 E. agrestis, 588 E. atrica, and 839 L. hesperus spiders underneath 68 logs at Island View Beach. Consequently, the proportions and population densities of the three study species differ among sites (Fig. 1C; Table 1). The proportion of logs occupied by any of the three focal species was significantly higher at Island View Beach than Iona Beach (Fig. 3). Across sampling months, the mean (±standard deviation) proportion of logs occupied by spiders was 0.76±0.09 at Island View Beach and 0.40±0.14 at Iona Beach (χ2=22, df=1, P<0.0001). Of those logs that were occupied, the number of spiders cohabiting under them also differed between the two sites. At Iona Beach, the majority of occupied logs (56±8%) was occupied by only one spider, whereas only 28±8% of occupied logs at Island View Beach had only one spider under them (χ2=18, df=1, P<0.0001). At Island View Beach, 49±10% of occupied logs were occupied by three or more spiders, whereas only 16±6% of those at Iona Beach were occupied by three or more spiders (χ2=22, df=1, P<0.0001). The maximum number of spiders found cohabiting under single logs was also greater at Island View Beach (up to 14 cohabiting spiders) than at Iona Beach (up to 10 cohabiting spiders). The mean (and median) maximum number of cohabiting spiders across monthly surveys was 10 at Island View Beach, compared with a mean (and median) of six at Iona Beach. The total area available under logs was similar at both sites, but the mean area under each log was significantly greater at Island View Beach (Table 1). At both sites, the size of occupied logs was greater than that of unoccupied logs (Island View Beach: W=66, P=0.01; Iona Beach: W=632, P<0.0001; data for August only – the middle of the mating season when occupancy is relatively high at both sites). At Island View Beach, the mean (±standard deviation) area under logs was 0.46±0.33 m2 for occupied logs (n=61) and 0.18±0.11 m2 for unoccupied logs (n=7), and at Iona Beach the mean area under logs was 0.42±0.37 m2 for occupied logs (n=69) and 0.13±0.14 m2 for unoccupied logs (n=54).
Log occupancy data for Island View Beach and Iona Beach. Bars show the proportion of logs that were occupied by spiders (combined data for all three focal species: Eratigena agrestis, Eratigena atrica, and Latrodectus hesperus). Coloured sections of bars indicate the proportion of occupied logs with a given number of spiders cohabiting beneath them.

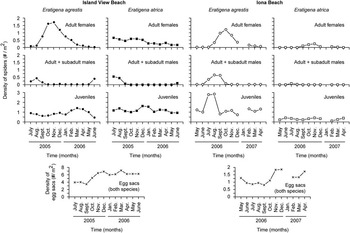
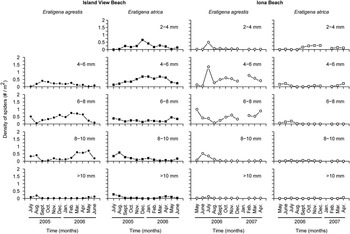
The egg-laying season of E. agrestis and E. atrica overlapped, beginning in late August/September and lasting for three months (Fig. 4). Notably, the density of egg sacs doubled at both sites between September and December (Fig. 5). In the field, E. atrica spiderlings emerged in the fall, whereas those of E. agrestis emerged in the spring. At Iona Beach, second-instar (i.e., just emerged) E. atrica spiderlings were present in large numbers from September to December, whereas second-instar E. agrestis spiderlings were present almost exclusively in July. At Island View Beach, the number of second-instar E. atrica spiderlings (2–4 mm size category) began to increase in September and peaked in December (Fig. 6). Comparable data for second-instar E. agrestis spiderlings at Island View Beach are not available due to uncertainties in the identification of small specimens during the first month of study at Island View Beach. By the time we conducted the phenology survey at Iona Beach, we were able to distinguish E. agrestis spiderlings from those of E. atrica. It is important to note that these data represent densities of only those spiders that we successfully detected and captured. We may have failed to detect spiders because they were hidden from view in deep crevices within logs, or because they moved into deep crevices or the surrounding vegetation when we first flipped logs over, or else because they were located in nearby vegetation rather than under logs (especially likely for small juveniles after dispersal). As detection probability increases with size, we almost certainly underestimated the numbers of small juveniles compared with larger size classes.
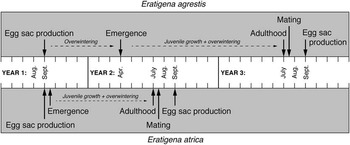
Life cycles of Eratigena agrestis and of Eratigena atrica at Island View Beach and Iona Beach. Each tick on the scales represents a month. Each arrow indicates the month in which the associated event begins to occur in the field.

Phenology of Eratigena agrestis and Eratigena atrica at Island View Beach and Iona Beach. The graphs represent the densities (numbers of individuals per m2 of available habitat, i.e., driftwood logs) of juveniles, adult females, sub-adult and adult males, and the number of egg sacs for both species and field site. Note that the y-axis scales differ across graphs. Data were collected between July 2005 and June 2006 at Island View Beach, and between May 2006 and April 2007 at Iona Beach. The egg sacs spun by E. agrestis and E. atrica are very similar and could not be identified to species level.

Changes over time in population densities of Eratigena agrestis and Eratigena atrica juveniles of different sizes at Island View Beach and Iona Beach. The total body length of all juveniles was assigned to one of five size categories (1: 2–4 mm; 2: 4–6 mm; 3: 6–8 mm; 4: 8–10 mm; 5: >10 mm). Data were collected between July 2005 and June 2006 at Island View Beach, and between May 2006 and April 2007 at Iona Beach.

Data from the E. agrestis egg sacs we collected at Island View Beach and reared in the laboratory showed differences in emergence date based on our treatments. Egg sacs that were kept outdoors had spiderling emergence between 31 May and 12 June (i.e., greater than five months after collection). Of the 38 eggs sacs we first kept outdoors and then moved indoors, spiderlings emerged from 26 sacs between 17 and 20 March, which is less than four months after collection and one month after we had moved them indoors. The contrasting emergence times of spiderlings in these two treatment groups implies that emergence is mediated, at least in part, by ambient temperature.
A mean (±standard deviation) of 64.73±24.76 (range: 17–124) E. agrestis spiderlings emerged from the egg sacs reared indoors. A mean of 60.52±26.70 (range: 2–115) spiderlings emerged from the egg sacs left outdoors.
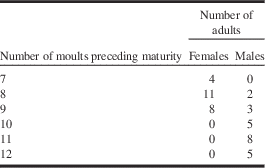
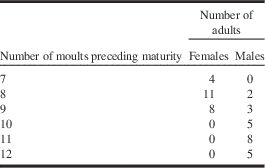
We monitored moulting patterns for the 120 E. agrestis spiderlings that we housed singly immediately after emergence from the egg sac. The first moult took place within the egg sac after hatching and before emergence. Males matured after 8–12 moults and females after 7–9 moults (Table 2). A total of 23 males reached maturity, between July 2006 and April 2007. Unexpectedly, males generally underwent more moults than females before maturing. These unusual results may be due to rearing conditions in the laboratory. Many males died before maturing, and we speculate that a sub-optimal diet was responsible for this (other studies have also reported this, e.g., Toft and Wise Reference Toft and Wise1999). Furthermore, it is conceivable that only especially slow-growing males were able to survive to maturity in the laboratory. Similarly, the 23 females that reached maturity in the laboratory in July and August 2006 may also have been growing under unusual laboratory conditions. Indeed, only a subset of females was able to mature, and did so faster than is typical in the field. The mean (±standard deviation) longevity of laboratory-reared spiders (n=17 for each sex) that survived to maturity was 274±83 days for males (range: 133–399 days), and 226±52 days for females (range: 156–300 days).
Number of moults preceding maturity in laboratory-reared Eratigena agrestis individuals collected from Island View Beach (British Columbia, Canada).
The developmental data of spiderlings are summarised in Figures 5 and 6. For E. atrica at Island View Beach, most size-1 spiderlings (2–4 mm) were present in December, indicating that they emerged the previous month (Fig. 5). Most size-2 (4–6 mm) juveniles were present from December to April (Fig. 6). Spiderlings in the larger size categories 3 (6–8 mm), 4 (8–10 mm), and 5 (>10 mm) were present mainly from May to July, suggesting that they reach maturity after July. At Iona Beach, E. atrica spiderlings were much less abundant but their phenology in general resembled that observed at Island View Beach.
For E. agrestis at Island View Beach, the density of spiders in the 4–6, 6–8, and 8–10 mm size categories peaked in September, from December to April, and from March to May, respectively (Fig. 6). After May, most spiders presumably reached maturity. Phenology data of E. agrestis at Iona Beach and Island View Beach are highly comparable (Figs. 5–6). These data show that (i) size-1 juveniles (size 2–4 mm) peaked in frequency in July (indicative of emergence the previous month), (ii) size-2 (4–6 mm) spiderlings were most prevalent over the winter months, (iii) size-3 (6–8 mm) juveniles peaked in frequency through April and May, (iv) size-4 (8–10 mm) spiderlings were found in the spring and early summer, and (v) mature spiders were present thereafter (Figs. 5–6).
At both field sites, E. agrestis males seemed to mature before conspecific females (Fig. 4). While we first observed adult E. agrestis males in July, with peak abundance in August, adult females first appeared in August and reached their greatest abundance in October. By then, the number of adult E. agrestis males had already declined substantially. At Island View Beach and Iona Beach, the number of adult E. atrica males peaked in July, then declined sharply. At Iona Beach, E. atrica females started maturing in August, with the highest numbers observed in October and November. Strangely, we did not observe a similar pattern at Island View Beach. There, from a peak abundance observed in July, the number of adult females tapered slowly throughout the following months.
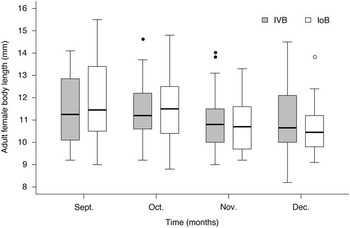
Box plots comparing the body size of adult E. agrestis females collected from September to December (the only months where there were at least 10 adult females at both sites) revealed no body size differences between individuals from different field sites (Fig. 7).
Body length (mm) of adult Eratigena agrestis females at Island View Beach (IVB) and Iona Beach (IoB). The boxes depict the median, first, and third quartiles. The whiskers represent the lowest and highest datum within the 1.5 interquartile range of the lower and upper quartile. Data were collected in 2005 at Island View Beach and in 2006 at Iona Beach.

Discussion
Overall, our phenological study of the two closely related funnel weavers Eratigena agrestis and E. atrica in their natural habitat revealed that their life histories are similar except that spiderlings from each species emerge in different seasons. We also observed strong consistency in life-history traits across the two field sites. Below, we discuss the implications of these results and suggest avenues for future research.
Life cycles of Eratigena agrestis versus Eratigena atrica
The two study species differ in that E. agrestis has a biennial life cycle, whereas E. atrica has an annual life cycle. Despite their different life-history trajectories, the timing of many events is similar for both species. The mating seasons take place in late summer and early fall, with the first adult males appearing in July. Male abundance peaks in August and then declines rapidly as mature adult males stop feeding. Eggs sacs are produced from September to November. In both species, there is an intriguing mismatch between the time when females mature and when adult males are present: the maximum number of adult females is reached only following the decline of male numbers. This pattern may be consistent with a mating system in which females mate only once and males exhibit a strong preference for virgin females (Stoltz et al. Reference Stoltz, McNeil and Andrade2007), and/or a system in which there is first-male sperm precedence. Males may also guard sub-adult females, as in some thomisid (Dodson and Beck Reference Dodson and Beck1993) and araneid spiders (Fahey and Elgar Reference Fahey and Elgar1997). A detailed analysis of the mating behaviours of each species during the peak mating season would reveal which of these male behaviours is most prevalent. Furthermore, the fact that females mature late in the season raises the possibility that they may reproduce only during the mating season of the following year, provided they survive the winter.
The major difference in life cycle between the two species concerns the timing of spiderling emergence and juvenile growth. Eratigena atrica spiderlings emerge from egg sacs deposited in early autumn after only a few weeks, whereas E. agrestis spiderlings overwinter in egg sacs and emerge during the spring. This means that most E. agrestis juveniles mature the following year. However, we were able to rear E. agrestis to maturity in just one summer in the laboratory, suggesting that under favourable conditions some early-emerging individuals may mature and mate in their second year in the field. As a possible consequence of the differences in life cycle (biennial for E. agrestis, versus annual for E. atrica), there could be substantial differences in reproductive rates and annual survival between the two species, especially if seasons vary across years. For example, the delayed emergence of E. agrestis might maximise survival under harsh winter conditions. An interesting direction for future research at the two study sites would be to compare rates of reproduction and survival of E. agrestis and E. atrica in relation to variation in weather conditions. Our laboratory data suggest that ambient temperature influences the timing of emergence from egg sacs in E. agrestis.
Life-history traits of Eratigena agrestis and Eratigena atrica in ecologically contrasting populations
Our study compared life-history traits of E. agrestis across two field sites that feature strongly contrasting densities of E. atrica and L. hesperus (Fig. 1), two species that are potential competitors or predators of E. agrestis. At Iona Beach, L. hesperus is not present and the density of E. atrica is low; conversely, at Island View Beach, L. hesperus is abundant and E. agrestis and E. atrica are found at similar densities. As a consequence of these differences in community compositions, it is conceivable that life-history traits of E. agrestis differ based on the variation in potential competition and predation pressure. However, none of the traits we measured differed significantly between field sites. One potential explanation for this result is that competition between the two Eratigena species and predation risks are low in coastal habitats. However, several lines of evidence suggest otherwise.
First, all three species are generalist predators. In a previous study of L. hesperus at Island View Beach, Salomon (Reference Salomon2011) found that this species preys upon a broad range of arthropods, including E. agrestis and E. atrica spiders. Although the diet of E. agrestis and of E. atrica has not yet been specifically characterised, we observed both species capturing a variety of arthropod prey, such as Diptera, Isopoda, Lepidoptera, and Araneae. The prey spectra of these three spider species appear to overlap broadly, even though L. hesperus is capable of subduing much larger prey compared with E. agrestis and E. atrica.
Second, the three study species occupy the same microhabitats: the underside of driftwood logs. In late summer, when spider numbers were at their peak, we frequently found all three species under a single log, with L. hesperus inhabiting >90% of logs surveyed at Island View Beach. Salomon et al. (Reference Salomon, Vibert and Bennett2010) documented the rapid colonisation of experimentally introduced habitat logs by all three species at Island View Beach, providing strong evidence that naturally occurring logs are a limited resource. Lastly, remains of E. atrica and E. agrestis spiders beneath L. hesperus webs indicate that both Eratigena species are at least occasional prey of L. hesperus (Salomon Reference Salomon2011; this study).
An alternative explanation for the similarity in life-history characteristics across study sites is that conspecific and heterospecific individuals exert similar competition and predation pressures. In this case, community composition would have no bearing on life-history traits. This intriguing possibility suggests potential equivalence of community members in terms of their effect on the life-history traits we measured. However, net competition or predation pressures likely differed between the two sites because spider densities at Island View Beach exceeded those at Iona Beach fourfold (Table 1). Studying the costs of competition and predation for these spiders at Island View Beach and Iona Beach would provide estimates of resource availability and spider mortality. Such a study could be coupled with experimental manipulations of spider density or resource availability to highlight the potential effects of interspecific competition on life history.
Finally, it is possible that competition or predation alters life-history traits other than those measured here. However, we focussed on several key traits such as phenology, growth, and adult size, all of which are expected to be constrained by resource availability (Toft and Wise Reference Toft and Wise1999; Oelbermann and Scheu Reference Oelbermann and Scheu2002) or predation risk.
Future studies should accurately quantify also fertility by measuring the number of egg sacs produced and spiderling recruitment. These traits are affected by feeding regimes (Spence et al. Reference Spence, Zimmermann and Wojcicki1996), and may therefore vary in accordance with competition or predation pressures. The data presented in this study suggest that the life-history traits we document are not affected by strong differences in community composition of close competitors or predators. However, these data are limited to two sites, and future work should compare a larger number of suitable sites with differing community compositions. Such work would be especially valuable for understanding the potential impact of introduced Eratigena species on native arthropod communities.
Potential implications of group living
The high population densities of spiders sharing microhabitats at Island View Beach are striking, considering that most spider species are highly territorial and aggressive towards other spiders (Whitehouse and Lubin Reference Whitehouse and Lubin2005). The observed multi-species aggregations may be the result of habitat constraints, forcing individuals to build their webs in already occupied microhabitats. Despite the possibility for increased competition or predation risk in densely populated microhabitats, such co-inhabitation might also be beneficial. Support for this possibility is evident in group-living species of spiders, where individuals sometimes spin a communal web, share web-attachment points, or take advantage of the proximity of others when capturing prey. Indeed, group living has been shown to confer individual benefits in spiders, including greater foraging and reproductive success (Whitehouse and Lubin Reference Whitehouse and Lubin2005) and protection from predators (Uetz et al. Reference Uetz, Boyle, Hieber and Wilcox2002a). It is not known whether E. agrestis and E. atrica spiders benefit from forming conspecific or heterospecific associations under driftwood logs. It is possible that the presence of several funnel-webs under a particular log increases prey retention under logs.
Aggregations may also form when spiders seeking suitable microhabitats use the presence of other spiders as an indicator of site quality (Schuck-Paim and Alonso Reference Schuck-Paim and Alonso2001). Spider aggregations such as those encountered at our study sites may persist if benefits offset the costs of searching for and settling in a profitable microhabitat (Jakob Reference Jakob1991; Bilde et al. Reference Bilde, Coates, Birkhofer, Bird, Maklakov, Lubin and Aviles2007). A study of microhabitat selection patterns at Island View Beach and Iona Beach would provide explanations for (i) the high spider densities we observed in our study and (ii) the apparently stable E. agrestis life history across strongly varying community compositions.
Acknowledgements
Robb Bennett introduced us to the spider populations featured in the study. The authors are grateful for the logistical support provided by the Bennett family. They thank Sean McCann for the spider photographs, and Chris Buddle and two anonymous reviewers for constructive comments on the manuscript. This research was conducted under a permit from the Greater Vancouver Regional District (Iona Beach) and with the permission of the Tsawout First Nation (Island View Beach). Funding was provided by a Natural Sciences and Engineering Research Council of Canada (NSERC) – Discovery Grant and by an NSERC – Industrial Research Chair to G.G., with Scotts Canada as sponsor.