

Introduction and Previous Literature
How much is spent on long-term care (LTC) in Canada? How has it changed over time and how does it compare to other countries? How much of the total is supported by taxes or paid by private insurers, and how much is out-of-pocket? Finally, what shares go to support individuals in institutions and those living in the community (“home care”)? As we show, getting answers to such questions is not easy; furthermore, the answers depend primarily on the accounting assumptions that were made in the source consulted. For instance, consider the following: Estimates of the share of LTC in total health care spending range from 12 per cent to 16 per cent depending on the source used and the assumptions that underpinned the estimates. The private share either decreased throughout the period for which data are available (according to the Organization for Economic Cooperation and Development [OECD]; OECD, 2017) or first decreased and then returned to its 1975 level (Canadian Institute for Health Information [CIHI]; CIHI, 2017). The share of home care is somewhere between 10 per cent and 30 per cent of LTC expenditures depending on the source and the definitions used.
Such issues with available data may explain why there are so few quantitative analyses of total spending on LTC in Canada and hence our ignorance of how Canada compares to other countries and how spending on LTC compares to spending on the rest of health care. A search on Google Scholar identifies only two quantitative analyses based exclusively on Canadian data. The first, by the Canadian Life and Health Insurance Association (CLHIA) (2012), projected costs to the year 2047 based on projections of the population using long-term care, both residential and community-based; however, in the absence of better data, the per capita cost figure on which the forecast rests derived from just one Ontario Local Health Integration Network (LHIN, the term used to describe regional health authorities in Ontario).
The second quantitative analysis, by Coyte (Reference Coyte2000), using published data from CIHI and Health Canada, concluded that spending on home care increased by 9 per cent per year between 1990 and 1999, or much more rapidly than on the rest of health care. Coyte also found that spending on home care is 80 per cent publicly funded, a finding that may seem counterintuitive given the amount of private care provided. In addition, the OECD has published two international comparisons of long-term care spending that include Canada. In Help Wanted? (OECD, 2011), total (public and private) long-term care spending in Canada was estimated at 1.5 per cent of GDP for the year 2008 (or approximately 12% of total health care expenditures), 85 per cent being publicly funded and institutional care representing 87 per cent of total spending on long-term care. The second study (OECD, 2013) reported average public-only spending on long-term care at 1.2 per cent of GDP for the years 2006–2010.
In this article, we explain why various sources yield discrepant estimates of LTC spending, its incidence (who pays), and its distribution (what services are funded). We then suggest the ideal measure for each of these statistics and provide estimates that we think are the most reasonable, given the data currently available.
There is no “best” measure of long-term care cost and its distribution across funders and types of care, but it is important that statisticians, national income accountants, health services and policy analysts, the media, and the general public choose wisely when they pick a measure. This is, of course, all the more important when comparing Canada to other countries (that also use their own somewhat arbitrary assumptions) or when establishing time series – for instance, to project the future costs of LTC. In this article, we provide a mapping of concepts to definitions and suggest a preferred series in each case.
LTC includes a range of services and supports that are intended to provide assistance over an extended period to individuals, whether they live in institutions (“residential care facilities”) or in the community. (Accordingly, LTC is distinguished from rehabilitation care that is meant to be provided over a more limited period of time.) On the basis of this definition, which is adapted from the United States’ Administration on Aging (https://longtermcare.acl.gov/the-basics/what-is-long-term-care.html), we can state two things: First, any estimate of LTC costs should be based on a bottom-up aggregation of individual services; second, even though the logic of the definition is clear (LTC is meant to care, not cure), whether to deem a given service as long-term or acute care will likely depend on the circumstances in which the service is delivered. For instance, a physician assessing a patient suffering from dementia can be said to provide care rather than cure if the dementia is not curable, but appropriate treatment may prevent or delay functional loss. As another example, room service and catering provided in a retirement home may not legitimately be considered care if the recipients could live independently without those services. Ideally, then, analysts should have access to information on costs at the most disaggregated level possible (by service), combined with source of funding and location of recipient (institution or community). The analyst would then assign services to long-term or acute care to obtain as consistent a definition as possible.
However, that is not the type of analysis we have in mind here: Because we are interested in the historical evolution of LTC expenditures, as well as in establishing reliable sources of information for the ongoing documentation of these costs in the future, we started our inquiry by identifying statistical series that are published annually and which follow standardized formats and definitions.Footnote 1 We then mapped concepts to assumptions and definitions for these statistical series. Last, we used information not published on a routine basis to gauge the extent to which each series differs from the “closest” approximation of LTC spending, its incidence and distribution; we regard the latter as “preferred estimates” and present them alongside the routinely published series.
Data: A Brief Account of the Main Series
Two main series are available, one from CIHI, the other from the OECD.
Since 1975, CIHI has published the National Health Expenditure (NHEX) series on health care spending by source of funding. NHEX follows the definitions and procedures of the system of health accounts (United Nations, 1993; see also OECD, 2000). The system of health accounts is designed to standardize the ways in which various countries define health care services and report expenditures. It produces a matrix of money flows within the health care system from “funders” to “providers of services”.
To keep international comparisons manageable, CIHI aggregated providers (those who receive the monies) into seven broad categories:
• Institutions (two subcategories: hospitals and others)
• Professionals (four subcategories: physicians, dental care, vision care, and others)
• Drugs (two subcategories: prescribed and non-prescribed)
• Capital
• Public health
• Administration
• Other (two subcategories: research and other)
Funders identified in the NHEX include
• provincial government,
• federal direct payments (direct meaning not through transfers to provincial governments),
• municipal government,
• social security funds (Workers’ Compensation Boards and compulsory drug insurance in Québec),
• out-of-pocket,
• private insurance, and
• “non-consumption” (charities, capital spending).
For public funders, the NHEX uses public accounts as its basic source. Publicly funded LTC spending can be inferred from public transfers to two categories of providers: “Institutions: other” (second subcategory of the “Institutions” category) and “Professionals: other” (fourth subcategory of the “Professionals” category).
For private funders, the NHEX uses information collected in surveys: out-of-pocket and private insurer costs are identified in the Long-term Care Facilities Survey (LTCFS, previously known as the Residential Care Facilities Survey) for institutions and in the Survey of Household Spending for home care.
The OECD Health DatabaseFootnote 2 uses data provided by CIHI to build its NHEX series, but identifies a more fine-grained category of “long-term care”. The OECD series goes back to 1970 (information prior to 1975 likely came from Statistics Canada) and includes estimates of “long-term nursing care: residential care facilities” and “long-term nursing care: home care”. From 1970 to 2002, the OECD distinguishes between public and private sources (but provides no breakdown within each); from 2003 onward it identifies federal direct, provincial, municipal, social security funds, private insurance, corporations other than private insurance, and out-of-pocket expenditures as sources of funding. The OECD series use the same definition as CIHI for publicly funded LTC in institutions; but the OECD adds to the CIHI series an estimate of LTC services provided in hospitals, known as alternative level of care, or ALC (see “LTC Provided in Hospitals” below). The OECD also follows the CIHI definition and source for privately funded LTC in institutions, and the OECD and CIHI series are identical up to 1999. They then diverge: the OECD series becomes smaller by between 7 per cent and 23 per cent. The statisticians at CIHI and the OECD could not provide an explanation for the discrepancy.
Thus, whereas CIHI and the OECD are the two sources from which we can infer annual spending on LTC in Canada (how much it costs), the breakdown by source of funding (who pays), and the use of funding (residential vs. home care) over a long period of time, each has weaknesses. CIHI does not explicitly identify LTC, forcing the analyst to infer it based on the nature of providers most likely to deliver LTC services; as will be shown, there is no possibility to get that inference right. The OECD identifies a category called LTC, but as we demonstrate, it is also based on inferences, some of which are questionable, and it does not provide a reliable breakdown by source of funding.
Our purpose in what follows is to clarify the concepts used by CIHI and the OECD to determine how they bear on our ability to assess LTC spending and its incidence, and to identify critical information that can be found only in other sources or that seems to be truly unobservable. We also suggest different approaches to defining funders and tracking monies provided for LTC services and supports. When feasible, we report a time series for each definition or technical choice that we made and explain how technical choices in national accounting affected our ability to measure and forecast LTC spending in Canada. More specifically here, we address the following four questions:
1. How can we reconcile the sources of information on LTC spending and its incidence in Canada?
2. How reliable are published data on LTC spending?
3. What series should we use to describe LTC expenditures by source in Canada?
4. How could these series be modified to get a comprehensive and reasonably accurate picture of LTC spending and its incidence in Canada?
Method: Mapping Concepts to Series
The CIHI and OECD series are the only ones published on an annual basis, and each follows the logic of national accounting. That makes data collection easier and more reliable, but has two major consequences for analysts who want to construct series of long-term care expenditures and their distribution by type of service or funder. The first consequence is that it is almost impossible to decompose spending by type of payer within each category of public and private funders; the second is that using these series to produce a measure of LTC expenditures that corresponds as closely as possible to an ideal definition requires some triangulation and (sometimes heroic) assumptions. We detail each in turn and explain how we proceeded.
Spending and Funder Type
It is not possible to distinguish spending by type of funders within the public and private categories.
The accounting principle in the system of health accounts is that expenditures are attributed to whomever writes the check to the provider (“responsibility of payment”), not to the institution having to make the decision to forego the resource in the first place (“incidence of payment”). One implication of this approach is that the attribution of costs to various levels of government is almost meaningless: If a provincial government receives a transfer from the federal budget and then uses that transfer to fund a residential care facility, CIHI will attribute the expenditure to the provincial government even though it could legitimately be argued that the federal government bears the opportunity cost of supporting the facility (since the money transferred to the provincial government cannot be used for other purposes at the federal level). Things are even more complex because the principle is not fully respected: When a provincial government transfers funds to a municipality, and that municipality hires an organization to deliver LTC, CIHI attributes the cost to the provincial government (see CIHI, 2013, pg. 82, bullet point 3 – no explanation is provided for such an exception). That makes the distinction between municipal and provincial spending meaningless. The distinction between the federal level and the rest is potentially meaningful because it separates what is spent on groups for which the federal government is responsible. However, since we decided not to distinguish the groups based on federal/provincial responsibility, we have chosen not to decompose payments by level of government but instead to keep one broad category called “government”.Footnote 3
Similarly, it is impossible to distinguish between out-of-pocket and private insurance within the category of private spending. Expenditures on residential LTC are known through facilities (an exception to the principle of responsibility, because institutionalized individuals are not surveyed in Canada and cannot, as a result, provide information on their level of expenditures on long-term care), and facilities do not report separately what they receive from insurers and directly from their residents. Because insurance is not a major source of funding in LTC, this is not a significant issue and we recommend treating private spending on institutional LTC as a whole.
More problematic is the absence of any good source to estimate out-of-pocket spending on home care (whether out-of-pocket or from insurance), as detailed in the next section. This, however, is not an issue of distinguishing by source of funders, but rather of estimating spending on a type of service.
Inferring Categories of Expenditures
Most categories of expenditures need to be inferred or triangulated based on annual series and ancillary sources of information (such as one-time reports or sources of data not used by CIHI or the OECD).
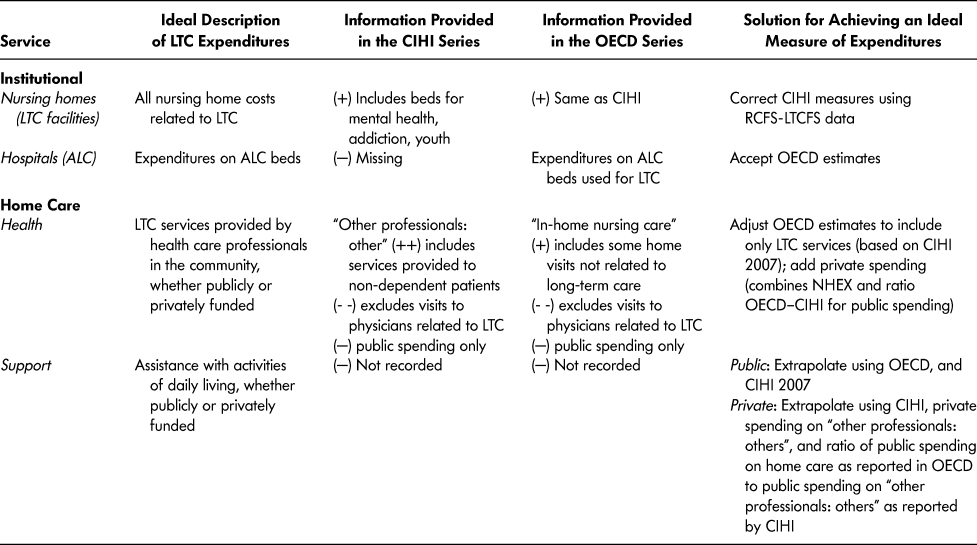
Table 1 summarizes the source and quality of information in each annual series for four main types of services: nursing homes (LTC facilities), hospitals (ALC), home care health services, and home care support services. The second column of the table outlines what should be included in an ideal description of LTC expenditures for each type of service; the third and fourth columns indicate the source and quality of information provided in the CIHI and OECD series respectively. The fifth column (“solution”) summarizes our attempt at triangulating to produce a series that approximates the ideal measure, given available (and accessible) data, as explained in more detail in section 4.
Summary of CIHI and OECD measures for four types of services related to long-term care

Note. (+) means the source overestimates the level of spending, and (++) means strong overestimation; (- -) means the source underestimates the level of spending, and (—) means data are not recorded.
ALC = alternative level of care
CIHI = Canadian Institute for Health Information
LTC = long-term care
NHEX = National Health Expenditure
OECD = Organization for Economic Cooperation and Development
RCFS-LTCFS = Long-term Care Facilities Survey (LTCFS, previously known as the Residential Care Facilities Survey)
LTC Provided in Nursing Homes
CIHI identifies a category called “Institutions: other”. It comprises mainly nursing homes for the chronically ill and permanently disabled (which we want to count as spending on LTC), but also includes facilities for mental health and addiction and facilities for emotionally disturbed children; it is not clear that we want to include care for the latter two categories in our definition of LTC. Expenditures on LTC in residential care facilities will therefore be overestimated in the CIHI and OECD series.
LTC Provided in Hospitals
Another issue is that some institutional LTC is provided in hospitals and, as a result, is not captured by the subcategory “Institutions: other”. The administrative category associated with LTC is the so-called ALC: those in acute care in-patient beds who have been coded by a physician as not needing acute care services. They are waiting to be discharged to an appropriate setting (50% are transferred to a residential care facility or to rehabilitation). The OECD uses the Canadian MIS Database (CMDB) managed by CIHI to infer the portion of hospital budgets going to LTC services. (MIS – management information systems – is the standardized reporting system that hospitals across Canada must use in reporting to their provincial or territorial Ministries of Health.) The CMDB allows CIHI to count the number of bed-days occupied by ALC patients (approximately 15% in 2009). Note that the estimate is based on physician-based coding and that physicians agree that coding a patient as ALC leaves room for subjective judgement calls. Thus, the proportion of ALC days in total in-patient days is certainly an approximation. However, according to CIHI (2009), the under-estimate is no more than 8 per cent. Once the proportion of ALC days is known, the OECD infers what function a service fills and allocates the cost of those days.Footnote 4
Home Health Care
Publicly funded home care health services are found in the CIHI series in “Other professionals: other” (CIHI distinguishes two main subcategories of professionals – physicians and others; the subcategory “others” is further subdivided into “dental care”, “vision care”, and “other”); the subcategory “Other professionals: other” includes expenditures on services provided by professionals such as chiropractors, massage therapists, osteopaths, physiotherapists, podiatrists, psychologists, private duty nurses, and naturopaths, who deliver LTC services as part of their activity but also deliver other types of services. Thus, the CIHI series for public home care will overestimate public spending on home care by the amount of spending on these services that is publicly covered, an amount which varies over time and across provinces.
The OECD uses the same raw data as CIHI for publicly funded home care, and applies more detailed definitions of providers to derive what it calls “nursing care provided at the home of the patient” but is really care provided by any health care professional at the home of the patient. However, not all such care is long-term; some is for those who are temporarily unable to go to the hospital or to visit a doctor. As a result, it is also an overestimate of spending on home care, but it is closer to the conceptual definition of “home care” than what can be found in CIHI.
Both series (CIHI and OECD) overestimate publicly funded home care spending, as shown above, but also miss the costs associated with LTC services delivered by physicians in the community.Footnote 5 We have found no way to estimate such costs based on currently published data.
Private spending on home health care is not estimated in either of the series. It could be approximated using responses to the Survey of Household Spending (SHS) which has been conducted annually (in the provinces; every other year in the territories) by Statistics Canada since 1997 (when it replaced the Family Expenditures Survey, FAMEX, which was conducted every other year). Of particular interest is question HE_Q100 about out-of-pocket payments to practitioners for visits at home.Footnote 6 Unfortunately, the answers include payments to non-medical practitioners outside the home and acute care services provided to patients in rehabilitation – for instance, after surgery or injury, or for back pain (physiotherapy).
Home Support
The system of health accounts methodology excludes most home support services in its definition of health care expenditures: to be included, a service must be provided by a health care professional or must help a health care professional provide a service (OECD, 2000). Thus, only nursing care services are included in the system of health accounts; expenditures on social supports for dependent individuals are not, and therefore are not reported in the CIHI or OECD series.
Moreover, because the system of health accounts does not track services per se but rather money flowing from funders to provider organizations, any service provided by an organization whose primary objectiveFootnote 7 is not medical (to improve health status) but social will not be included in the health accounts and, as a result, will not be included in CIHI or OECD estimates.
Solution: Our Preferred Estimate
On the basis of the sources assessed as described in the previous section, we used auxiliary sources of information to generate “preferred estimates” for the years 1975 to 2013, series that we think best represent spending on LTC, its incidence and distribution across settings, and that allowed us to assess the extent of measurement error in the CIHI and OECD series.
Residential Care
Public Spending on Residential Care
Our starting point was the CIHI series “Institutions: other / public sources of funding”. To correct the overestimate associated with “other” institutions (since not all of them provide LTC), we used data from the LTCFS. This is a mail survey conducted by Statistics Canada of all residential care facilities in Canada with 4 beds or more for calendar years 1975 and 1976 and fiscal years from 1976–77 to the present, with gaps for 1994–95 and 1995–96. The response rate has been between 72 per cent and 85 per cent of facilities (accounting for more than 82% of beds) but less than 70 per cent typically complete the full questionnaire. The LTCFS provides financial information on expenses (distinguishing between direct care to residents and general services) and sources of revenue (governments or residents).Footnote 8 We used aggregates based on the survey (CANSIM table 107-5502) to identify residential care facilities (RCFs) for the aged, under the assumption that they provide LTC. We corrected the CIHI–OECD estimate of public spending on LTC facilities based on the ratio of their number of days to the total number of days of all RCFs.
The ratios for the years 1985–1994 and 1996–2010 suggest an overestimate of about 25 per cent with a decreasing time trend. That means that CIHI–OECD would not fully capture the growth in LTC spending in residential care facilities unless we introduced a correction to reflect the decrease over time in the CIHI–OECD overestimate of residential LTC expenditures. For the years for which the ratio was not available (1975–84, 1995, 1996, and 2011–13), we proceeded as follows:
• Before 1985, we used an adjustment factor of 0.7 (that is, we assumed that residential LTC is 70% of total CIHI “Institutions: other”), based on the stability of the ratio between 1985 and 1990.
• After 2010, we used an adjustment factor of 0.82, based on the stability of the ratio between 2000 and 2010.
• For 1995 and 1996, we interpolated between the values for 1994 (0.77) and 1997 (0.80), yielding 0.78 for 1995 and 0.79 for 1996.
• To the result, we added the OECD-estimated expenditures on ALC patients in hospitals.Footnote 9 The OECD first estimates in this series relate to 1999. For earlier years, we needed to add estimates of ALC to CIHI residential care spending. For that purpose, we applied a ratio of ALC spending to residential LTC spending (see the previous bullet point) for the years for which OECD estimates are available (1999 and after). That ratio is stable over time with an average value of 0.23 (minimum 0.21, maximum 0.25, standard deviation 0.01); we therefore multiplied the value of spending on residential care facilities for the aged by 1.23 for years for which OECD ALC estimates are not available.
Private Spending on Residential Care
We started from the CIHI series “Institutions: others / private sources of funding” and applied the ratio for “facilities for the aged” derived from CANSIM as explained above. That is, we assumed that institutions for the aged have the same share of public funding as other RCFs. We added published information on expenditures incurred by private health insurers based on the proprietary survey conducted between 2006 and 2012 by the Canadian Life and Health Insurance Association (CLHIA). (The amounts are minimal and do not change the description of total costs or costs by funder.) It is possible that charities fund beds in RCFs and that should have been added to our estimate of private spending on institutional LTC. The 2011 Survey of Canadian Charities (Payne, Reference Payne2012) provides information for a sample of 4,025 charities (those that can issue tax receipts for donations); it could be used to complement evidence on the topic but we did not use it. Last, we did not add any correction for ALC, under the assumption that all in-patient care is publicly funded.
Home Care
Public Spending on Home Health Care
We started from the OECD series, 1975 to 2013, but added an estimate of home care spending support services that enable clients – incapacitated in whole or in part – to live at home. Our estimate is based on a one-time report published by CIHI (2007) on public home care spending in Canada which provides estimates of annual expenditures for the fiscal years 1994–95 to 2003–04, in total and broken down by three sources: provincial/territorial governments, federal direct, and Workers’ Compensation Boards. For provincial/territorial governments (but not for the other two), this report disaggregates home care spending into home health care and home support; accordingly, it is the only source we have found that uses an approach based on the nature of services provided rather than on the profession delivering them. As a result, it gives an estimate of home care spending that does not include the portion of non-LTC–related services offered by professionals who provide some such services as part (but not all) of their activity but that does include support services not accounted for by CIHI or the OECD.
Using the estimates of spending on home health care (equivalent to nursing care) in the CIHI report for the years for which they are available, we calculated the share of the cost calculated by the OECD that is truly home care (and not other services offered by professionals who also provide LTC). Even though the CIHI report is incomplete, because two provinces (Alberta and Manitoba) did not provide a breakdown of their home care expenditures between home health care and home support services, and another (Newfoundland) did not provide an estimate of total home care spending, we used this source to create a series of LTC expenditures that includes home care support.
The ratio for all but the first year showed no trend, low variance, and an average value of 0.51 (1994–95 was an outlier, with value 0.25); we applied the value 0.51 to the OECD series for all missing years to arrive at our preferred estimate.
Public Spending on Home Support Services
We used CIHI (2007) to estimate the ratio of costs of support services to home health care (as provided in the CIHI series) for each year between 1995 and 2004. This ratio is stable at around 1.00 between 2000 and 2004, and we used it to estimate the cost of support services (public) after 2004 (equal to the cost of home health care). Before 2000 the ratio is more erratic, but averages at 1.42; we used the value 1.42 to infer support services spending before 1995.
Private Home Care
We started from the CIHI estimate of private spending on home care (which includes out-of-pocket spending on services that fall outside of home care stricto sensu but excludes home support services) and applied to that number the ratio of our estimate of public home care costs (arrived at as explained in the previous paragraphs) to the initial CIHI estimate of public home care costs (“Other professionals: other”). In other words, we assumed that the ratio of spending on home care services (health and support) to spending on “Other professionals: other” is the same for public and private funding.
Findings and Implications
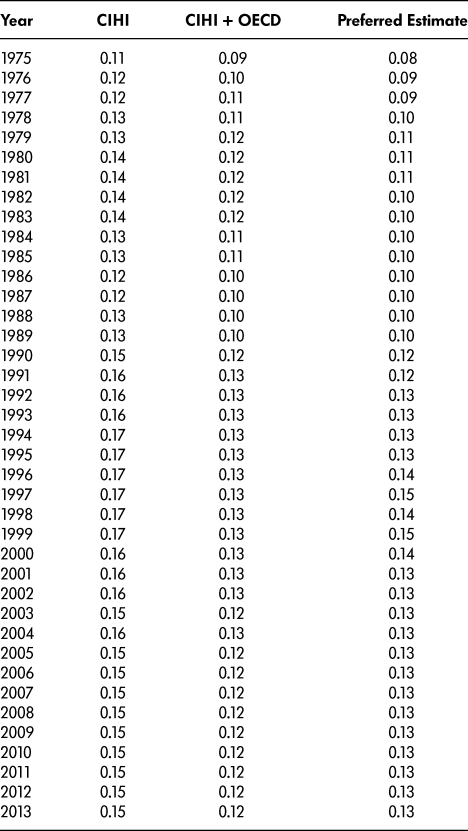
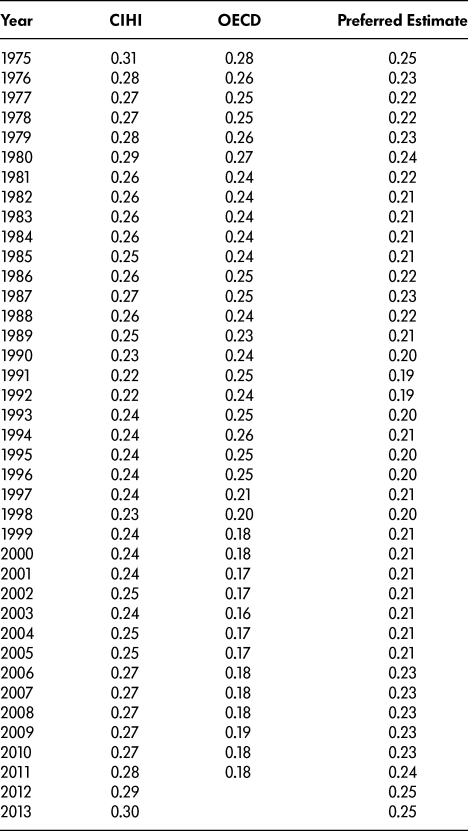
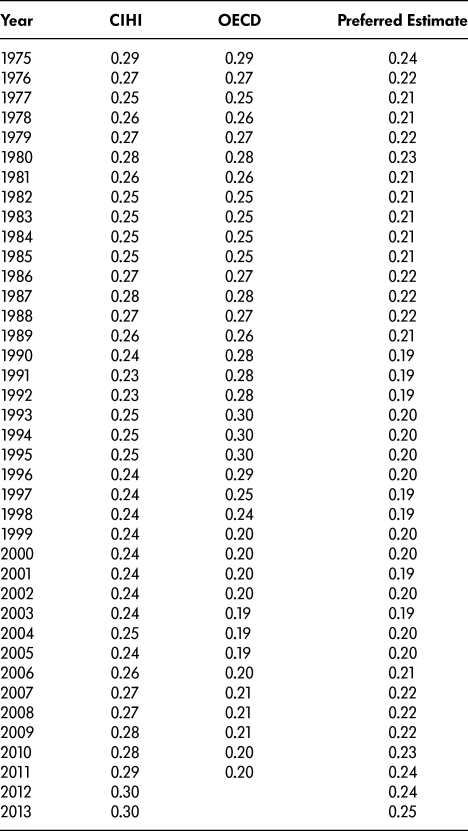
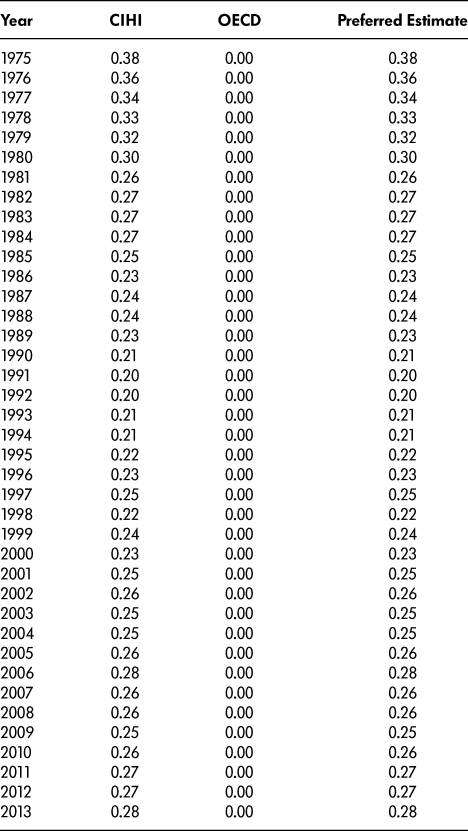
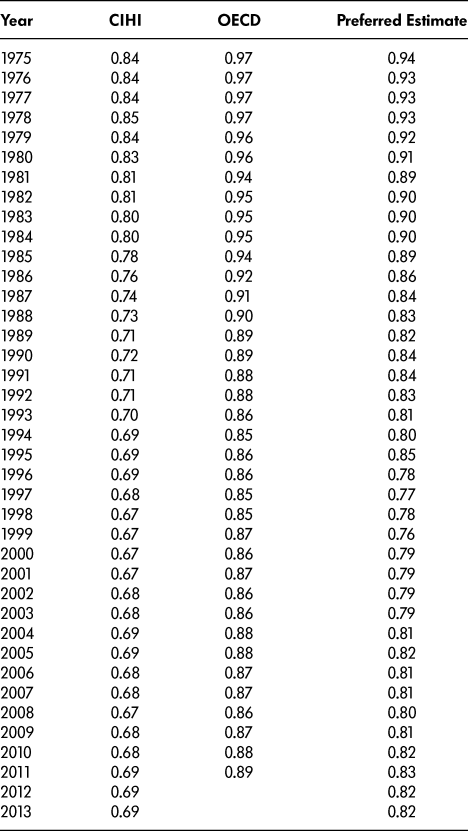
The main results are summarized in terms of expenditure shares. Table 2 reports expenditures on LTC as a proportion of total health care expenditure; Table 3.1 shows the private expenditure share of total LTC expenditures; Tables 3.2 and 3.3 report the private share separately for expenditures on residential care and on home care; Table 4 shows residential care as a proportion of total expenditure on LTC. The current dollar series that underlie each of the shares are available in the online appendix.
Proportion of long-term care in total health expenditures, alternative estimates

Note. These are ratios between 0 and 1: for example, 0.11 means 11%.
CIHI = Canadian Institute for Health Information
OECD = Organization for Economic Cooperation and Development
Private proportion of total expenditures on long-term care, alternative estimates

Note. These are ratios between 0 and 1: for example, 0.11 means 11%.
CIHI = Canadian Institute for Health Information
OECD = Organization for Economic Cooperation and Development
Private proportion of total expenditures on residential care, alternative estimates

Note. These are ratios between 0 and 1: for example, 0.11 means 11%.
CIHI = Canadian Institute for Health Information
OECD = Organization for Economic Cooperation and Development
Private proportion of expenditures on home care, alternative estimates

Note. These are ratios between 0 and 1: for example, 0.11 means 11%.
CIHI = Canadian Institute for Health Information
OECD = Organization for Economic Cooperation and Development
Proportion of residential care spending in total long-term care spending, alternative estimates

Note. These are ratios between 0 and 1: for example, 0.11 means 11%.
CIHI = Canadian Institute for Health Information
OECD = Organization for Economic Cooperation and Development
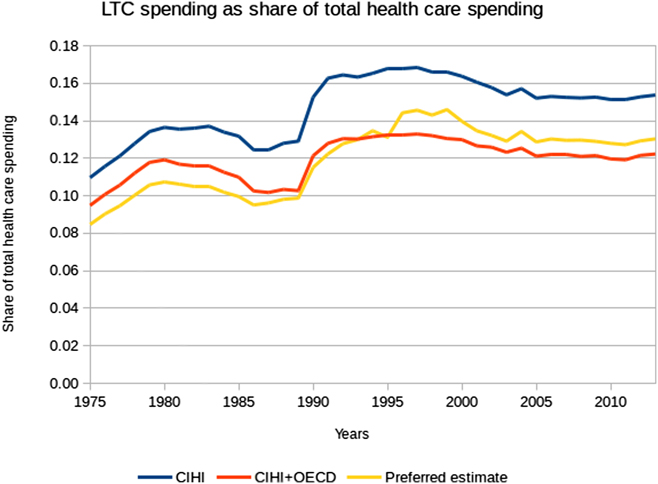
Figure 1 summarizes the three series for total spending on LTC as a share of total health care expenditure for the years 1975–2013: (1) CIHI; (2) CIHI + OECD, the combination of CIHI for residential care and OECD for home care; and (3) our preferred estimate. The CIHI value is consistently above the preferred estimate, by 2 to 4 percentage points. The OECD series is initially at values between the CIHI and preferred series, but is below the preferred series after 1995. Based on our preferred estimate, the share of LTC in total health care spending increased in the late 1970s, from 8 per cent to 11 per cent, remained between 10 per cent and 11 per cent in the 1980s, increased again in the 1990s, to 15 per cent in 1999, and then decreased, reaching 13 per cent in 2013. An analyst or policymaker using the CIHI series would overestimate the level of expenditures on long-term care in Canada but would have a good understanding of its evolution over the past 40 years, whereas one using the OECD series would get the level almost right but would err in the interpretation of the change over time.
Long-term care (LTC) spending as share of total health care spending. (CIHI: Canadian Institute for Health Information; OECD: Organization for Economic Cooperation and Development)

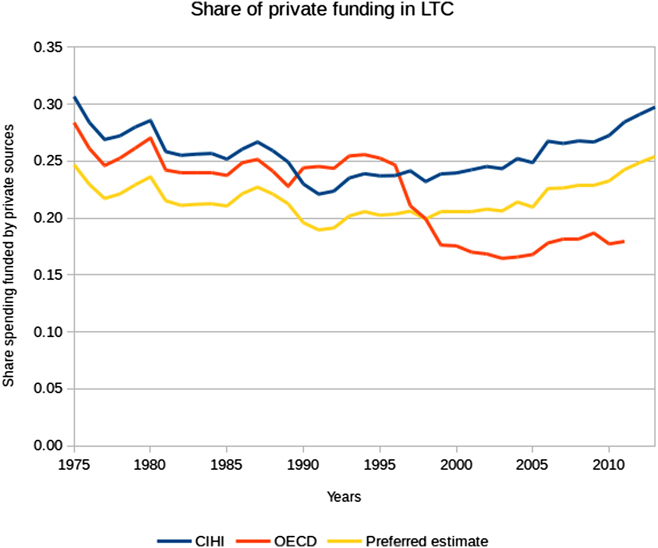
Figure 2 describes the share of private financing of LTC for the same years, according to the same three sources of information. CIHI overestimates that share by 3 to 6 percentage points (as compared to our estimate of around 25%), and the OECD series first overestimates the share (until 1998) and then underestimates it. The share of private financing of LTC decreased from 25 per cent in 1975 to 19 per cent in 1992, after which it increased gradually back to 25 per cent. Understanding the share of spending that is publicly funded is a crucial element of evidence-based policy, and it is of concern that the CIHI series would largely overestimate the private share of LTC spending (by 5 percentage points). An analyst using the CIHI series would conclude that the share of private spending in LTC is similar (if not greater than) that observed for acute care; however, using the OECD series, the conclusion would be that LTC is much more publicly funded than acute care, and moving quickly towards more public funding.
Share of private funding in long-term care (LTC). (CIHI: Canadian Institute for Health Information; OECD: Organization for Economic Cooperation and Development)
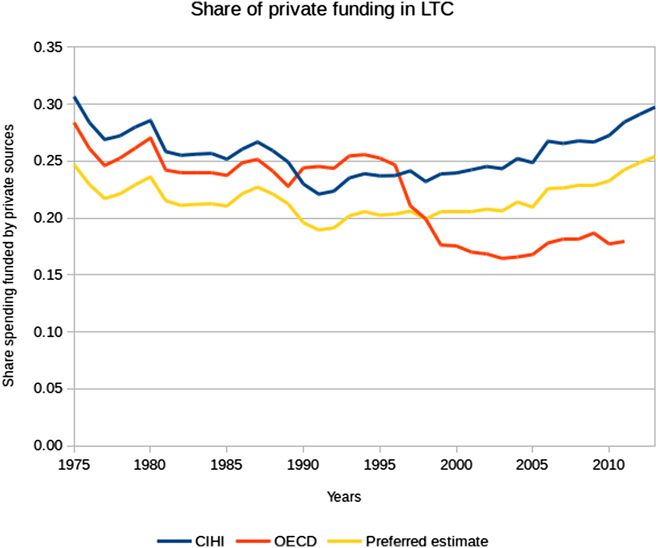
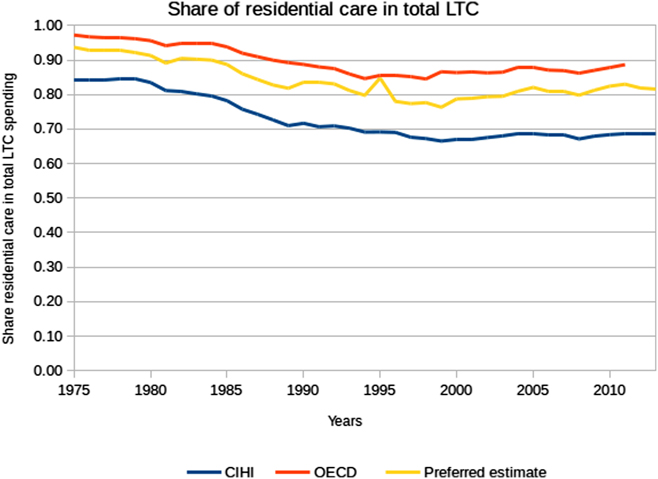
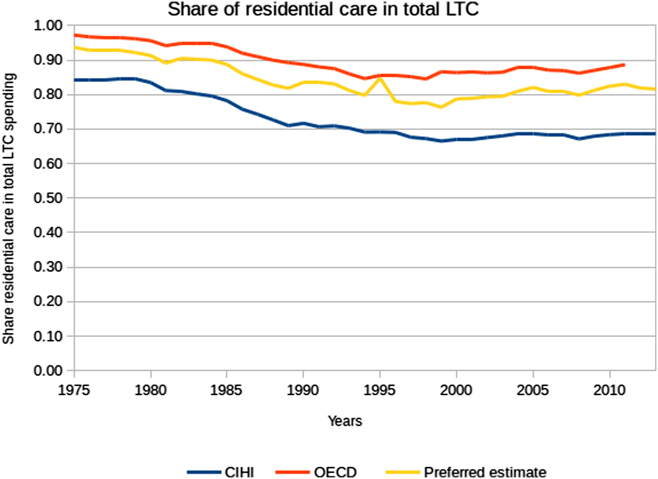
Figure 3 shows the share of residential care in total LTC, for the same years, and according to the three sources of information. CIHI underestimates the share of residential care (and overestimates home care) by approximately 10 percentage points (as compared to our estimate of between 80% and 90% for residential care). The OECD overestimates it (and underestimates home care because it does not include private spending on home care) by approximately four percentage points. Overall, the share of residential care decreased from 94 per cent of LTC spending in the 1970s to 76 per cent in 1999 before increasing again in recent years, and stabilizing around 82 per cent. The share of home care relative to residential care in LTC is another crucial piece of information, as most governments try to keep dependent individuals in the community as long as possible: CIHI would give a rather pessimistic view of the level, putting Canada clearly at the bottom of the distribution of OECD countries, but the OECD series would greatly overestimate the share of home care in total LTC. In both instances, this would not help policy analysis or policymaking.
Share of residential care in total long-term care (LTC). (CIHI: Canadian Institute for Health Information; OECD: Organization for Economic Cooperation and Development)
Supplementary Material
To view supplementary material for this article, please visit https://doi.org/10.1017/S0714980818000028