


Highlights
-
• Models trained using both admission and inpatient data performed the best.
-
• Models revealed important markers of prognosis such as status of intubation, hematoma expansion and intraventricular hemorrhage.
-
• Our study design mirrors a real-world deployment scenario in which a model developed at a single center is transported to external cohorts.
Introduction
As of 2017, stroke ranks as the third highest cause of death and disability (combined) and the second leading cause of death globally. Reference Johnson, Nguyen and Roth1 While mortality rates have declined over the past three decades, the incidence rate has remained relatively unchanged. Spontaneous intracerebral hemorrhage (sICH) accounts for 27.9%, equating to approximately 3.41 million individuals worldwide. According to the Global Burden of Diseases, Injuries and Risk Factors Study in 2016, 89.5% of disability-adjusted life-years (DALYs) in patients with hemorrhagic strokes are attributable to potentially modifiable risk factors, indicating significant opportunities for improvement not only in prevention but also in secondary management. The study further highlights that the reduction in DALYs over time was notably smaller in high-income countries compared to the more substantial decrease observed in low-income countries.
A critical approach to optimizing care and preventing further disability or death is through accurate prognostication. Only 12–39% of patients who experience an intracerebral hemorrhage (ICH) regain functional independence. Reference Gregorio, Pipa and Cavaleiro2 Unlike ischemic stroke, where secondary prevention can involve a range of medications, care for sICH patients is largely supportive, underscoring the importance of prognostic assessments to inform treatment regimens. Consequently, various prognostic tools have been developed over the years, initially targeting general sICH populations and subsequently evolving to address more specific patient groups. One of the earliest and most widely adopted tools was the original ICH score (oICH), which considered factors such as the Glasgow Coma Scale (GCS), age (≥80 years), ICH volume (≥30 mL), intraventricular hemorrhage (IVH) and the presence of an infratentorial origin. Reference Widyadharma, Krishna and Soejitno3 However, due to concerns regarding its ability to predict levels of disability, the modified ICH (mICH) score was introduced. This revised score incorporated the National Institutes of Health Stroke Scale (NIHSS) instead of the GCS and included considerations for respiratory failure and mass effect. While the mICH score demonstrated superior predictive ability over the oICH, additional scoring systems were developed to further refine prognostication at the bedside. One such tool is the ICH-Grading Scale by Ruiz-Sandoval et al., which is conceptually similar to the oICH but employs different cutoffs. Reference Ruiz-Sandoval, Chiquete and Romero-Vargas4 With an increasing emphasis on long-term functional outcomes, the ICH Functional Outcome Score was developed, incorporating the premorbid modified Rankin scale (mRS) and proving more robust in predicting disability at 90 days than its predecessors. Reference Ji, Shen and Pan5 Another notable model is the max-ICH score, which incorporates patients’ code status, addressing a limitation of the oICH score by not excluding do-not-resuscitate or comfort care patients. Reference Sembill, Gerner and Volbers6
These scoring models were traditionally based on statistical methods involving a limited set of variables. However, the advent of machine learning (ML) has enabled the development of several prognostic models for sICH. Logistic regression (LR), one of the simplest ML techniques, employs a small number of covariates. Reference Couronne, Probst and Boulesteix7 In contrast, Random Forest (RF) uses a nonlinear approach, creating multiple decision trees and typically outperforming LR in terms of prediction accuracy. XGBoost (XGB), a more advanced model, constructs multiple decision trees while iteratively correcting the errors of previous trees. Reference Chen and Guestrin8 The multilayer perceptron (MLP) utilizes supervised learning to build an artificial neural network composed of interconnected layers of nodes, capable of modeling complex, nonlinear relationships within the data. Reference Gardner and Dorling9
When comparing ML models to traditional statistical methods, Jang et al. demonstrated that several ML models offer superior accuracy and reliability in predicting functional outcomes. Reference Jang, Chang and Lee10 According to the 2022 American Heart Association / American Stroke Association (AHA/ASA) guidelines, while the optimal timing for baseline prognostic assessments has yet to be fully defined, such assessments are often performed within the first 24 hours of admission. Reference Hemphill, Greenberg and Anderson11 These traditional models highlight the potential limitations of relying solely on early severity scales, particularly in cases with high mortality and inherent prognostic uncertainty. Consequently, allowing more than 24 hours to gather data for ML models may provide more accurate prognostication. A recent study involving 12,426 patients with documented ICH scores on admission showed that there was a significant association between ICH score and likelihood of mortality, decision to withdraw life-sustaining treatment (WLST) and specifically WLST within 2 days of presentation. They identified that the most predictive variable associated with WLST was the ICH score, suggesting a continued influence of the self-fulfilling prophecy in ICH. Reference Massad, Zhou and Manolovitz12
Aims/hypothesis
For the purposes of this study, we aim to train ML models for prognostication purposes in ICH patients in a Qatari population and then validate them in a completely different cohort, namely, the Antihypertensive Treatment of Acute Cerebral Hemorrhage II (ATACH-2) database, which was a multinational trial. Most ML studies have been performed in the same demographics, which limits the generalizability of the models tested. By leveraging data from two very diverse datasets containing data from patients belonging to multiple ethnicities and backgrounds, we aim to better train our models and then validate them on completely unseen data. We compare ML models (LR, RF, XGB, MLP) to assess which model is the best predictor of functional outcomes and mortality in patients with sICH at 90 days. While most ML models for sICH prognostication have been developed using admission variables, our models were developed taking into account “admission” and “inpatient” variables, accounting for the changes in the clinical status of a patient that can occur during the course of admission. We then also compared models trained on admission-only variables with models trained on both admission and inpatient variables.
Methods
Patient selection
Patients in the Qatar stroke database and the ATACH-2 study with non-anticoagulant spontaneous, supratentorial ICH with available neuroimaging and 3-month outcome data were included.
The details of the Qatar stroke database have been published previously. Reference Bhutta, Akhtar and Pathan13 For the current study, we completed a retrospective review of consecutive patients with sICH admitted to Hamad General Hospital (HGH), the only Joint Commission International (JCI)-accredited tertiary care medical facility in Qatar, which admits approximately 95% of all strokes in Qatar requiring admission. Patients with only sICH were included in the study. Data on baseline characteristics, premorbid condition, clinical presentation and laboratory tests, imaging, surgical treatment and outcomes were extracted from patients’ electronic medical records using a standardized data collection form. Details are listed in Table 1. Hematoma volume was calculated using the ABC/2 formula. Surgical treatment for ICH was defined as patients who underwent open evacuation of the hematoma. Patient outcomes were mortality at 90-day follow-up and poor functional outcome (defined as an mRS of 4–6) at 90-day follow-up.
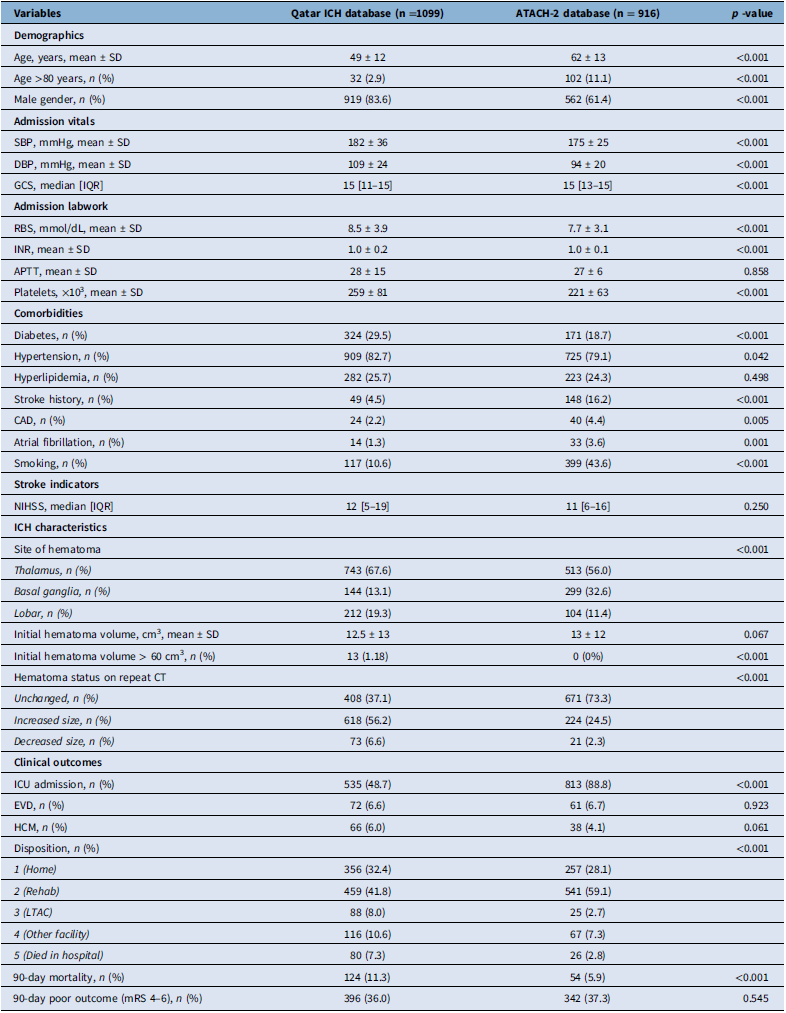
Baseline characteristics of ATACH-2 and Qatar ICH database

Table 1. Long description
The table compares baseline characteristics of patients from the Qatar ICH database and the ATACH-2 database. It has 9 rows and 7 columns. The columns are labeled Variables, Qatar ICH database (n = 1099), ATACH-2 database (n = 916), and p-value. The rows are labeled Demographics, Admission vitals, Admission labwork, Comorbidities, Stroke indicators, ICH characteristics, and Clinical outcomes. Each row contains specific variables and their corresponding values for both databases, along with p-values indicating statistical significance. Notable trends include differences in age, gender distribution, admission vitals, comorbidities, and clinical outcomes between the two databases.
SD = standard deviation; SBP = systolic blood pressure; GCS = Glasgow Coma Scale; IQR = interquartile range; RBS = random blood sugar; CAD = coronary artery disease; NIHSS = National Institutes of Health Stroke Scale; ICH = intracerebral hemorrhage; ICU = intensive care unit; EVD = external ventricular drain; mRS = modified Rankin scale; DBP = diastolic blood pressure; INR = international normalized ratio; APTT = Activated Partial Thromboplastin Time; HCM = hemicraniectomy; LTAC = long term acute care facility.
The ATACH-2 study was a multicenter, randomized, controlled trial. Full details of the ATACH-2 study design and results have been published previously. Reference Qureshi, Palesch and Barsan14 Inclusion criteria for the ATACH-2 were age 18 years or older and less than 90 years, total GCS score of 5 or greater, NIHSS score of 4 or greater, hematoma volume <60 cc and an admission systolic blood pressure (SBP) between 180 and 240 mmHg. Exclusion criteria included infratentorial location of bleed; IVH associated with ICH in which blood completely filled one lateral ventricle or more than half of both ventricles; previously known neoplasms, aterio-venous malformation or aneurysms; antecedent trauma; use of warfarin within the last 5 days; or platelet count <50,000/mm.
Baseline characteristics are summarized in Table 1. Continuous variables were reported as mean (standard deviation [SD]) or median (interquartile range [IQR]), while categorical data were presented as the number of cases (percentage). Pearson chi-square tests were used to compare differences in categorical variables (presented as frequencies and percentages) across the two groups, and Wilcoxon rank-sum tests were used to compare continuous variables (presented as medians and IQRs) across the two groups.
Machine Learning
Model development and validation
We selected four models commonly used for structured clinical data: LR (high interpretability), RF (nonlinear, robust to interactions), XGB (gradient-boosted trees) and MLP (nonlinear neural network). This set spans linear and nonlinear bias-variance regimes while aligning with prior ICH prognostication literature that frequently identifies tree ensembles as strong performers on tabular features. Reference Couronne, Probst and Boulesteix7–Reference Gardner and Dorling9
Study design and data preparation
We harmonized the Qatar and ATACH-2 cohorts by aligning variable names, units and encodings to a common data dictionary, mirroring ATACH-2 exclusion criteria in the Qatar dataset to ensure comparability. Data preprocessing included standardizing variables to numeric formats, removing redundant features and imputing missing values with medians. Patients missing baseline variables were excluded; within the analysis cohort, some predictors (notably volume 2, activation partial thromboplastic time [APTT], International normalized ratio [INR] and platelets) had partial missingness (Supplementary Material 1, Table S5). Because volume 2 was often unavailable, we derived a “volume_expansion” variable (volume 2–volume 1) when follow-up imaging was present and excluded volume 2 itself from modeling. This allowed capture of hematoma expansion while treating absent scans as no measurable change. Although incomplete follow-up remains a limitation, this approach supported consistent cohort alignment and feature preparation. Downstream analyses were performed separately on each cohort’s held-out test to assess transportability (Supplementary Material 1, Tables S1 and S2).
Missingness rates were computed separately for each cohort before imputation (Supplementary Material 1, Table S5). The most notable differential missingness was VOLUME2 (follow-up CT hematoma volume), missing in 36.4% of Qatar patients versus 1.2% of ATACH-2 patients. Laboratory values (INR, APTT, platelets) had 4.6–5.9% missingness in the Qatar cohort and 0–2.9% in ATACH-2. These variables were imputed using median values. All other variables had complete data in both cohorts.
Batch-effects mitigation
To ensure independence of test data and assess how models generalize across hospitals, we addressed batch effects in three ways. First, during cross-validation, preprocessing steps (imputation and feature standardization) were fit only on each training split, leaving validation data completely unseen. Second, for all models, z-score scaling parameters (mean and SD) were derived solely from the Qatar training set and then applied unchanged to both the Qatar test set and the ATACH set, simulating deployment of a model trained at one site to another. Third, we compared models trained on Qatar alone versus those trained on combined Qatar+ATACH data to evaluate how pooling affects accuracy and calibration. Hyperparameter tuning used 5-fold cross-validation with grid search optimizing ROC-AUC.
Datasets were split separately within Qatar and ATACH using an 80/20 stratified split to preserve outcome balance. Stratification was performed on the mortality outcome variable to ensure proportional representation of the minority class in both training and test sets. Held-out test sets were never used in model development, ensuring blinded evaluation. In addition, we created a combined training dataset (Qatar+ATACH) to test whether multi-cohort training improved generalizability. Final models were evaluated on the independent Qatar and ATACH test sets.
Class imbalance handling and hyperparameter tuning
The 90-day mortality outcome exhibited substantial class imbalance, with prevalence ranging from 5.9% in the ATACH-2 training set to 11.3% in the Qatar training set (Supplementary Material 1, Table S4). To address this, we applied balanced class weighting for LR and RF (weights inversely proportional to class frequencies) and equivalent scale_pos_weight for XGBoost. All train/test splits were stratified by outcome to preserve class ratios. We used ROC-AUC as the primary evaluation metric, as it is threshold-independent and less sensitive to class imbalance than accuracy or F1-score.
Hyperparameters were tuned via 5-fold stratified cross-validation with grid search optimizing ROC-AUC. The best hyperparameters selected for each model–scenario–outcome combination are reported in Supplementary Material 1, Table S3.
Model evaluation
Model performance was assessed separately on Qatar and ATACH test sets, evaluating discrimination using area under the receiver operating characteristic curve (AUC-ROC) with bootstrap 95% confidence intervals (CIs) (1000 iterations, percentile method), precision (positive predictive value), recall (sensitivity) and F1-scores (mean of precision and recall, providing a single metric that balances both; 1= perfect precision and recall, 0 = worst). Model calibration was evaluated using Brier scores and Expected Calibration Error (ECE) computed from 10-bin reliability diagrams (Supplementary Figures 1 and 2; Supplementary Material 1, Tables S1–S2). Additional visual analyses include ROC curves (Figures 2 and 3). We note that our primary use case is risk stratification rather than precise probability estimation.
Sensitivity analyses
To evaluate the robustness of our results to assumptions regarding follow-up imaging, we conducted two sensitivity analyses. First, we retrained all models after removing the hematoma expansion (VOLUME_EXPANSION) variable entirely from the feature set. Second, we restricted the analysis to patients with confirmed follow-up CT imaging (Qatar: 699 patients; ATACH-2: 905 patients), excluding patients for whom hematoma expansion was imputed as zero. Results of both analyses are presented in Supplementary Material 1, Tables S7–S8.
Explainability
To make the models easier to understand and build clinical trust, we measured how much each variable contributed to the predictions. For tree-based models (RF and XGB), we calculated how much each feature reduced prediction error across all decision trees. For LR, we used the model’s standardized coefficients, which show the direction and strength of each feature’s effect. For the neural network, we used a permutation method that measures how predictions change when one feature is shuffled. These methods give a clear ranking of the most important predictors without changing how the models were trained, helping clinicians see which factors drive the results.
Software and tools
Models, scaler parameters and processed datasets were serialized in joblib for reproducibility, and performance metrics were aggregated into Comma-Separated Values (CSV) files. Analyses and visualizations were performed in Python (pandas, NumPy, scikit-learn, XGB, matplotlib), with additional statistical testing conducted in SPSS v27.
Standard protocol approvals, registrations and patient consents
The study was approved by the Committee for Human Ethics Research, Academic Health Service at Hamad Medical Corporation (HMC) (MRC-01-18-102). Individual patient consent was waived due to the retrospective nature of the study. The ATACH-2 database is a part of the National Institute of Neurological Disorders and Stroke (NINDS) database. Approval was obtained from the relevant authorities.
Results
Patient characteristics
There were 1660 patients with sICH admitted to HGH between 2013 and 2023. Patients remaining in the final analysis were 1099. Mean age was 49 (SD 12) years and 919 (83.6%) were male. Median GCS was 15 (IQR 11–15), and median NIHSS was 12 (IQR 5–19). Most common vascular risk factors were hypertension in 909 (82.7%), diabetes mellitus in 324 (29.5%), dyslipidemia in 282 (25.7%), coronary artery disease (CAD) in 24 (2.2%), atrial fibrillation in 14 (1.3%) and smoking in 117 (10.6%). Mean hematoma volume was 12.5 (SD 13) cm3. At 90-day follow-up, 124 (11.3%) died and 396 (36%) had poor functional outcomes.
Data were prospectively collected on 1000 non-anticoagulant-related sICH patients with supratentorial bleeds in the ATACH study. Patients with missing data were excluded from the analysis (n = 84). Mean age was 62 (SD 12) years and 562 (61.4%) were male. Median GCS was 15 (IQR 13–15), and median NIHSS was 11(IQR 6–16). Most common vascular risk factors were hypertension in 725 (79.1%), diabetes mellitus in 171 (18.7%), dyslipidemia in 223 (24.3%), CAD in 40 (4.4%), atrial fibrillation in 33 (3.6%) and smoking in 399 (43.6%). Mean hematoma volume was 13 (SD 12) cm3. At 90-day follow-up, 54 (5.9%) patients died and 342 (37.3%) had poor functional outcome. A flowchart of patient selection has been provided below (Figure 1).
Flowchart of patient selection in ATACH and Qatar databases. NIHSS = National Institutes of Health Stroke Scale; RBS = random blood sugar; anti-HTN = anti-hypertensive; anti-DM = anti-diabetic; EVD = external ventricular drain; ICU = intensive care unit; mRS = modified Rankin scale.

AUC-ROC curves of the different machine learning models created using admission-only variables. AUC = area under the curve; ROC = receiver operating characteristic; MLP = multilayer perceptron; mRS = modified Rankin scale; TPR = true positive rate.

Figure 2. Long description
The image contains twelve ROC curves arranged in a 4x3 grid, each representing different machine learning models: LogisticRegression, RandomForest, XGBoost, and MLP. Each model is evaluated across three different scenarios or test sets. Panel A: LogisticRegression. Panel B: RandomForest. Panel C: XGBoost. Panel D: MLP. Each panel contains three ROC curves, showing the true positive rate (TPR) against the false positive rate (FPR). The curves are color-coded: blue for ‘Qstar Test’ and red for ‘X/Arch Test’. The area under the curve (AUC) values are provided in the legend within each panel. The AUC values vary across the models and test sets, indicating their performance in distinguishing between classes. The diagonal line in each plot represents the line of no discrimination where the model’s predictions are no better than random guessing.
AUC-ROC curves of the different machine learning models created using both admission and inpatient variables. AUC = area under the curve; ROC = receiver operating characteristic; MLP = multilayer perceptron; mRS = modified Rankin scale; TPR = true positive rate.

Patients in the ATACH dataset were older compared to Qatari patients (62 vs 49 years, p < 0.001) and had a much higher proportion of patients older than 80 years (11.1 vs 2.9, p < 0.001). There were more men in Qatar (83.6 vs 61.4, p < 0.001). Compared to ATACH, patients in Qatar had higher blood pressure, random blood sugar levels and diabetes mellitus. ATACH patients had almost 4-fold increased odds of having a prior stroke (16.2 vs 4.5, p < 0.001) and were four times more likely to be smokers (43.6 vs 10.6, p < 0.001). There were more lobar bleeds in Qatar (19.3 vs 11.4, p < 0.001). While the initial hematoma volume was similar between both cohorts, there was a significant proportion of patients in Qatar who experienced hematoma expansion (56.2 vs 24.5, p < 0.001), and there was a decreased rate of intensive care unit (ICU) admissions in Qatar (48.7 vs 88.8, p < 0.001). A similar percentage of patients received external ventricular drains, and there was no difference in the number of hemicraniectomies (6 vs 4.1, p = 0.061). A higher proportion of patients in Qatar died at 90 days (11.3 vs 5.9, p < 0.001), whereas no difference in the rate of poor functional outcomes was noted.
These cohort differences reflect the differing inclusion criteria of the two databases. The Qatar ICH Registry is an unselected, consecutive cohort that includes all spontaneous supratentorial ICH patients, regardless of hematoma volume or presenting blood pressure. In contrast, the ATACH-2 trial required hematoma volume less than 60 mL and SBP between 180 and 240 mmHg, excluding patients with large hemorrhages and those who were normotensive at presentation. The higher 90-day mortality in the Qatar cohort (11.3% vs 5.9%) is consistent with the inclusion of more severe cases. Despite these differences, the similar rate of poor functional outcomes (36.0% vs 37.3%, p = 0.545) suggests that functional outcome prediction may generalize more readily across cohorts with different severity distributions.
Machine learning model results
In the models that were created with admission-only variables using the combined (Qatar + ATACH-2) dataset, for 90-day mortality, RF achieved the highest AUC of 0.871 (95% CI: 0.800–0.928) on the Qatar test set and 0.856 (95% CI: 0.770–0.925) on the ATACH test set. For 90-day functional outcomes, LR achieved an AUC of 0.843 (95% CI: 0.789–0.893) on the Qatar test set, while RF achieved an AUC of 0.823 (95% CI: 0.765–0.883) on the ATACH test set.
In models that were created using both admission and inpatient variables, for 90-day mortality, XGB (trained on combined dataset) achieved the highest AUC of 0.920 (95% CI: 0.873–0.958) on the Qatar test set. RF (trained on combined dataset) achieved an AUC of 0.916 (95% CI: 0.821–0.983) on the ATACH test set with the best calibration (Brier score 0.106, 95% CI: 0.090–0.123). For 90-day functional outcomes, RF and XGB (trained on combined dataset) showed comparable performance, with AUCs of 0.882 (95% CI: 0.829–0.936) and 0.882 (95% CI: 0.830–0.932) on the ATACH test set, respectively. LR remained a consistently strong performer, achieving AUC 0.890 (95% CI: 0.818–0.948) for mortality prediction on the Qatar test set (combined training), demonstrating that simpler models can compete with more complex approaches when training data are limited.
Calibration analysis revealed that LR and RF generally showed the best calibration across scenarios, while XGB tended toward slight overconfidence for high-risk predictions. MLP showed variable calibration depending on the training scenario. ECE values and calibration curves are presented in Supplementary Figures 1–2.
Feature importance results
We created feature importance graphs (Figures 4 and 5) for only the best-performing models.
Feature importance graphs of functional outcomes (mRS) and mortality for models created using admission-only variables. mRS = modified Rankin scale; NIHSSADM = National Institutes of Health Stroke Scale on admission; GCSADM = Glasgow Coma Scale on admission; STROKEHX = stroke history; INRADM = International normalized ratio on admission; APTTADM = Activated Partial Thromboplastin Time on admission.

Figure 4. Long description
The image contains two bar graphs. The first bar graph, titled ‘Feature Importance for MRS (Admission Only),’ shows the importance of various features for predicting the modified Rankin scale using admission-only variables. The features listed are NIHSSADM, AGE, GCSADM, VOLUME1, and STROKEHX. The importance values range from 0.00 to 0.35. NIHSSADM has the highest importance, followed by AGE, GCSADM, VOLUME1, and STROKEHX. The second bar graph, titled ‘Feature Importance for Mortality (Admission Only),’ shows the importance of various features for predicting mortality using admission-only variables. The features listed are GCSADM, INRADM, VOLUME1, NIHSSADM, and APTTADM. The importance values range from 0.000 to 0.200. GCSADM has the highest importance, followed by INRADM, VOLUME1, NIHSSADM, and APTTADM.
Feature importance graphs of functional outcomes (mRS) and mortality for models created using both admission and inpatient variables. mRS = modified Rankin scale; IVH = intraventricular hemorrhage; GCS = Glasgow Coma Scale; NIHSSADM = National Institutes of Health Stroke Scale on admission, GCSADM = Glasgow Coma Scale on admission; INRADM = International normalized ratio on admission.

For admission-only models predicting 90-day mortality, RF (combined dataset) performed best, with the most influential features being GCS on admission, INR on admission and baseline hematoma volume. For functional outcomes, XGB (combined dataset) was selected (performance nearly identical to RF), where NIHSS on admission was the strongest predictor, followed by age and GCS.
For admission + inpatient models, RF gave the best mortality prediction, with intubation and GCS on admission as the most important predictors. For functional outcomes, XGB performed best, with NIHSS on admission, intubation and presence of IVH emerging as the top features. Results were consistent across both Qatar and ATACH test sets.
We used ROC-AUC as the primary evaluation metric as it measures overall ability to separate positives from negatives and is threshold-independent. Class imbalance makes threshold-dependent scores (accuracy, F1) volatile. All reported AUC values include bootstrap 95% CIs to quantify uncertainty (Supplementary Material 1, Tables S1–S2).
Sensitivity analyses confirmed the robustness of our primary findings. When the hematoma expansion variable was removed from the feature set entirely, AUC values remained stable across all models (Supplementary Material 1, Table S7). For example, RF (combined training, mortality) achieved an AUC of 0.913 (95% CI: 0.864–0.955) on the Qatar test set without hematoma expansion, compared to 0.882 (95% CI: 0.822–0.929) in the primary analysis. When the analysis was restricted to patients with confirmed follow-up imaging, results were consistent with the primary analysis for ATACH-trained models, with modest attenuation in Qatar-only models attributable to the approximately 36% reduction in sample size (Supplementary Material 1, Table S8). These findings indicate that model performance is not overly dependent on the follow-up imaging assumption.
Discussion
Among the different ML models tested, RF demonstrated the most balanced performance, achieving high metrics across both mortality and functional outcomes. When comparing the models trained exclusively on Qatari data versus those trained on the combined dataset (Qatar + ATACH), the combined dataset models generally showed improved generalization. This is an interesting observation given our datasets were very diverse, with patients from multiple ethnicities, diverse backgrounds and having different risk profiles, as shown in Table 1. We also compared models trained on admission-only versus both admission and inpatient variables to demonstrate the improved accuracy that can be achieved if we also take into account inpatient variables.
For mortality prediction, the RF model trained on the combined (Qatar and ATACH) dataset demonstrated superior AUC compared to the model trained only on Qatari data. For functional outcome prediction, a similar trend was observed. The RF model trained on the combined (Qatar and ATACH) dataset had improved prediction and so did the XGB model trained on the combined dataset (Supplementary Material 1, Table S1). LR maintained competitive performance across datasets, whereas MLP showed notably weaker cross-data generalization. The fact that the models that were trained on the combined dataset performed better indicates that models that are trained on a more diverse patient population capture broader underlying clinical patterns and enhance their applicability to diverse patient populations. Since our models performed excellently in both mortality and functional outcome prediction, and an increasing number of ICH patients are surviving the index event given advancements in medical and surgical care and are subsequently going on to receive rehabilitation, using ICH prediction models to predict functional outcomes can help us direct resources toward patients that need it most.
Hall et al. trained ML models on data from two different hospitals to ensure generalizability of their models. They harmonized the variables needed for training the ML models between both institutions. They did that as ML algorithms mandate identical variables across training and testing samples and there is not a standardized set of variables collected on all ICH patients at every institution. Since increasing studies now involve data from multiple institutions, and that data need harmonization across institutions, it is imperative that we mandate reporting the timing of when important interventions in ICH patients take place, such as the timing of when hematoma expansion is noted on repeat CT Head, timing of hemicraniectomy, timing of EVD insertion, etc. These authors showed that decision tree and RF consistently identified variables that predict 2-week and 3-month functional outcomes post-ICH, with the GCS score, age, hematoma volume, hematoma expansion and IVH being the most important variables associated with outcome prediction. While we also showed that RF is a model that is accurate for outcome prediction, we are able to say it with more confidence given our large sample size and using mRS as the primary outcome rather than disposition. Reference Hall, Weaver and Liotta15 Trevisi et al. created an RF model for predicting 6-month mortality and functional outcome and demonstrated high discriminative ability with AUCs of 0.96, 0.89 and 0.93 for predicting death, poor and good outcomes, respectively, in a cohort of elderly ICH patients, mean age 79.85 (± 6.35). 494 (61%) patients were using anticoagulants and/or antiplatelets prior to ICH onset, and since one of the limitations of the current study was not being able to include patients who were on antiplatelet or anti-coagulation, Trevisi was able to prove the utility of the RF model in both anticoagulant- and non-anticoagulant-related ICH. Reference Trevisi, Caccavella and Scerrati16 We extend the utility of the RF model to both young and old patients with ICH, further increasing the generalizability of this specific model. Fernandez-Lozano et al. Reference Fernandez-Lozano, Hervella and Mato-Abad17 also confirmed that the RF model was an accurate ML approach when predicting outcomes in both ischemic strokes and ICH. However, an important limitation of the study was that they did not compare different ML models. Wang et al. compared 39 ML models to predict 1- and 6-month good functional outcomes (defined as mRS 0–2) in a younger cohort of sICH patients and showed that the RF model was the most accurate for prognostication. They however did not share what other ML models were used. Reference Wang, Hsu and Lee18 Rui Guo et al. however demonstrated the superiority of LR (AUC = 0.890) over other ML models (CatBoost, XGB, RF and support vector machine) for predicting 3-month functional outcomes. Reference Guo, Zhang and Liu19
While admission factors have been used traditionally for prognostication purposes and used in common scores such as the oICH score, Reference Hemphill, Bonovich and Besmertis20 the impact of variables that could change throughout the course of the hospitalization has not been studied widely when it comes to outcome prediction. For example, hematoma expansion is an important predictor of outcomes, Reference Abou Karam, Chen and Zeevi21 and that is something that cannot be measured at admission. It is important to consider these factors in prognostication as we know that we should not anchor on the initial ICH score, at least in part due to the self-fulfilling prophecy. Even in clinical practice, we tend to look at the entire clinical picture of the patient when communicating with families, but an important shortcoming during our conversations is the absence of percentages or numbers to guide us. In order to overcome this shortcoming, we compared models that were created on both admission and inpatient variables with models that were created solely on admission variables. The inpatient events that were used for model training included EVD insertion, hemicraniectomy, ICU care, IVH and hematoma status on repeat CT. We saw improvement in performance metrics, and while the improvement seen in the performance of ML models might not seem that significant numerically, in terms of prognostication, even a 3% improvement in a model’s accuracy is significant.
We then performed feature importance. For models created using admission-only variables, GCS, INR and hematoma volume on admission were important features for 90-day mortality, whereas NIHSS, age and GCS on admission were important features for 90-day functional outcomes. In the models created using both admission and inpatient variables, intubation status and GCS on admission had the highest feature importance for 90-day mortality, whereas NIHSS on admission, intubation status and presence of IVH had the highest feature importance for 90-day functional outcomes. Volume expansion was also predictive of outcomes. Some studies have recently shown the benefit of the incorporation of inpatient factors in outcome prediction. A pooled analysis of the Efficacy and safety of minimally invasive surgery with thrombolysis in intracerebral haemorrhage evacuation (MISTIE-3) and Clot Lysis Evaluating Accelerated Resolution of Intraventricular Hemorrhage-3 (CLEAR-3) trials demonstrated that in addition to baseline ICH and IVH volumes, hospital complications such as acute ischemic stroke, cerebral hypoperfusion (cerebral perfusion pressure <60 mmHg), sepsis, chronic hydrocephalus, need for G-tubes and prolonged mechanical ventilation in the first 30 days were all associated with reduced likelihood of long-term functional improvement at the 1-year follow-up visit. The AUC for the model using ICH severity factors alone was 0.755 (95% CI: 0.710–0.800) compared with an AUC of 0.868 (95% CI: 0.834–0.902) for the model with added in-hospital events. Reference Shah, Thompson and Yenokyan22 A recent analysis of the Ethnic/Racial Variations of Intracerebral Hemorrhage (ERICH) study similarly showed that the occurrence of infection, treatment of elevated intracranial pressure and need for tracheostomy during inpatient stay were independently associated with 3-month outcomes. Reference Woo, Comeau and Venema23
Current treatment for ICH involves bundled care, involving blood pressure lowering, anticoagulant reversal, hematoma evacuation and strategies to reduce secondary brain damage due to edema and intracranial hypertension. Reference Li, Yakhkind and Alexandrov24 While all of these treatment strategies are useful at different time points during the course of the hospitalization, there are no mandated time metrics that need to be reported once a patient with ICH presents. If code-ICH 24 is implemented and the timing of important interventions is noted, we can have standardized data for analysis. This can then allow for ML models to be trained on that data and be deployed. A great benefit of ML models is their ability to capture complex interactions among predictor variables, capture nonlinearities, handle data from multiple institutions via federated learning and incorporate new data in real time. Reference Alpaydin25 The TrustStroke project 26 in Europe is one such example that is using a federated learning platform to train ML models with data from multiple institutions for ischemic stroke, allowing for formulation of individualized treatment plans. The ability to predict functional outcomes for ICH patients could prove very useful and aid in communication with the patient’s family. While an argument for using admission-only variables is true in certain situations, such as triaging in resource-limited settings (where every patient cannot be sent to the ICU or transferred to the comprehensive stroke center (CSC), that same premise should not hold true when we move the conversation from triaging to prognostication, where the more data points we have, the better it is. After all, the ICH score was proposed to provide information and assess treatment benefits and risks for patient families rather than to use it for prognostication. Reference Massad, Zhou and Manolovitz12
Conclusion
Training on the Combined Qatar + ATACH cohort yields models that generalize reliably to the external test population. For 90-day mortality, RF achieved an AUC of 0.916 (95% CI: 0.821–0.983) on the ATACH test set, while XGB achieved an AUC of 0.920 (95% CI: 0.873–0.958) on the Qatar test set. For 90-day functional outcomes, RF and XGB achieved an AUC of 0.882 on the ATACH test set with overlapping CIs. LR remained a robust fallback across all scenarios. Models created using both admission and inpatient variables outperformed models created using admission-only variables and revealed important markers of prognostication via feature importance. Sensitivity analyses confirmed that these results are robust to assumptions regarding follow-up imaging availability. Our study design mirrors a real-world deployment scenario in which a model developed at a single center is applied to external cohorts, while still preventing information leakage from test data.
Strengths and Limitations
Some strengths of our study are that the Qatar Stroke Database is a prospectively collected database of all stroke patients who present in the state of Qatar. ATACH-2 was a randomized controlled trial and hence had prospective clinical assessment of all patients. We performed extensive comparisons to reveal robust markers of prognostication, comparing models derived via different approaches.
Some limitations are as follows. We did not have long-term data available (180 days or 360 days). Better functional outcomes have been observed at 6 months and at 360 days. Functional Trajectory from Day 30 to Day 365 of CLEAR-3 Reference Hanley, Lane and McBee27 and MISTIE-3 Reference Hanley, Thompson and Rosenblum28 cohorts showed significant improvement in mRS for all time points. Our study was limited to non-anticoagulated patients with supratentorial sICH, and therefore, the present findings may not be generalizable to all patients with ICH. We acknowledge that the missingness rates differed between cohorts, particularly for follow-up CT imaging (36.4% missing in Qatar vs 1.2% in ATACH-2 (Supplementary Material 1, Table S5). Our sensitivity analyses demonstrate that model performance is robust to this differential missingness: removing the hematoma expansion variable entirely or restricting the analysis to patients with confirmed follow-up imaging yielded consistent results (Supplementary Material 1, Tables S7–S8). We also acknowledge that imputing follow-up scans as no change if not available does not accurately represent both datasets.
An important consideration is the evolving treatment landscape for ICH. Recent trials evaluating minimally invasive hematoma evacuation such as Trial of Early Minimally Invasive Removal of Intracerebral Hemorrhage (ENRICH) Reference Pradilla, Ratcliff and Hall29 have demonstrated potential benefit for selected ICH patients. Our models were developed using cohorts managed prior to the widespread adoption of these surgical techniques, and the present findings may not be generalizable to patients undergoing minimally invasive evacuation. As these procedures become integrated into clinical practice, the prognostic factors and their relative importance may shift. Future work should evaluate whether our models require retraining or recalibration as treatment paradigms evolve. Regarding model calibration, our analysis revealed that while discrimination (AUC) was generally strong across models, calibration varied. LR and RF showed the best calibration, while XGB and MLP showed variable calibration across scenarios.
Supplementary material
The supplementary material for this article can be found at https://doi.org/10.1017/cjn.2026.10671.
Data availability statement
Original data from Qatar is available and can be accessed by direct request from Dr Naveed Akhtar at naveedakhtars@hotmail.com. Anonymized data from ATACH-2 are available through the NINDS Archive of Clinical Research Datasets and can be accessed at https://ninds.nih.gov. Code can be made available upon reasonable request.
Author contributions
A.A. – writing, reviewing and editing, conceptualization. U.T. – reviewing and editing, statistical analysis. H.A. – writing and reviewing. N.A. – reviewing and editing. A.Q. – reviewing and editing. A.S. – writing, reviewing and editing, conceptualization.
Funding statement
This research received no specific grant from any funding agency in the public, commercial or not-for-profit sectors.
Competing interests
The authors declared no potential conflicts of interest with respect to the research, authorship and/or publication of this article.
Ethics approval
The study was approved by the Committee for Human Ethics Research, Academic Health Service at HMC (MRC-01-18-102). Individual patient consent was waived due to the retrospective nature of the study. The ATACH-2 database is a part of the NINDS database. Approval was obtained from the relevant authorities.




Target article
A Comparison of Machine Learning Models for ICH Prognostication: An Analysis of ATACH-2 and Qatar Stroke Database
Related commentaries (1)
Reviewer Comment on Ali et al. “A Comparison of Machine Learning Models for ICH Prognostication: An Analysis of ATACH-2 and Qatar Stroke Database”