


Introduction
Electoral institutions present the very core of a democratic political system as they affect voter, candidate, and party behavior and eventually transform votes into parliamentary representation (Gallagher and Mitchell, Reference Gallagher and Mitchell2005: 3; Farrell, Reference Farrell2011: 1). An evaluation of these elementary democratic institutions is therefore a key objective of political science. The focus with improving design typically lies on the question of how to satisfy the competing demands of providing proportional representation (PR) and facilitating accountable government via a concentrated party system – the representativeness–accountability trade-off (Carey and Hix, Reference Carey and Hix2011: 385). While plurality systems are typically associated with single-party governments and PR systems with high representativeness, both often perform poorly with regard to the respective other dimension. Therefore, a desirable solution is not only to balance these two demands but to provide both of these functions to a satisfactory degree and thereby reach a superior middle-ground in electoral system design (see originally Lijphart, Reference Lijphart1984). However, while there are general hopes as well as outright recommendations for general types of systems – mixed-member electoral systems (e.g. Shugart, Reference Shugart2001; Shugart and Wattenberg, Reference Shugart and Wattenberg2001; Birch, Reference Birch2003) or, most recently, PR systems with a moderate district magnitude (Carey and Hix, Reference Carey and Hix2011) – a thorough empirical test of such competing claims is still lacking. Existing analyses either focus only on a subset of electoral systems and the concentration dimension (Kostadinova, Reference Kostadinova2002; Nishikawa and Herron, Reference Nishikawa and Herron2004) or on one specific technical element (typically district magnitude; Lijphart, Reference Lijphart1994; Cox, Reference Cox1997; Carey and Hix, Reference Carey and Hix2011), and none directly investigate the role of different combinations of technical details. Following the study by Carey and Hix (Reference Carey and Hix2011) who were the first to explicitly investigate the (shape of the) proportionality–concentration trade-off in a large-n assessment, this paper seeks to thoroughly contribute to the research question by investigating all types of electoral systems and by understanding them both as general types as well as the sum of their technical features. This holistic approach allows us to reach very specific conclusions about how the precise institutional setup of an electoral system affects the likelihood of attaining desirable levels of proportionality and concentration. By looking carefully at the combinations of various technical details such as district magnitude, legal threshold, tier linkage, and the level of compensation in mixed-tier electoral systems, this paper explores whether instead of just one ‘sweet spot’ (Carey and Hix, Reference Carey and Hix2011) there are potentially multiple promising electoral system designs. This importantly also includes an assessment of which technical features are safer and which are riskier tools in aiming for a superior middle-ground in electoral system design.
The paper proceeds as follows. First, we will revisit the quest for optimal performance with regard to both proportionality and concentration and map out the different arguments as to which electoral system designs are expected to do well in aiming for a superior middle-ground. In a next step, we highlight the importance of moving from a more general level of different types of systems to the level of technical details, also accounting for the fact that similar general electoral system types might be based on different technical specifications. After a discussion of our data, the variables we use and how we approach key methodological challenges, the empirical analysis of 590 elections in 57 countries will test which electoral system types and details lead to differences in their eventual performance. The conclusion summarizes the results and provides clear implications as to which and how different technical elements can be useful tools for reaching an efficient outcome along the trade-off between proportionality and concentration.
Successfully balancing proportionality and concentration: general design propositions
The biggest challenge for electoral system designers typically is to satisfy demands with respect to the competing general goals of proportionality and concentration (Nohlen, Reference Nohlen1984; Powell, Reference Powell2000; Raabe and Linhart, Reference Raabe and Linhart2012; Raabe, Reference Raabe2015). While other functions and qualities of electoral systems, such as personal representation, democratic legitimacy, and understandability, are not of minor importance, these demands do not contradict each other and may be fulfilled simultaneously. On the contrary, proportionality and concentration form the key trade-off in electoral system design: the more proportional an electoral system is, the less it can concentrate the party system and vice versa. Hence, the search for a superior middle-ground with respect to these goals is most pressing (initially Lijphart, Reference Lijphart1984; also see Shugart and Wattenberg, Reference Shugart and Wattenberg2001; Carey and Hix, Reference Carey and Hix2011).
Proportionality primarily focuses on accurate representation of voter groups within the parliament. The main idea behind this principle is that parliamentary representation mirroring the sizes of voter groups can be considered as fair. This principle also includes that minority groups should get realistic chances for parliamentary representation. The advantage of concentrated party systems, on the other hand, is that government formation is connected more strongly to the voters’ choice. In the clearest cases, one single party wins a majority of seats and forms a government – and thus can be held responsible for its performance in the upcoming elections. The more fragmented a party system is, the less clear it becomes who is an election winner and the more government formation depends on coalition bargaining between parties instead of election results. At the same time, more fragmented party systems generally lead to more parties in government so that single parties in government can be held accountable by the voters only partially (Powell, Reference Powell2000).Footnote 1
As polar design options, pure PR electoral systems are associated with highly representative parliaments that allow for a more nuanced representation of the electorate, while plurality electoral rules are associated with the creation of accountable single-party governments (Duverger, Reference Duverger1954; Rae, Reference Rae1967; Farrell, Reference Farrell2011). However, PR systems typically fail to concentrate the party system in order to enable swift government formation and plurality systems fail to provide accurate representation and to account for minority interests (Shugart, Reference Shugart2001). So far, the literature has come up with two general design propositions for achieving a superior balance of proportionality and concentration.
The first general approach is to combine the elements of both pure system types in mixed-member electoral systems (Lijphart, Reference Lijphart1984: 207; Shugart and Wattenberg, Reference Shugart and Wattenberg2001; Birch, Reference Birch2003). Spurred by the success story of the German mixed-member system (Kaase, Reference Kaase1984; Nishikawa and Herron, Reference Nishikawa and Herron2004: 767; Saalfeld, Reference Saalfeld2005), the high expectations for these systems led to a wave of electoral reforms to mixed-member electoral systems in the late 1980s and early 1990s (e.g. in New Zealand, Japan, Venezuela, and a plethora of Eastern European and South East Asian countries; see Massicotte and Blais, Reference Massicotte and Blais1999; Ferrara et al., Reference Ferrara, Herron and Nishikawa2005: 1–14). The argument for why mixed-member systems should be able to provide for both high levels of proportionality and concentration is that the presence of elections in single-member districts should focus party competition on two main parties with which a few smaller parties are associated in political blocs (see Shugart and Wattenberg, Reference Shugart and Wattenberg2001; Kostadinova, Reference Kostadinova2002: 25; D’Alimonte et al., Reference D’Alimonte, Grofman and De Sio2012). As this is largely a psychological, coordinating effect, election outcomes should still remain fairly proportional in these systems. This general idea was initially upheld notwithstanding the technical specification of the mixed-member electoral system (Shugart, Reference Shugart2001; Shugart and Wattenberg, Reference Shugart and Wattenberg2001). After a first period of empirical evaluation, the mixed-member proportional (MMP) type (in which disproportionalities arising in the plurality tier are compensated by the PR tier) has received much more acclaim than the mixed-member majoritarian (MMM) type where both tiers operate independently (see Nishikawa and Herron, Reference Nishikawa and Herron2004: 767; Bowler et al., Reference Bowler, Farrell and Pettitt2005; Gallagher, Reference Gallagher2005: 575; Farrell, Reference Farrell2011: 108). We thus denote the first general proposition as to which design approach should reach a superior middle-ground in electoral system performance.
Mixed-member system proposition Mixed-member electoral systems are best able to successfully provide both proportionality and concentration. Especially MMP electoral systems are expected to provide such successful balance.
The second general approach is to apply a PR electoral system but with moderate district magnitudes (Carey and Hix, Reference Carey and Hix2011). The argument why this electoral system design should provide for a superior balance of proportionality and concentration is similar to the one for mixed-member electoral systems: moderate district magnitudes (between three and nine) mark the ‘sweet spot’ in electoral system design as they allow for a vastly improved degree of representativeness compared to plurality systems in single-member districts but still put pressure on voters and parties to coordinate on the most viable candidates (Carey and Hix, Reference Carey and Hix2011; also see Cox and Shugart, Reference Cox and Shugart1996). Carey and Hix (Reference Carey and Hix2011) focus on the core technical element of district magnitude and its coordination effects (as do Lijphart, Reference Lijphart1994; Cox, Reference Cox1997) but eventually turn their argument into a sweeping general design advice. We therefore denote the second general proposition as to how to reach a superior balance of proportionality and concentration.
Moderate magnitude PR proposition PR electoral systems with moderate district magnitudes are best able to successfully provide both proportionality and concentration.
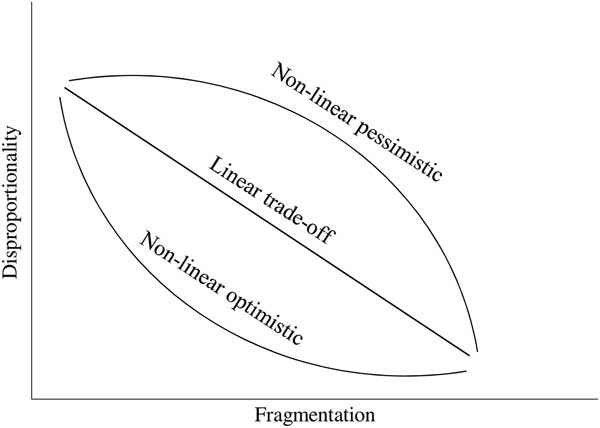
The above has solely focused on how mixed-member and moderate magnitude PR systems might lead to an improved electoral system performance considering the trade-off between proportionality and concentration. However, several researchers highlight that the opposite may well be true in that mixed-member electoral systems could also lead to perverse effects and a combination of pure systems’ weaknesses (see Sartori, Reference Sartori1997: 74–75; Monroe, Reference Monroe2003). The same is possible for PR systems with moderate district magnitudes as these could disturb proportionality to a substantial degree but still fail to concentrate the party system in cases where party system nationalization is low and different parties compete in different districts (see Cox, Reference Cox1997, Reference Cox1999; Morgenstern et al., Reference Morgenstern, Swindle and Castagnola2009). Thus, the empirical analysis will also assess in how far the propositions risk undesirable performances with regard to proportionality, concentration, or even both. Figure 1 (based on Carey and Hix, Reference Carey and Hix2011; Linhart, Reference Linhart2009) depicts three possible shapes of the trade-off between reducing party system fragmentation (i.e. concentrating the party system) and disturbing the proportionality of parliamentary representation. The trade-off would be completely linear if there was no real potential for a superior middle-ground in electoral system design – every improvement in one dimension would cause a disruption in the other. As suggested by the two general propositions above, the trade-off might be non-linear, performing well with regard to both proportionality and concentration for electoral systems combining incentives from pure types (also see Taagepera and Shugart, Reference Taagepera and Shugart1989). However, as implied by the potential riskiness of adopting such systems, a non-linear trade-off could also work in the opposite way suggesting sub-par performances in both dimensions.
Promises and pitfalls of aiming for a superior balance.
The underappreciated role of (combinations of) technical details
The proposition of general types of systems is certainly necessary to categorize electoral systems but to a certain degree can block our view on the different combinations of technical components that are subsumed under these general types. Obviously, it would be of great help if general types of electoral systems could be categorized as to how they perform along the lines of the proportionality – concentration trade-off and this would then lead to clear-cut implications for electoral reform. However, these sweeping design propositions suggest a design-uniformity that simply is not given in the world of electoral systems. Electoral systems are – technically spoken – combinations of different mathematical tools, and variations in the performance of electoral systems might be caused by more subtle differences in their technical setup than suggested by their general types. It is thus critical to move from the level of fundamental type differences between electoral systems to that of technical details. Table 1 presents an overview of those details that are relevant to the proportionality–concentration trade-off. First, the district magnitude – arguably the most prominent tool to move electoral systems between the worlds of plurality and PR (Lijphart, Reference Lijphart1994; Carey and Hix, Reference Carey and Hix2011) – allows for nuanced design as lowering district magnitude leads to a lower number of viable parties (Cox, Reference Cox1997). Second, a similar effect might arise from employing legal thresholds that restrict parliamentary representation to those parties accumulating a certain share of the total votes. Third, electoral systems might either use a specific plurality rule or a specific PR method for seat allocation in pure systems. It is, however, also possible to allocate a subset of parliamentary seats according to the first and the rest according to the other type of allocation rule. The latter is done in all mixed-member electoral systems with the share of seats allocated under each formula being an important mechanism for steering the electoral system between outcomes closer to those of simple plurality or full-bore PR systems. Finally, additional tiers may be used to compensate for disproportionalities arising in other tiers. For mixed-member electoral systems, the question of whether the second tier of PR seats is used to compensate for the results in the single-member district tier is critical and sometimes overlooked when mixed-member systems are treated as a coherent group. MMM systems have no such compensatory linkage while MMP systems do (Massicotte and Blais, Reference Massicotte and Blais1999). Furthermore, the degree of compensation that is possible is vital – if there are many PR seats available to compensate for disproportionalities, full compensation may be achieved. Note that, especially for mixed-member systems, formula and compensation are not one and the same. Deciding how many seats are allocated under which formula is one detail question, another is whether the subset of seats allocated via PR is used to compensate for disproportionalities arising from the seat allocation according to the plurality formula or not. The distinction between formula and compensation is further highlighted by the fact that PR systems (using only a PR formula) with multiple districts can have an additional (national) tier of seats that aims at correcting the disproportionalities arising from PR allocation within smaller multi-member districts (‘national top-up seats’; Rose, Reference Rose1983: 38).
Technical details of electoral systems

PR=proportional representation.
Based on Raabe and Linhart (Reference Raabe and Linhart2012: 508).
a Of course, a high legal threshold does not say that an electoral system is of the simple plurality type, however, high thresholds lead to the same type of structural effects favoring the (two) largest parties.
All of these technical elements are thus highly useful in moving an overall design closer to plurality or PR rules as well as for trying to reach intermediate positions on the proportionality–concentration trade-off. What becomes apparent immediately is that the sorting of electoral systems into different general types appears to build on only one (at best two) technical elements. Mixed-member systems do make use of both plurality/majority and PR formulas. However, they may vary in whether or not they are compensatory mixed-member systems, the height of their legal threshold for the seat allocation in the PR tier, and the district magnitudes. While for mixed-member systems a differentiation between MMM and MMP is now commonplace, this distinction can still mislead. An MMM system with relatively few single-member districts is likely to perform more like a pure PR system than an MMP system where only a few PR seats are available for compensation (see Bochsler, Reference Bochsler2012). Similarly, PR systems with moderate district magnitudes might also additionally employ a legal threshold or a compensatory tier. By only looking at general types, researchers run the risk of neglecting other technical elements which may point to an overall technical design that is not described properly by the type variable. Kostadinova (Reference Kostadinova2002, 31) underlines this argument when she states that the legal threshold is a ‘powerful mechanism for reducing fragmentation in the assembly […] without changing the fundamentals of the system itself’ and its importance might often go unnoticed due to its relative independence from general system types. As a consequence, it remains unclear why exactly experts favor the MMP system type (Bowler et al., Reference Bowler, Farrell and Pettitt2005) – potentially because the reason is not so much type – as it is detail related and experts prefer an MMP system with a 5% legal threshold as applied in Germany and New Zealand (Bowler and Farrell, Reference Bowler and Farrell2006: 450). We thus propose to take all relevant technical details into account and assess general propositions and design advice based on different possible technical specifications on the detail level.
Technical details proposition We expect that the share of single-member districts, the district magnitude, the legal threshold, and the level of compensation each exert individual effects on the propensity of an electoral system to successfully provide both proportionality and concentration.
Taking this proposition of paying close attention to the detail level seriously should lead to multiple benefits: first, unlike with general type propositions, this perspective does not unnecessarily narrow the scope of possibly attractive design options by focusing too heavily on one specific technical element that is fundamental to the respective type definition. This should also lead to less noisy results caused by the potentially unwarranted inclusion of fairly different systems into the same general type category. Second, the detail-level approach should lead to more clear-cut implications by allowing for inferences regarding very specific design options. And finally, as concerns shaping the trade-off between proportionality and concentration into a desirable direction, it will be crucial to differentiate between those technical details that are safer and those that are riskier tools for doing so. Accordingly, the empirical analysis will consider both the possibility of there being multiple ‘sweet spots’ instead of just one (Carey and Hix, Reference Carey and Hix2011) as well as the problem of design pitfalls.
Data, variables, and methodological challenges
Our data set consists of 590 elections in 57 countries after 1945. Relying on existing data sources such as Dawn Brancati’s Global Elections Database (Brancati, Reference Brancati2015), Adam Carr’s Election Archive (Carr, Reference Carr2015), different volumes (co-)edited by Nohlen (Nohlen, Reference Nohlen1999, Reference Nohlen2005; Nohlen and Stöver, Reference Nohlen and Stöver2010), and official election statistics from the respective national institutions we compiled complete election results for a large number of competitive elections.Footnote 2 Information about the precise technical design of these systems partly come from Bormann and Golder (Reference Bormann and Golder2013) but were updated substantially in order to also cover the legal threshold on the national level (for which we consulted and amended the data from Beck et al., Reference Beck, Clarke, Groff, Keefer and Walsh2001) and the exact share of seats allocated in single-member districts. Based on these data we are able to sort electoral systems into general types and, in a second step, to disaggregate them into their technical details as listed in Table 1. We present summary statistics of our data set in online Appendix A which shows that the data set includes many elections under mixed-member electoral systems (21% of all elections) and that there is quite a lot of variation in the share of single-member districts among electoral systems as well as regarding the presence of compensation mechanisms (compensation via a PR tier in an MMP electoral system or via a national top-up tier in an otherwise PR system). Similarly, there is a lot of variation with respect to district magnitude and the height of the legal threshold. The empirical analyses will make full use of these variations in estimating electoral system effects.
In order to be able to control for sociopolitical scope conditions we added several variables relating to the overall political system such as the level of presidential power (Doyle and Elgie, Reference Doyle and Elgie2016), ethnic heterogeneity (Fearon, Reference Fearon2003), and whether a country is politically decentralized, providing elected sub-national governments with policy-making authority (Brancati, Reference Brancati2008; Hooghe et al., Reference Hooghe, Marks and Schakel2010). More context variables relating to the level and age of democracy come from the Polity IV data set (Marshall et al., Reference Marshall, Gurr and Jaggers2014). Finally, additional characteristics of a country’s overall institutional setup are added from the Database of Political Institutions (Beck et al., Reference Beck, Clarke, Groff, Keefer and Walsh2001).
Turning to the dependent variables – the level of proportionality and the degree of concentration of the party system – we use the two most widely applied measures in electoral system research in order to be able to directly compare our conclusions regarding the usefulness of type-based electoral system evaluations vis-à-vis detail-based evaluations with the conclusions of existing studies based on these measures (e.g. Lijphart, Reference Lijphart1994; Kostadinova, Reference Kostadinova2002; Nishikawa and Herron, Reference Nishikawa and Herron2004; Gallagher and Mitchell, Reference Gallagher and Mitchell2005; Carey and Hix, Reference Carey and Hix2011). We measure the level of proportionality with the least squares index (LSI; Gallagher, Reference Gallagher1991) that provides a measure of how disproportional the distribution of parliamentary seats is compared to the distribution of vote shares:
 ${\rm LSI{\,\equals\,}}\sqrt {\mathop{\sum}\limits_p {{{\left( {s_{p} {\minus}v_{p} } \right)^{2} } \!\mathord{\left/ {\vphantom {{\left( {s_{p} {\minus}v_{p} } \right)^{2} } 2}} \right. \kern-\nulldelimiterspace} 2}} } $
, where s
p
denotes the seat share of a party p and v
p
its vote share).Footnote
3
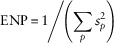
When it comes to the concentration of the party system we apply the ‘effective number of parties’ (ENP) measure based on parliamentary seat distributions (Laakso and Taagepera, Reference Laakso and Taagepera1979):
 ${\rm ENP}{\,\equals\,}{1 \!\mathord{\left/ \!{\vphantom {1 {\left( {\mathop{\sum}\limits_p {s_{p}^{2} } } \right)}}} \right. \kern-\nulldelimiterspace} {\left( {\mathop{\sum}\limits_p {s_{p}^{2} } } \right)}}$
. This measure gives an intuitive account of the fragmentation of the party system in displaying the number of hypothetical equal-sized parties and implies the likely size of governing coalitions. The ENP has quite clear implications for how easily governments may be formed and how stable they will be (e.g. Powell, Reference Powell2000) as well as whether voters will be able to hold governments accountable by assigning responsibility (e.g. Hobolt et al., Reference Hobolt, Tilley and Banducci2013). The higher the ENP, the more difficult it becomes to achieve aforementioned goals. In this way the ENP not only provides a comprehensive overview of the party system structure but also is a proven – albeit indirect – measure of the governability and accountability dimension (also see Carey and Hix, Reference Carey and Hix2011). In using the LSI and ENP we thus rely on well-established measures of proportionality and concentration that have also been linked theoretically as well as empirically to other important qualities of electoral systems and democracies as a whole.
A cross-country analysis of electoral systems is always confronted with the key challenge that (large-scale) electoral reforms are rare and thus electoral system variables are usually rather stable over time. Hence, the typical use of country fixed effects in order to capture effects specific to single countries is not feasible here because such models would not be able to provide coherent estimates of electoral system effects (Greene, Reference Greene2011).Footnote 4 The key problem with the fixed effects approach is that due to the relative time-invariance of electoral system variables, there is a high level of multicollinearity between country dummies, and electoral system variables and estimates in that case become unstable and unreliable as it is unclear whether electoral system effects are picked up by electoral system variables or country dummies (also see Bell and Jones, Reference Bell and Jones2015). Thus the results of our paper have to be understood to be based heavily on the cross-sectional variation within our data set. By including multiple sociopolitical control variables (see above) into our statistical models we capture some general differences between countries without using country fixed effects.
Empirical analysis
Our empirical part relies on two types of tests: first, we investigate the impact of different electoral system designs on both dimensions – proportionality and concentration – separately. Second, we use logit regression models to predict whether an electoral system will perform well (better than the median outcome; also see Carey and Hix, Reference Carey and Hix2011: 393) in both dimensions simultaneously.
The general design propositions
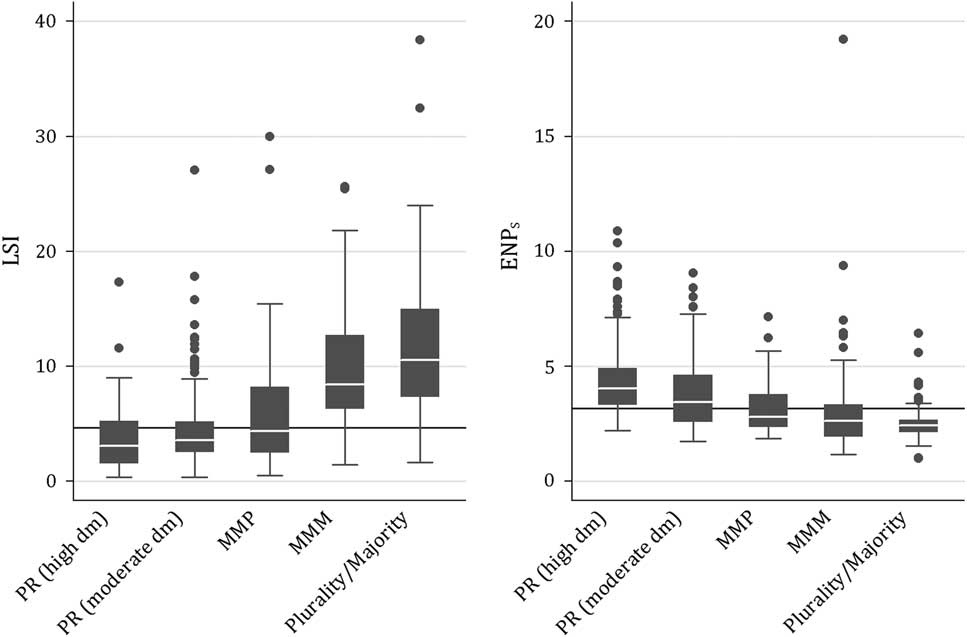
Starting with an investigation of general electoral system types, Figure 2 splits electoral systems into five categories: PR with high mean district magnitude (10 or above),Footnote 5 PR with moderate district magnitudes (below 10), MMP and MMM systems, and plurality/majority systems where all seats are contested in single-member districts (SMDs). We show boxplots for all general designs with regard to ENP and LSI. The horizontal lines represent the respective median outcomes considering all observations in the data set. While PR systems, generally, are associated with the lowest LSI and highest ENP values, we see differences between PR systems with moderate and high district magnitudes. These discrepancies are more striking for party system concentration which is a first hint that there could be a better trade-off between the two dimensions in moderate district magnitude PR systems. Turning to the two design options of the mixed-member proposition, we further clearly see how the two different types differ starkly with regard to their level of proportionality – with MMP systems, as expected, leading to much more proportional outcomes. MMM systems, however, are connected with lower levels of party system fragmentation. Yet, the latter difference in the concentration dimension is less pronounced. Thus, Figure 2 suggests that – in line with the more recent suggestions about mixed-member systems – the MMP design, too, could very well be able to provide for both PR and a sufficiently concentrated party system. MMP is the only general system type for which the median outcomes in both dimensions lie below the overall median outcomes.Footnote 6 The MMM variant, on the other hand, seems more akin to the pure plurality design in how it shapes the party system.
Performance of system types in separate dimensions. LSI=least squares index; ENP=effective number of parties; PR=proportional representation; dm=district magnitudes; MMP=mixed-member proportional; MMM=mixed-member majoritarian.
Considering the performance in both dimensions simultaneously, the scatterplot in Figure 3 helps us get a better idea of whether the general differences suggested by Figure 2 hold up.Footnote 7 The cross hairs are based on the overall medians in both dimensions and provide a benchmark with which to distinguish between doubly good performance (lower-left quadrant), especially weak performance (upper-right quadrant), and one-sided performance (remaining quadrants). Accordingly, Table 2 provides an overview of how often doubly good, doubly bad performances, or good performance in one and bad performance in the other dimension are reached under different general designs. Corroborating the results presented in Figure 2, MMP systems as well as PR systems with moderate district magnitude often combine desirable results in both dimensions (they appear fairly often in the lower-left quadrant and the regions close to it). As both these systems lead to doubly good performance above average and much more often than to doubly bad performance, Table 2 suggests that both these general designs are able to realize a non-linear trade-off that sees good performance in both dimensions. Elections under MMM rules are scattered all over Figure 3, implying that MMM systems are unlikely to provide for a successful balance of proportionality and concentration on a consistent basis – Table 2 even suggests that MMM systems are relatively prone to lead to worst of both worlds outcomes. Unsurprisingly, highlighted by Figure 3 and Table 2, plurality/majority systems and PR systems with high district magnitude usually perform well in one and badly in the other dimension. That PR systems with high district magnitudes are also frequently found to perform badly in both dimensions can be explained sensibly only by considering technical details such as legal thresholds.
Overall performance of different general designs. LSI=least squares index; ENP=effective number of parties; PR=proportional representation; dm=district magnitude; MMP=mixed-member proportional; MMM=mixed-member majoritarian.

General designs and their performance

PR=proportional representation; dm=district magnitudes; MMP=mixed-member proportional; MMM=mixed-member majoritarian.
Percentages provided in parentheses are row percentages rounded to the nearest whole number.
In order to confirm the above results, we use a logit regression with a dependent dummy variable equaling one if an election is both more proportional and more concentrated than the median election. Controlling for the level and age of democracy, the level of presidential power, political decentralization, and ethnic heterogeneity, the estimation confirms what we have described above. The logit results are provided in online Appendix B, Figure 4 summarizes the results by presenting predicted probabilities of doubly good performance for all five design types. MMP and PR with moderate district magnitude are the two systems most likely to perform well in both dimensions, while plurality/majority, PR with large district magnitudes as well as MMM are extremely unlikely to perform well in both dimensions.Footnote 8
Predicted probabilities of performing well in both dimensions. PR=proportional representation; dm=district magnitudes; MMP=mixed-member proportional; MMM=mixed-member majoritarian.

Looking at the worst of both worlds potential of different systems, running the same logit model for a dummy variable signaling doubly bad performance yields no significant differences between design types and thus provides little design guidance (see online Appendix B). Here, only context variables such as the age of democracy (exerting a negative effect) and the level of ethnic heterogeneity (making doubly bad performance much more likely) are important predictors. In sum, these results with respect to general types suggest that some designs (MMP and PR with moderate district magnitudes) are more likely to produce the best of both worlds and at the same time are not more ‘risky’ in the sense that they are more likely to produce doubly bad results. Yet, as highlighted by Figure 3 and Table 2, many performance differences are left unexplained. Especially the lack of any guidance regarding how to avoid the undesirable event of a worst of both worlds outcome seems problematic. Furthermore, neglecting technical details could lead to problematic inferences based on the results with respect to general types – both praise and criticism could potentially be misdirected.
The role of technical details
As we move on to investigate the technical details that affect how an electoral system performs with regard to the proportionality–concentration trade-off, Table 3 presents the results of regressions for the performance in the different dimensions. Table 3 highlights how the addition of context variables does improve model fit, but also that there are no substantial changes in the estimated coefficients.Footnote 9 As for the technical details, six variables enter the models: the mean district magnitudeFootnote 10 of an electoral system as well as the squared mean district magnitude (following the argument in Carey and Hix, Reference Carey and Hix2011; also see Lijphart, Reference Lijphart1994), the height of the legal threshold, the share of seats contested in SMDs, and two dummy variables signaling the level of compensation, with one indicating whether there is a compensatory PR tier in a mixed-member system and a second indicating whether there is a small-sized tier of national top-up (PR) seats that is meant to compensate for remaining disproportionalities arising in PR or mixed-member systems after the allocation in the main tiers has concluded.Footnote 11 Importantly, using all these technical details as independent variables is not meant to dispute the importance of general designs as reference points, but includes these general designs into a more flexible framework of technical details that allows for carefully assessing the effects of single elements and various detail combinations. Our detail-based models thus include general design types as specific combinations of technical details.
Ordinary least squares regression models

LSI=least squares index; ENP=effective number of parties; SMD=single-member district; PR=proportional representation.
Robust standard errors in parentheses.
***P<0.01, **P<0.05, *P<0.1.
Turning to the results, the effects of different technical variables on disproportionality and concentration largely are as expected. First, increasing district magnitude means lowering disproportionality while increasing the ENP – however, both effects are diminishing as district magnitude grows larger.Footnote 12 Second, raising the legal threshold increases disproportionality and has a reductive impact on party system fragmentation. Third, as the share of SMDs increases, so does disproportionality while the ENP shrinks. Fourth, the presence of a compensatory PR tier does not exert significant effects on either dimension. And finally, the presence of a small tier of national top-up seats reduces disproportionality while increasing the ENP. While all these individual effects are hardly surprising, the key message of Table 3 is that all technical details, except for the presence of a compensatory PR tier, are significant factors in explaining both disproportionality and concentration – a simple type differentiation of electoral systems thus runs the risk of neglecting critical technical details. Furthermore, while the dummy variable indicating that a compensatory PR tier is being used is not statistically significant, it is the only variable whose estimates suggest an effect that is in line with a doubly good performance regarding proportionality and concentration – the presence of a compensatory PR tier is estimated to have a negative effect on both LSI and ENP. The other technical details trade-off proportionality and concentration in the commonly expected way. In the following, it will be critical to further assess the technical details to see whether these potentially function as useful tools in fulfilling competing demands successfully, for example, because they exert a strong positive impact on one dimension but merely a small negative effect in the other.
Table 4 presents the results of logit regressions that highlight the different technical elements’ effects on the probability of a successful balance (below-median performance in both dimensions; models 1 and 2) and on a doubly bad performance (above-median performance in both dimensions; models 3 and 4).Footnote 13 Turning first to good performance in both dimensions, models 1 and 2 show that while the presence of a compensatory PR tier did not exert significant effects on the individual dimensions, it does make a doubly good performance more likely and thus stands out as one technical element prone to provide for high levels of both proportionality and concentration. However, this positive effect could be negated in a mixed-member electoral system employing a large share of SMDs, since increasing the latter makes a doubly good performance less likely by boosting disproportionality. The same negative effect is estimated for the presence of an additional tier with national top-up seats, likely because – for the overall election outcome – the additional proportionality comes with the cost of increased levels of party system fragmentation as small parties are encouraged to contest all districts in order to gain votes for the top-up allocation.
Logit regression models

SMD=single-member district; PR=proportional representation.
Robust standard errors in parentheses.
***P<0.01, **P<0.05, *P<0.1.
The negative linear effect of district magnitude needs to be understood alongside the effect of the share of SMDs which signals which types of districts are at all possible: assuming we are in a PR or mixed-member system, it is thus best to go with small-to-moderate districts as increasing district magnitude would render reaching the best of both worlds less likely (as suggested by Carey and Hix, Reference Carey and Hix2011). However, if district magnitude was to be lowered so far that a plurality electoral system would have to be used, there would actually be a strong overall decrease of the probability of a doubly good performance due to the related change from zero (or, say, 50%) SMDs to a share of 100% SMDs. We will further discuss such combination-based effects below. The – unexpected when it comes to the direction – significant curvilinear effect that kicks in at very high mean district magnitudes (above 300) should be neglected as it derives solely from the inclusion of German elections into the data set.Footnote 14 Finally, the legal threshold exerts a positive effect on the probability of a doubly good performance.
Moving our attention to models 3 and 4 which estimate the effects of different elements on the probability of an especially bad performance, we can see that while the legal threshold improves the chances of a good performance in both dimensions, increasing it also means a higher risk of the electoral system failing both to provide sufficient proportionality and to foster sufficient concentration. The legal threshold thus emerges as a useful but risky tool when aiming for a superior balance. The addition of a compensatory PR tier as well as increasing district magnitude, on the contrary, do not appear to be risky tools since they do not render a bad performance more likely. The addition of a small tier of national top-up seats as well as an increase in the share of SMDs both decrease the likelihood of a doubly bad performance, most likely because they move electoral system design closer to pure PR or plurality and thus almost guarantee the electoral system performing well either with respect to proportionality or concentration. For both dependent variables, the addition of the context variables does improve model fit but leaves the estimated coefficients for the technical variables basically unchanged (the same is true for a model also including the level of ethnic heterogeneity). An interesting finding for the context variables is that the older (i.e. more experienced) the political system, the less likely are extremely good or extremely bad performances, notwithstanding the design of the electoral system. The positive effect of political decentralization is not robust to including region effects. While the continuous measure of presidential power applied in our models does not exert significant effects on either dimension, it is noteworthy that using dummies for different regime types suggests that presidential regimes experience significantly lower levels of disproportionality (especially if presidential elections are not concurrent).
Table 5 further illustrates the key results, showing how meaningful changes in the technical details of an electoral system affect the predicted probability of performing well or badly in both dimensions.Footnote 15 Here, the difference between safer and riskier tools for reaching the best of both worlds as well as the impact of the combination of different details is clearly visible. Lowering district magnitude to moderate levels leads to a clear increase in the likelihood of a doubly good performance, while even slightly reducing the likelihood of a particularly bad performance. Another fairly safe tool is the addition of a compensatory PR tier which boosts the probability of a doubly good performance by 17 percentage points, while increasing the risk of a doubly bad performance by a comparatively meager 4 percentage points. However, although both these elements appear as safe tools to reach a superior balance, the combination of technical elements is critical to consider. Countries such as Denmark, Estonia, or Norway do each pair moderate district magnitudes with a small top-up tier of additional PR seats and all never reach a doubly good performance. While the presence of such an additional top-up tier does render failure in both dimensions very unlikely, it also clearly lowers the chances of performing well with respect to both proportionality and concentration. Similarly, MMP systems may still have a lower likelihood of reaching a superior balance if they come with a very high share of SMDs, the latter having a negative impact on the probability of a successful performance in both dimensions. These results also partly vindicate MMM systems which, while preventing a superior balance, render a total performance failure unlikely via employing fairly high proportions of SMDs without having a compensatory PR tier. Finally, Table 5 highlights the risky nature of the legal threshold – employing a legal threshold of 5% does raise the probability of a doubly good performance by 5 percentage points but at the same time also adds 9 percentage points to the probability of a doubly bad performance. Thus, even if an electoral system has the ‘right’ district magnitude and mixed-member structure, a high legal threshold may tip the system’s performance clearly in an undesirable direction or, in a more positive light, provide the final piece for a well-functioning electoral system. Overall, promises and risks clearly rest in the technical details of electoral systems. Reaching the best of both worlds with respect to proportionality and concentration appears not to be a question of general system type but one of careful design and the right combination of electoral hurdles as well as compensation mechanisms.
Marginal effects of changes in technical details

PR=proportional representation.
Differences in predicted probabilities were calculated based on models 2 and 4 in Table 4; other variables were held at their means.
Conclusion
Which electoral systems are able to successfully provide for PR as well as for party system concentration? If we solely look to general design types, the moderate magnitude PR as well as the MMP system both appear as good choices, whereas pure systems and the MMM system are unlikely to achieve aforementioned goals at the same time. While moving to the level of technical details confirms these general propositions, it also becomes clear how nuanced changes in the technical design of electoral systems have rather different implications for performance. Technical elements fulfill various different roles not only in achieving a good performance but also with respect to the risk of a bad performance in both dimensions. The addition of a compensatory PR tier in a mixed-member system and the lowering of the district magnitude in a PR system are both tools with which to make a good performance in both dimensions more likely without (substantially) increasing the risk of a double failure. A riskier tool (often heralded as being responsible for sufficient levels of concentration in MMP or PR systems; e.g. Kostadinova, Reference Kostadinova2002: 31) is the legal threshold. Increasing this threshold makes extreme – positive or negative – performances more likely. Finally, there are tools suitable for avoiding extreme performances altogether – a small tier of national top-up seats and lowering the share of SMDs. It is the combination of these details that renders a successful performance regarding both proportionality and concentration more or less likely. Hence, our results confirm Carey and Hix’s (Reference Carey and Hix2011) key finding of the moderate district magnitude ‘sweet spot’ but also suggest that there are various ‘sweet spots’ to be found when considering the detail level carefully. Furthermore, next to looking for ‘sweet spots’, we provide the first large-n risk assessment with respect to the representativeness – accountability trade-off. The implication for electoral system design is thus to consider the role of (combinations of) technical details and, next to considering the promises of different designs, to be aware of the risks associated with different electoral institutions.
At this point, we also have to discuss one limitation of our analysis. While it is uncontested that electoral systems influence party systems, parties usually also play a major role when it comes to the design or reform of electoral systems. As different parties are expected to support electoral systems which they assume to favor them, party system characteristics can also determine the design of electoral systems (e.g. Colomer, Reference Colomer2005). However, like most of the similar studies before, we treat electoral systems as purely independent variables. Although this might not be completely unproblematic from a technical point, we defend this approach for different reasons. First, election outcomes are only one factor in reform processes, which are typically highly idiosyncratic and unpredictable (e.g. Renwick, Reference Renwick2010). Second, given the many possible design options at the detail level and the difficulty of politicians in calculating what reforms would favor them, it is reasonable to assume that there is no systematic effect of election outcomes on the (incremental) change of electoral institutions (Andrews and Jackman, Reference Andrews and Jackman2005; Carey and Hix, Reference Carey and Hix2011: 389). Third, at least in established democracies, we expect institutions like Supreme Courts to moderate too egoistic reform plans. And fourth, even if we assume parties to be able to misuse electoral reforms in their own interest, this interest should be to largely conserve the party system. This means that electoral systems, certainly, are not completely exogenous variables but this does not interfere with their effects on party systems. Nevertheless, it is critical that future research maps out more clearly – especially with regard to the theoretical underpinnings – which party system characteristics influence electoral system design and reform systematically as many questions still remain.
Future research should furthermore pay closer attention not only to technical details but to their risk–reward ratio when aiming for a superior electoral system performance. In order to map out the more wide-ranging impact of different performances, it needs to investigate in how far the success and failure of specific design combinations in particular countries function as examples for other countries or even whole regions. These analyses may then assess whether best or worst of both worlds performances lead to a corresponding diffusion of electoral system design – the spread of the German MMP system seems to be one particularly striking example. Furthermore, empirical analyses such as ours are limited in so far as we have to rely on investigating the performance of electoral system designs that actually exist in practice. However, it would be highly important to investigate how higher legal thresholds or especially low or high (but not full) shares of SMDs affect the propensity to perform well or badly in both dimensions. Here, careful simulation studies could be of use in order to derive more nuanced advice for technical details that lie out of the range of what we see applied in the worlds’ electoral systems. Whether based on simulation studies or on district level research designs, future research also has to tackle the challenge of time-invariance in the study of electoral system effects.
Acknowledgments
This manuscript has been written in the context of the research project ‘The Comparison of Electoral Systems’ Functions with a Special Focus on Mixed Systems’. The authors are grateful to the German Research Foundation (DFG) for its financial support of the project. A former version of this paper has been presented and discussed at the 10th ECPR General Conference in Prague. The authors thank the participants of the panel ‘Electoral Systems and Parliamentary Party Strategies’ for valuable comments, in particular Audrey André, Daniel Bochsler, and Bernard Grofman. Finally, the authors are thankful to three reviewers for very helpful suggestions.
Supplementary material
To view supplementary material for this article, please visit https://doi.org/10.1017/S1755773916000278



