

INTRODUCTION
Gap junctions (GJs) are intercellular channels that form between apposed cell membranes, permitting the diffusion of ions and small molecules typically less than 1000 Da (Bruzzone et al., Reference Bruzzone, White and Paul1996). In vertebrates, GJs are comprised of connexins (Cxs), a family of highly conserved integral membrane proteins that are named according to their predicted molecular mass (Willecke et al., Reference Willecke, Eiberger, Degen, Eckardt, Romualdi and Guldenagel2002). Six Cxs oligomerize into a hemichannel (or connexon), and two apposing hemichannels form a GJ channel; aggregates of tens to thousands of channels form a GJ plaque. Hemichannels may be homomeric, containing one type of Cx, or heteromeric, containing more than one type. GJs are termed homotypic if the apposed hemichannels are identical, and heterotypic if they differ (Kumar and Gilula, Reference Kumar and Gilula1996). The potential diversity of GJ composition is immense, as over 20 mammalian Cxs have been described.
Dominant mutations in GJA1, the gene that encodes connexin43 (Cx43), cause oculodentodigital dysplasia (ODDD), which is characterized by developmental abnormalities of the eyes, teeth, limbs and face that can be related to the expression of Cx43 in the affected tissues (Loddenkemper et al., Reference Loddenkemper, Grote, Evers, Oelerich and Stogbauer2002; Paznekas et al., Reference Paznekas, Boyadjiev, Shapiro, Daniels, Wollnik and Keegan2003; Richardson et al., Reference Richardson, Donnai, Meire and Dixon2004; Fenwick et al., Reference Fenwick, Richardson, Butterworth, Barron and Dixon2008). Neurological symptoms have been reported in a subset of patients, including dysarthria, neurogenic bladder, spastic paraparesis, ataxia, mental retardation and seizures; some of these patients have abnormal signal in magnetic resonance imaging of central nervous system (CNS) white matter tracts (Gutmann et al., Reference Gutmann, Zackai, McDonald-McGinn, Fischbeck and Kamholz1991; Loddenkemper et al., Reference Loddenkemper, Grote, Evers, Oelerich and Stogbauer2002). Gja1 Jrt/+ mice are a model of ODDD: they have a dominantly inherited disorder with abnormal digits, dentition and facial skeleton (Flenniken et al., Reference Flenniken, Osborne, Anderson, Ciliberti, Fleming and Gittens2005). In these mice, a point mutation in Gja1 results in the replacement of glycine 60 with serine (G60S) in the highly conserved first extracellular loop of Cx43 (Sohl and Willecke, Reference Sohl and Willecke2004). Because the GJ coupling between ovarian granulosa cells, which express Cx43 but no other Cx, was reported to be impaired in Gja1 Jrt/+ mice, G60S was thought to have dominant effects on wild-type (WT) Cx43 (Flenniken et al., Reference Flenniken, Osborne, Anderson, Ciliberti, Fleming and Gittens2005).
We investigated the effects of the G60S mutation in astrocytes. In rodents, astrocytes are coupled to other astrocytes by Cx43:Cx43 and Cx30:Cx30 homotypic channels, and to oligodendrocytes by heterotypic Cx43:Cx47 and Cx30:Cx32 channels (Rash et al., Reference Rash, Yasumura, Davidson, Furman, Dudek and Nagy2001; Nagy et al., Reference Nagy, Ionescu, Lynn and Rash2003; Nagy and Rash, Reference Nagy and Rash2003; Altevogt and Paul, Reference Altevogt and Paul2004; Li et al., Reference Li, Ionescu, Lynn, Lu, Kamasawa and Morita2004; Orthmann-Murphy et al., Reference Orthmann-Murphy, Freidin, Fischer, Scherer and Abrams2007; Orthmann-Murphy et al., Reference Orthmann-Murphy, Abrams and Scherer2008). To our surprise, we found no measurable effect of the G60S mutant on astrocyte:astrocyte (A:A) coupling in acute brain slices or in culture. We corroborated these results by showing that G60S does not have a dominant effect on coupling in cells transfected to express both G60S and WT Cx43, even though they can be co-immunoprecipitated. Thus, whereas G60S has dominant effects in some cell types, these effects did not detectably affect A:A coupling.
METHODS
Constructs
The open reading frame of mouse Cx43 was generated by polymerase chain reaction (PCR) of genomic mouse DNA, and subcloned into a pIRES2–Enhanced Green Fluorescent Protein (EGFP) vector or pIRES2–DsRed vector, which was produced by replacing the coding sequence of EGFP with the monomeric DsRed. The open reading frame of this sequence was identical to a previously published sequence of mouse Cx43 (GenBank accession number NM_010288). The G60S mutation was generated by site-directed mutagenesis using QuikChange® II XL Site-Directed Mutagenesis Kits (Stratagene), by substituting G with A at position 178 of the open reading frame. To make the Flag- and Myc-epitope tagged versions of WT and G60S, we placed the open reading frames of mouse Cx43 and the G60S mutation, without the stop codon, into the pFlag-N1 or p-Myc-N1 vectors previously made from pEGFP-N1 vector (Clontech) by substituting EGFP with Flag or Myc. Sequences of all these constructs were confirmed by sequencing a large-scale plasmid preparation.
Animals
Gja1 Jrt/+ mice were obtained from the Centre of Modeling Human Diseases in Ontario, Canada. The mice were on the C57BL/6J (B6) and C3H/HeJ (C3) background. All experiments were conducted according to University of Pennsylvania guidelines for laboratory animal use. Tail biopsies were taken from neonatal mice and genotyped by PCR (A. Flenniken, personal communication), followed by digestion with MspI, which does not cut into the mutant sequence, CCAG, thus giving an extra band on gel electrophoresis in Gja1 Jrt/+ compared to WT (Gja1 +/+) littermates. To identify astrocytes in brain slices, Gja1 Jrt/+ mice were crossed to FVB/N-Tg(GFAP Gfp)14Mes/J mice (FVB) (Zhuo et al., Reference Zhuo, Sun, Zhang, Fine, Chiu and Messing1997), which express GFP in astrocytes; 50% of the offspring expressed GFP-positive astrocytes, and an equal proportion of these mice were Gja1 Jrt/+ and Gja1 +/+. For these experiments, mice were maintained by crossing Gja1 Jrt/+ and Gja1 +/+ littermates.
Immunoblotting and co-immunoprecipitations
Individual brains, cerebella, cervical spinal cords and hearts were obtained from euthanized P44 Gja1 Jrt/+ and their Gja1 +/+ littermates, homogenized in lysis buffer (150 mM NaCl, 10 mM Tris, 1 mM ethylene diamine tetraacetic acid (EDTA), 1 mM ethylene glycol tetraacetic acid (EGTA), 1% Triton X, 1 mM Na vanadate and 1 mM NaFl; Manias et al., Reference Manias, Plante, Gong, Shao, Churko and Bai2008) and separated on 4–15% Tris–HCL ReadyGel (Bio-Rad). The blots were incubated overnight at 4°C with a rabbit antiserum against Cx43 (1:8000 or 1:80,000 dilution; Sigma) or Cx30 (1:500 dilution; Zymed), washed several times, incubated in horse radish peroxidase (HRP)-conjugated donkey anti-rabbit antiserum (1:10,000 dilution; Jackson ImmunoResearch Laboratories) and developed using Amersham ECL Western Blotting Detection Reagents. For blotting with GADPH, membranes were stripped following the blotting for Cx43 and Cx30 and then re-incubated overnight at 4°C with a mouse antiserum against GADPH (1:80,000 dilution; Chemicon), washed several times and incubated in HRP-conjugated donkey anti-mouse antiserum (1:10,000 dilution; Jackson ImmunoResearch Laboratories).
For co-immunoprecipitation, N2A cells (American Type Culture Collection, Manassas, VA) were co-transfected to express WTCx43-Flag and G60S-Myc or WTCx43-Myc. After 24 h, the cells were lysed in 500 µl of ice-cold Radio immunoprecipitation assay (RIPA) buffer (10 mM sodium phosphate, pH 7.0, 150 mM NaCl, 2 mM EDTA, 50 mM NaFl, 1% Nonidet P-40, 1% sodium deoxycholate and 0.1% SDS) for 15 min on ice, scraped, and then spun at 14,000 rpm for 30 min. The supernatants were collected, incubated on ice with 5 µl rabbit antiserum against Flag (Sigma) for 1 h, followed by 100 µl protein G agarose (Sigma). After an overnight incubation at 4°C, the beads were washed in RIPA buffer, resuspended in electrophoresis Lammeli buffer with 2-mercaptoethanol (Bio-Rad), separated on 4–15% Tris–HCL ReadyGel (Bio-Rad), and transferred to a polyvinylidene fluoride membrane (Immobilon–P; Millipore). The membrane was incubated with a mouse antibody against Myc (1:5000 dilution; Sigma) overnight at 4°C, and developed as described above. Additional experiments were processed as above with co-immunoprecipitation using rabbit antibody against Flag and were blotted using a monoclonal mouse anti-Cx43 (1:1000 dilution; Chemicon). Blots for Myc using mouse antibody against Myc (1:5000 dilution; Sigma), and GADPH (1:5000 dilution; Chemicon) were carried directly on cell lysates.
Primary cell culture
Post-natal day 1 (P1) to P4 Gja1 Jrt/+ and their Gja1 +/+ littermates were euthanized, and their tails were kept for later genotyping. To obtain astrocytes, the cerebral cortices were dissected, individually triturated in Dulbecco's modified Eagle's medium (DMEM) containing 10% fetal bovine serum, 5 U ml−1 penicillin/streptomycin at room temperature and incubated in 95% air/5% CO2 at 37°C. Confluent cultures (7–10 days in vitro; DIV) were trypsinized, plated into poly-l-lysine coated coverslips (22 mm), and used when confluent (14–16 DIV). Cultures were ~95% pure astrocytes as evidenced by GFAP staining (Meme et al., Reference Meme, Calvo, Froger, Ezan, Amigou and Koulakoff2006; Retamal et al., Reference Retamal, Froger, Palacios-Prado, Ezan, Saez and Saez2007; Saura, Reference Saura2007). To obtain cardiac myocytes, the atria were removed, and the ventricles from individual mice were digested overnight in Ca2+-free HEPES-buffered Hanks' solution with 0.5% trypsin at 4°C, then triturated in Ca2+-free HPSS with 10% horse serum and 5% fetal bovine serum and 1% penicillin/streptomycin. Cells were then rinsed in Ca2+-free DMEM containing 10% horse serum, 5% fetal bovine serum 1% penicillin/streptomycin and plated on fibronectin-coated coverslips in 35-mm tissue culture dishes in Opti-MEM media with 7% horse serum, 3% fetal bovine serum and 1% penicillin/streptomycin.
Immunocytochemistry and immunohistochemistry
P40 Gja1 Jrt/+ and their Gja1 +/+ littermates were euthanized, their hearts were dissected, rinsed in phosphate buffered saline (PBS) and fixed for 15 min in 4% paraformaldehyde (in PBS), and embedded in Optimal Cutting Temperature compound (OCT). The brains, cerebella and spinal cords were dissected from P44 mice that had been perfused with PBS followed by 4% paraformaldehyde, fixed for another hour, infiltrated in 10% sucrose in PBS at 4°C and then embedded in OCT. Cryostat sections (10 µm thick) were thaw-mounted on Super Frost Plus glass slides (Fisher Scientific, Pittsburgh, PA) and stored at −20°C.
Cultured astrocytes, myocytes and transfected N2A cells were rinsed in PBS and fixed for 10 min in 4% paraformaldehyde; tissue sections were also permeabilized by immersion in −20°C acetone for 10 minutes. The slides/coverslips were incubated for 1 h in blocking solution (0.1% Triton X-100, 5% fish skin gelatin in PBS), and incubated overnight at 4°C with various combinations of primary antibodies – rabbit antisera against Cx30 (1:500 dilution; Zymed), Cx43 (1:2000 dilution for sections and 1:400 for cells; Sigma), Flag (1:500; Sigma), Cx30 (1:500 dilution; Zymed) and mouse monoclonal antibodies against Cx30 (1:500 dilution; Zymed), Cx43 (1:250 dilution; Chemicon), GFAP (1:500 dilution; Chemicon) or Myc (1:500 dilution; Sigma). The slides/coverslips were washed several times, incubated with the appropriate fluorescein-, rhodamine- or Cy5-conjugated donkey anti-mouse or -rabbit antisera (1:200 dilution; Jackson ImmunoResearch Laboratories). Slides were mounted with ProLongGold with DAPI (Invitrogen) or Vectorshield, and examined by epifluorescence with appropriate optical filters by epifluorescence (Leica DMR) or confocal (Leica SP2 AOBS system or Olympus FlouView FV1000) microscopy using interactive software (Improvision).
Electron microscopy
After anesthesia, P40 Gja1 Jrt/+ (n = 3) and their Gja1 +/+ littermates (n = 3) were transcardially perfused with 2.5% glutaraldehyde in 0.1 M PB, the brains, optic nerves and spinal cords were dissected and fixed overnight at 4°C, then osmicated, dehydrated and embedded in Epon. Transverse semithin sections (0.5 µm) were stained with alkaline toluidine blue and visualized through light microscopy (Leica DMR) using an interactive software (Improvision). Thin sections (90 nm thick) were mounted on 2 × 1 mm single-slot, formvar-coated grids, stained with lead citrate and uranyl acetate and examined with a JOEL 1200 electron microscope.
Electrophysiology
All recording and imaging from slice and primary cell culture was conducted using an Olympus BX51WI fixed stage microscope, fitted with a 40× water immersion objective with a long working distance, infrared differential interference contrast and videomicroscopy through an Olympus DP-71 Color camera using DP-71 software. The whole cell recordings were conducted using a Model 2400 amplifier (A-M systems); signals were digitized using National Instruments USP interface card, and analyzed using WCP software (version 3.6 up to version 4.0.7, John Dempster, Department of Physiology & Pharmacology Strathclyde Institute for Biomedical Sciences University of Strathclyde, Scotland).
Cells were recorded in the whole cell configuration 2 days after the transfection in extracellular solution composed of 135 mM NaCl, 5 mM KCl, 1.0 mM MgCl2, 4 mM dextrose and 5 mM HEPES adjusted to a pH of 7.4. Electrodes with a resistance of 3–6 MΩ were filled with the following solution – 130 mM KCL, 5 mM NaCl, 1 mM MgCl2, 0.5 mM CaCl2, 5 mM EGTA and 10 mM HEPES, adjusted to a pH of 7.3 with KOH; KCL was replaced with CsCl for cardiac myocytes. To test for dye transfer, one cell in a cluster of cells expressing DsRed was loaded with 1% lucifer yellow (LY; MW 457 Da, −2 charge) via whole cell configuration. Capacitance data were collected using a 10 mV voltage step and capacitance and analyzed as described (de Roos et al., Reference de Roos, van Zoelen and Theuvenet1996). Dye injections in confluent cultured astrocytes and spontaneously beating cardiac myocytes were conducted in a similar way. We first confirmed the absence of any specific fluorescence signal in any cell, then an individual cell in a cluster was patched with an electrode containing LY, and the cluster was observed over 1–5 min as the surrounding cells became filled with LY and showed intense fluorescence signal in the soma and nucleus. Acute brain slices were prepared from P14 to P25 Gja1 Jrt/+ or Gja1 +/+ mice that also expressed a GFAP–GFP transgene. Mice were euthanized, decapitated and the brain was dissected, immersed for 5 min in oxygenated (bubbled with 95% O2–5%CO2), ice-cold artificial cerebrospinal fluid (ACSF) composed of 250 mM sucrose, 2.5 mM KCl, 1.mM NaH2PO4, 1.3 mM MgSO4, 2.5 mM CaCl2, 11 mM dextrose and 26.2 mM NaHCO3, pH of 7.4 and an osmolarity of 295–305 mOsm, and sectioned horizontality into 200 µm thick sections using a Leica VT1000 S vibratome. Slices were incubated in oxygenated ACSF (125 mM NaCl, 2.5 mM KCl, 1.mM NaH2PO4, 1.3 mM MgSO4, 2.5 mM CaCl2, 11 mM dextrose and 26.2 mM NaHCO3 with a pH of 7.4 and an osmolarity of 295–305 mOsm) for 1 h, then placed in the recording chamber continuously perfused at a rate 2 ml min−1 with 100% O2 bubbled ACSF. Electrodes were filled with an intracellular solution composed of 105 mM K-gluconate, 30 mM KCL, 0.3 mM EGTA, 10 mM HEPES, 10 mM phosphocreatine, 4 mM ATP-Mg2, 0.3 mM GTP-Tris, with either 0.1% LY or 0.1% sulforhodamine-B (SR-B; MW 559; Invitrogen), adjusted to a pH 7.4 with KOH. After confirming the absence of bleed-through of GFP into the TRITC fluorescence signal, GFP-positive cells were patched and observed over 1–20 min.
For dual patch recordings, N2A calls were transfected as described above, and patching was carried out using Olympus inverted microscope and a pipette solution of 145 mM CsCl2, 5 mM EGTA, 1.4 mM CaCl2 and 5.0 mM HEPES, pH 7.2. Cells were bathed solution consist of 150 mM NaCl, 4 mM KCl, 1 mM MgCl2, 2 mM CaCl2, 5 mM dextrose, 2 mM pyruvate and 10 mM HEPES, pH 7.4. Recordings were done using Multiclamp 700 A, and junctional conductance (G j) was determined from isolated pairs by measuring junctional current (I j) responses to junctional voltage (V j) ramps from −100 to +100 mV.
Statistical analyses were performed using GraphPadPrism (GraphPad Software Inc.).
RESULTS
Cortical astrocytes in acute brain slices from Gja1 Jrt/+ mice are functionally coupled
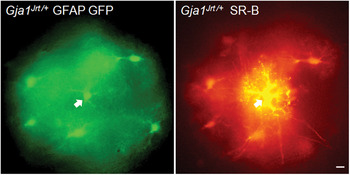
Because Cx43 contributes to A:A coupling (Giaume et al., Reference Giaume, Fromaget, el Aoumari, Cordier, Glowinski and Gros1991; Naus et al., Reference Naus, Bechberger, Zhang, Venance, Yamasaki and Juneja1997), we examined dye transfer in acute brain slices from P15 to P25 Gja1 +/+ and Gja1 Jrt/+ mice. These mice also expressed the GFAP–Gfp transgene, so that astrocytes could be recognized by their expression of GFP. In our initial experiments, we used patch electrodes to label single, GFP-positive cells with LY, a small (457 Da, −2 charge) fluorescent dye that permeates GJs comprised of Cx43 (Elfgang et al., Reference Elfgang, Eckert, Lichtenberg-Frate, Butterweck, Traub and Klein1995). Because the GFP obscured the fluorescence of the LY, we used SR-B, a small (559 Da, uncharged) fluorescent dye that is visualized with different fluorescence optics (TRITC). In slices from both Gja1 +/+ (n = 7) and Gja1 Jrt/+ (n = 10) mice, SR-B dye was observed in cortical astrocytes that were adjacent to the injected cell, demonstrating intracellular dye transfer. Figure 1 shows one example in from a Gja1 Jrt/+ mouse. Unpaired two-tailed t-test with Welch's correction showed no difference (t = 0.4798; P < 0.6417) between the number of coupled cells in Gja1 Jrt/+ (mean 7.5 cells ± 1.23) and Gja1 +/+ (mean 8.57 ± 1.86) mice.
Astrocytes in Gja1Jrt/+ mice are dye-coupled. These are images from an acute slice of P23 Gja1 Jrt/+ GFAP-Gfp mouse cortex. One GFP-positive cell was injected with SR-B (arrow); the adjacent GFP-positive cells were also SR-B-positive after 20 min. Scale bar: 10 µm.

Cultured astrocytes and cardiac myocytes from Gja1 Jrt /+ mice are functionally coupled
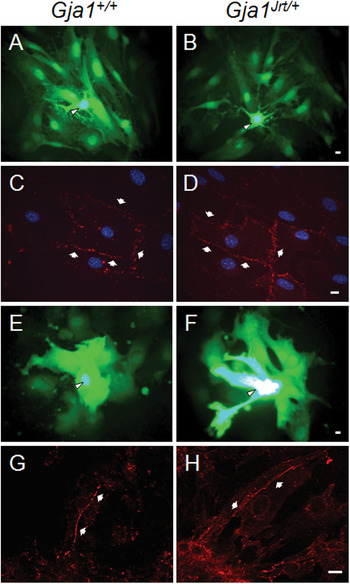
The above result was surprising, because dye transfer is disrupted in cultured Gja1 Jrt/+ granulosa cells, which express Cx43 (Flenniken et al., Reference Flenniken, Osborne, Anderson, Ciliberti, Fleming and Gittens2005). Because astrocytes also express Cx30 (Nagy et al., Reference Nagy, Patel, Ochalski and Stelmack1999), we considered the possibility that Cx30 homotypic channels might account for this discrepancy. To study the effect of the G60S mutant on A:A coupling in a simpler system, we examined cultured astrocytes, which express Cx43 but not Cx30 (Giaume et al., Reference Giaume, Fromaget, el Aoumari, Cordier, Glowinski and Gros1991; Koulakoff et al., Reference Koulakoff, Ezan and Giaume2008). We injected single astrocytes in confluent cultures prepared from individual Gja1 Jrt/+ or Gja1 +/+ pups. Because these astrocytes were not GFP-positive, we could use LY. As shown in Fig. 2A,B, LY labeled multiple cells labeled over a few minutes. By counting the number of labeled cells after 5 min, we determined that the number LY-positive cells was similar (no difference in an unpaired two-tailed t-test with Welch's correction; t = 0.1117; P < 0.9118) between Gja1 Jrt/+ (mean 7.3 ± 5.8; n = 3 animals, with 3–8 coverslips per animal) and Gja1 +/+ astrocytes (mean 7.3 ± 7.3; n = 4 animals, with 1–8 coverslips per animal). We immunostained our cultures with a rabbit antiserum that specifically labels Cx30 (Yum et al., Reference Yum, Zhang, Valiunas, Kanaporis, Brink and White2007), combined with a monoclonal antibody against Cx43. The astrocytes from both Gja1 Jrt/+ (n = 10) and their Gja1 +/+ littermates (n = 10) were Cx30-negative and Cx43-positive (red); Gja1 +/+ astrocytes had more conspicuous Cx43-positive puncta on their apposed cell membranes (Fig. 2C,D).
Cultured Gja1Jrt/+ astrocytes and cardiac myocytes express Cx43-positive GJs and are dye coupled. Astrocytes (A,B) and cardiac myocytes (E,F) were cultured from individual Gja1 Jrt/+ mice or their Gja1 +/+ littermates and either injected with LY (arrowheads indicate the injected cell) or fixed, immunostained for Cx43, and imaged by epifluorescence (C,D) or confocal (G,H) microscopy. Note that Gja1 Jrt/+ and Gja1 +/+ astrocytes and cardiac myocytes were extensively labeled with LY, and have Cx43-positive (red) GJ plaques on apposed cell membranes (arrows). Scale bars: 10 µm.

We also studied cultured cardiac myocytes, which express Cx43 and are affected by the loss of Cx43 (Vink et al., Reference Vink, Suadicani, Vieira, Urban-Maldonado, Gao and Fishman2004) and by the G60S mutation (Flenniken et al., Reference Flenniken, Osborne, Anderson, Ciliberti, Fleming and Gittens2005; Manias et al., Reference Manias, Plante, Gong, Shao, Churko and Bai2008). We cultured myocytes from single Gja1 Jrt/+ and their Gja1 +/+ littermates, and injected LY into single cells of spontaneously beating clusters. Both Gja1 Jrt/+ (n = 5 animals, with 2–5 coverslips per animal) and Gja1 +/+ (n = 5 animals, with 2–5 coverslips per animal) myocytes showed extensive LY coupling (Fig. 2E,F), in agreement with Manias et al. (Reference Manias, Plante, Gong, Shao, Churko and Bai2008). Because the myocytes were clustered, however, we could not perform a meaningful quantitative analysis. Immunostaining showed that most of the cultured myocytes from Gja1 Jrt/+ (n = 5) mice had Cx43-positive GJ plaques on apposed cell membranes as did their Gja1 +/+ littermates (n = 3; Fig. 2G,H).
G60S does not form functional channels in N2A cells
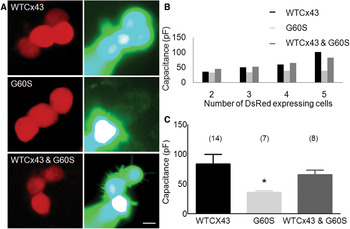
The above results provided no evidence for a dominant-negative effect of G60S on coupling. To further examine this, we expressed G60S alone, WTCx43 alone or both G60S and WTCx43 in N2A cells by transient transfection using a bicistronic vector that also expressed the monomeric DsRed. In agreement with Flenniken et al. (Reference Flenniken, Osborne, Anderson, Ciliberti, Fleming and Gittens2005), G60S formed GJ plaques at apposed cell borders (see supplementary Fig. 1 online). As a functional test, we patched a single DsRed-positive cell in a cluster of DsRed-positive cells with an electrode containing LY. If the vector contained WTCx43, dye transfer was observed in the DsRed-positive cells of the cluster (Fig. 3A, upper panels; n = 18 injections, from three separate transfections). In contrast, if the vector contained the G60S mutant alone, no LY transfer was observed (Fig. 3A, middle panels; n = 18 injections, from three separate transfections). If the cells were transfected to express both G60S (in the DsRed vector) and WTCx43 (in the pIRES2–puro3 vector; uncolored), LY transfer was seen in the DsRed-positive cells of that cluster (Fig. 3A, lower panels; n = 8 injections, from three separate transfections). Cells transfected to express both the G60S mutant (in the DsRed vector) and WTCx43 (in the pIRES2–EGFP vector) had GJ plaques at apposed cell borders (see supplementary Fig. 2 online).
G60S does not have dominant effects on coupling in cells transfected to express both G60S and WTCx43. N2A cells were transiently transfected to express WTCx43 (in pIRES2–DsRed) alone, G60S (in pIRES2–DsRed) alone, or both G60S (in pIRES2–DsRed) and WTCx43 (in pIRES2–puro3). (A) Clusters of DsRed cells were identified with TRITC optics (left column), one cell was patched with an electrode containing 0.1% LY, and imaged after 5 min (right column). Cells expressing WTCx43 alone or WTCx43 and G60S show robust dye transfer, but cells expressing G60S alone show no dye transfer. Scale bar: 10 µm. (B) The capacitance transients (in response to a 10 mV pulse) increase progressively in DsRed-positive cell clusters expressing WTCx43 or both WTCx43 and G60S, but not in cells expressing G60S alone. (C) Compared to cells expressing WTCx43, a Kruskal–Wallis test shows a statistically significant difference for cells expressing G60S alone (asterisk; P < 0.0165), but no significant difference for cells expressing both WTCx43 and G60S.

These results from transfected cells as well as cultured astrocytes and cardiomyocytes, provided no evidence that G60S has dominant effects on coupling through WTCx43 channels, which was unexpected given the lack of coupling between granulosa cells from Gja1 Jrt/+ mice (Flenniken et al., Reference Flenniken, Osborne, Anderson, Ciliberti, Fleming and Gittens2005). To evaluate this further, we compared the capacitance transients from these clusters of cells, as GJ coupling should increase the apparent membrane capacitance of a cell. This analysis (Fig. 3B,C) revealed a monotonic increase in membrane capacitance with increasing number of DsRed-positive cells/cluster for cells expressing WTCx43 alone (n = 14; mean capacitance 83.68 ± 59.70 pF), as previously reported (de Roos et al., Reference de Roos, van Zoelen and Theuvenet1996), as well as for cells expressing both WTCx43 and G60S (n = 8; mean capacitance 65.5 ± 23 pF). In contrast, cells from clusters expressing G60S alone (n = 7) did not show this increase in capacitance; their mean capacitance of 36.3 ± 6.5 pF. While Kruskal–Wallis analysis with Dunn's multiple comparison test revealed statistically significant difference in the capacitance between cells expressing either the WTCx43 alone or the G60S mutant alone (8.21; P < 0.017), there was no difference between cells expressing the WTCx43 and cells expressing both the WTCx43 and G60S mutant.
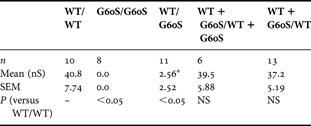
As a more rigorous test, we expressed G60S alone, WTCx43 alone or both G60S and WTCx43 in N2A cells by transient transfection using a bicistronic vector that also expressed the monomeric DsRed or EGFP, and measured electrical coupling between cell pairs with dual whole-cell recordings. These results are summarized in Table 1. When both members of the cell pair expressed WTCx43 (WTCx43/WTCx43), the cell pairs were well coupled, whereas G60S/G60S cell pairs and WTCx43/G60S cell pairs were not coupled. The coupling of cell pairs in which one (WTCx43&G60S/WTCx43) or both (WTCx43&G60S/WTCx43&G60S) members expressed both WTCx43 and G60S were not statistically different than in WTCx43/WTCx43 cell pairs. Thus, these electrophysiological data provide no support for the idea that G60S has a dominant-negative effect on GJ coupling.
Dual whole-cell patch clamp recordings. Neuro2A cells were transiently transfected to express the indicated constructs and were paired as shown. GJ coupling was measured in nS. As expected, Cx43 homotypic pairs (WT/WT) were well coupled, as were pairs of cells in which both cells expressed Cx43WT, regardless of whether one (WT + G60S/WT) or both (WT + G60S/WT + G60S) cells also expressed G60S. Cell pairs expressing G60S alone (G60S/G60S) showed no coupling (significantly different from WT/WT at P < 0.05). Only one heterotypic Cx43G60S/Cx43WT pairing showed any coupling; the other six cell pairs showed no coupling.

* All due to one true outlier.
G60S interacts directly with WT Cx43
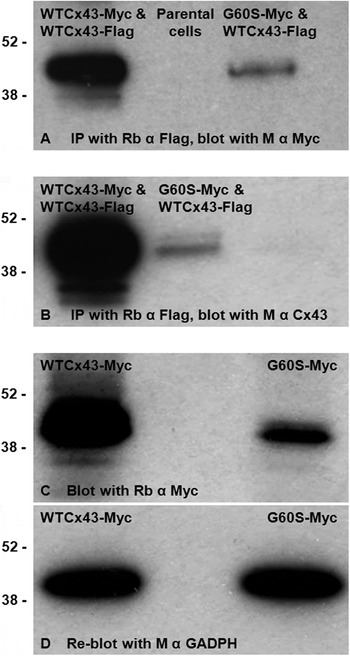
We considered the possibility that the lack of a dominant-negative effect of G60S on WTCx43 could result from a lack of direct interaction. To address this issue, we generated epitope-tagged versions of G60S (G60S-Myc) and WTCx43 (both WTCx43-Flag and WTCx43-Myc) because available antibodies do not discriminate between G60S and WTCx43. We immunoprecipitated lysates of cells co-transfected to express WTCx43-Flag and G60S-Myc (or WTCx43-Flag and WTCx43-Myc as a control) with a rabbit antibody against Flag, and immunoblotted the immunoprecipitant for Myc. As shown in Fig. 4A, G60S-Myc and WTCx43-Myc were co-immunoprecipitated, demonstrating that G60S can interact with WTCx43. This experiment was repeated three times, with similar results. We also immunoblotted the immunoprecipitate for Cx43, and found that the amount of Cx43 (the sum of Flag- and Myc-tagged Cx43) was reduced in cells expressing both WTCx43-Flag and G60S-Myc compared to cells expressing both WTCx43-Flag and WTCx43-Myc (Fig. 4B).
G60S co-immunoprecipitates with WTCx43. N2A cells were transiently co-transfected to express both WTCx43-Flag and WTCx43-Myc or WTCx43-Flag and G60S-Myc, and immunoprecipitated with a rabbit antiserum against Flag. The immunoprecipitants were immunoblotted with a mouse monoclonal antibody against Myc, confirming that WTCx43 and the mutant interact (A). Immunoblotting immunoprecipitates for Cx43 shows that the overall expression of Cx43 (WTCx43-Flag and either WTCx43-Myc or G60S-Myc) was lower for cells expressing G60S-Myc (B). Panels C and D are immunoblots of lysates of cells that were transiently transfected to express G60S-Myc or WTCx43-Myc, probed with a rabbit antiserum against Myc then reprobed with a monoclonal antibody against GAPDH. Note that the steady-state level of G60S-Myc is lower than that of the WTCx43-Myc (C), despite equal loading of the cell lysates as shown by blotting for GADPH (D). The positions of 38 and 52 kDa molecular markers are indicated.

The reduced amount of co-immunoprecipitated G60S-Myc could reflect a lower steady-state level of G60S-Myc or a weaker interaction of G60S-Myc with WTCx43-Flag than between WTCx43-Myc and WTCx43-Flag. To investigate this issue, we immunoblotted lysates of cells expressing G60S-Myc alone or WTCx43-Myc alone (Fig. 4C), and reblotted for GADPH (Fig. 4D), and found that the level of G60S-Myc was reduced. Immunostaining transfected cells revealed that G60S-Myc (unlike G60S without the Myc tag) is localized to the Golgi (data not shown), and in co-transfected cells, that WTCx43-Flag and G60S-Myc were co-localized in the Golgi did not form GJ plaques (in contrast to cells co-expressing WTCx43-Flag and WTCx43-Myc, which form GJ plaques; see supplementary Fig. 3 online). In summary, G60S-Myc interacts with and has a dominant effect on WTCx43-Flag, but the epitope tag confounds this analysis because it altered the localization of the G60S mutant. The interaction between G60S-Myc and WTCx43-Myc likely occurs in the Golgi, where the two proteins are largely localized, and which is the site of Cx43 oligomerization (Musil and Goodenough, Reference Musil and Goodenough1993).
Localization of Cx43 in Gja1 Jrt/+ and Gja1 +/+ mice
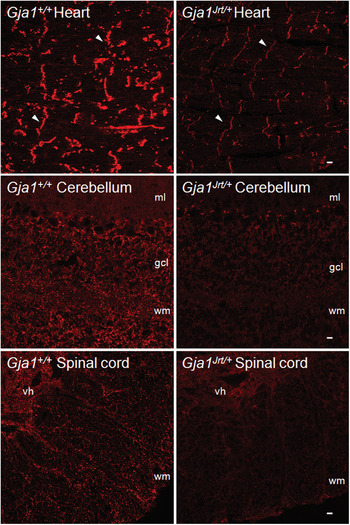
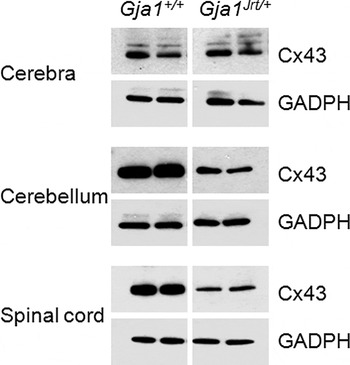
To determine whether the G60S mutant affects the expression of WTCx43 in vivo, we immunostained sections of the cerebellum, spinal cord and heart from a litter of P40 mice. As shown in Fig. 5, apposed cell membranes of cardiac muscle cells from both Gja1 +/+ and Gja1 Jrt/+ had Cx43-immunoreactivity; this was stronger in Gja1 +/+ mice (n = 3) than in their Gja1 Jrt/+ littermates (n = 4), in accord with prior work (Flenniken et al., Reference Flenniken, Osborne, Anderson, Ciliberti, Fleming and Gittens2005; Manias et al., Reference Manias, Plante, Gong, Shao, Churko and Bai2008). Similarly, we found that Cx43 expression was reduced in the cerebellum and spinal cord of Gja1 Jrt/+ mice. The number and/or size of GJ plaques appeared reduced, without an increase in the intracellular staining (as might be expected if G60S were abnormally retained); Cx43-immunoreactivity was more pronounced in the gray matter than in the white matter (Yamamoto et al., Reference Yamamoto, Ochalski, Hertzberg and Nagy1990). To corroborate these findings, we compared the level of Cx43 in homogenates of three brain regions from another litter of P40 Gja1 Jrt/+ and the Gja1 +/+ littermates. In immunoblots (Fig. 6), the levels of Cx43 were reduced in the spinal cords and cerebella of Gja1 Jrt/+ compared their Gja1 +/+ littermates, but we did not see such a difference in the cerebra. The levels of Cx30 in the brains, cerebella and spinal cords of Gja1 Jrt/+ mice were similar to that in Gja1 +/+ littermates both by immunostaining (see supplementary Fig. 4 online) and immunoblotting (see supplementary Fig. 5 online); there was no evidence for compensatory increase in Cx30 expression.
Reduced Cx43-immunoreactivity in the heart, cerebellum and spinal cord of Gja1Jrt/+ mice. These are confocal images of frozen sections from the heart, cerebellum and spinal cord of P40 Gja1 Jrt/+ mice and their Gja1 +/+ littermates. The sections were immunostained concurrently for Cx43 (red), and exposed for the same time to illustrate the diminished Cx43 staining in Gja1 Jrt/+ tissues. In the heart, apposed membranes of cardiac myocytes from both Gja1 +/+ and Gja1 Jrt/+ mice are Cx43-positive. In the cerebellum, Cx43 is mostly localized in the granule cell layer (gcl) and white matter (wm) but not in the molecular layer (ml). In the spinal cord, Cx43 is more prominent in the gray matter of the ventral horn (vh) than in the white matter (wm). Scale bars: 10 µm.

Reduced Cx43 in the CNS of Gja1Jrt/+ mice. These are immunoblots of individual cerebra, cerebella and spinal cords of P40 Gja1 Jrt/+ mice and their Gja1 +/+ littermates. Ten μg of protein/lane was separated by electrophoresis, transferred to a membrane, probed with a rabbit antiserum against Cx43, then re-probed with mouse monoclonal antibody against GADPH, to show that the loading was comparable. The level of Cx43 is lower in Gja1 Jrt/+ cerebella (B) and spinal cords (C), but not cerebra (A). The larger bands of Cx43 in the cerebra are likely phosphorylated isoforms (Manias et al., Reference Manias, Plante, Gong, Shao, Churko and Bai2008). The Gja1 Jrt/+ and Gja1 +/+ samples were on the same membrane, but the intervening lanes were spliced out.

Cortical lamination and myelination in Gja1 Jrt/+ and Gja1 +/+ mice
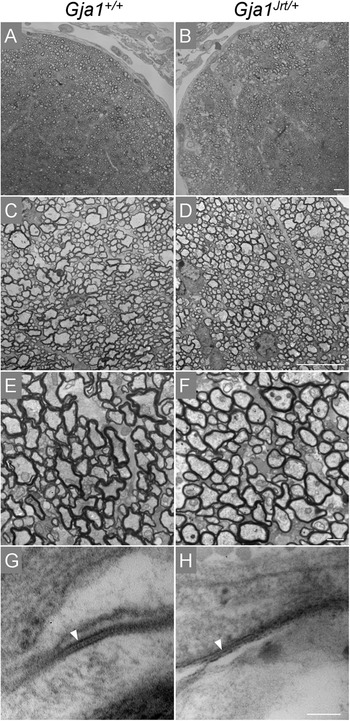
To determine whether the G60S mutant affects cortical lamination or myelination, we examined semithin sections of the cerebra, spinal cords and, optic nerves and thin sections from optic nerves from a litter of P40 mice. We did not detect any difference in myelination in Gja1 Jrt/+ mice (n = 3) compared to their Gja1 +/+ littermates in any of these regions; the optic nerve is shown in Fig. 7. Furthermore, using electron microscopy, we found A:A GJs between subpial astrocytes (Fig. 7) and A:O GJs in the optic nerve (data not shown). We did not detect any changes in cortical lamination in Gja1 Jrt/+ mice (n = 3; see supplementary Fig. 6 online).
Normal myelination in Gja1Jrt/+ CNS. These are digital images of individual optic nerves from P40 Gja1 Jrt/+ mice (n = 3) and their Gja1 +/+ littermates (n = 3). Panels A and B show toluidine blue stained semi-thin sections. Panels C–H show electron micrographs from thin sections; C–F show that the myelinated axons in Gja1 Jrt/+ mice appeared similar to those in their WT littermates; G and H show GJs (arrowheads) between subpial astrocytes in Gja1 Jrt/+ and Gja1 +/+ mice. Scale bars: 10 µm in A–D; 1 µm in E and F, and 100 nm in G and H.

DISCUSSION
We have confirmed and extended the analysis of the G60S mutant, which mediates the abnormal phenotype in Gja1 Jrt/+ mice. We confirm that in transfected cells, the G60S mutant does not form functional GJs when expressed alone (Flenniken et al., Reference Flenniken, Osborne, Anderson, Ciliberti, Fleming and Gittens2005), and show for the first time that G60S does not detectably disrupt GJs when co-expressed with WTCx43 in co-transfected cells, even though G60S co-immunoprecipitates with WTCx43. We also demonstrate that in both acute brain slices and cultured astrocytes from Gja1 Jrt/+ mice, G60S does not detectably disrupt dye coupling between astrocytes. Thus, whereas G60S has dominant effects in some cell types such as ovaries (on both dye transfer and electrical coupling (Flenniken et al., Reference Flenniken, Osborne, Anderson, Ciliberti, Fleming and Gittens2005)), cardiac myocytes (electrical coupling (Manias et al., Reference Manias, Plante, Gong, Shao, Churko and Bai2008)), myometrial smooth muscle cells (electrical coupling (Tong et al., Reference Tong, Colley, Thoo, Li, Plante and Laird2009a, Reference Tong, Lu, Wang, Plante, Lui and Lairdb)) and mammary epithelial cells (dye transfer (Plante and Laird, Reference Plante and Laird2008)), these effects were not detected in astrocytes.
Flenniken et al. (Reference Flenniken, Osborne, Anderson, Ciliberti, Fleming and Gittens2005) expressed GFP-tagged WT and G60S in heterologous cells and found that G60S-GFP was prominently localized in the Golgi, but appeared to form at least some GJ plaques. We observed that G60S formed GJ plaques, whereas G60S-Myc and G60S-Flag did not; they were largely localized to the Golgi and appeared to sequester WTCx43 in co-transfected cells. Because oligomerization of endogenous Cx43 occurs in the trans-Golgi network (Musil and Goodenough, Reference Musil and Goodenough1993), defective oligomerization might be the cause of the apparent retention of G60S (and WTCx43) in the Golgi. This, in turn, could increase the degradation of WTCx43 and G60S by proteosomes or lysosomes (Laing et al., Reference Laing, Tadros, Westphale and Beyer1997), and hence, lower their steady-state levels. Why the Myc- and Flag-tags resulted in little cell surface expression of Cx43 (and more apparent retention in the Golgi) is unclear. The tags were placed at the C-terminus, and should have disrupted the PDZ-binding site (Giepmans and Moolenaar, Reference Giepmans and Moolenaar1998), and potentially other protein–protein interactions (Chanson et al., Reference Chanson, Kotsias, Peracchia and O'Grady2007), but not oligomerization (Maass et al., Reference Maass, Ghanem, Kim, Saathoff, Urschel and Kirfel2004). A C-terminal GFP-tag affects the physiological characteristics of WTCx43, but apparently not its ability to form GJ plaques (Bukauskas et al., Reference Bukauskas, Bukauskiene, Bennett and Verselis2001).
Flenniken et al. (Reference Flenniken, Osborne, Anderson, Ciliberti, Fleming and Gittens2005) also found that WTCx43-GFP, but not G60S-GFP, formed functional channels in N2A cells, but they did not analyze cells that were co-transfected to express both WTCx43 and G60S. Instead, they analyzed granulosa cells, which are thought to express exclusively Cx43, and found weak (10/27 injections) or absent (17/27) dye transfer. In contrast, we could not document diminished dye coupling in cells transfected to express both WT Cx43 and G60S, in cultured cardiac myocytes, cultured astrocytes or astrocytes in acute brain slices, and we could not document diminished electrical coupling in cells transfected to express both WTCx43 and G60S. Compensation by another Cx is unlikely, as Manias et al. (Reference Manias, Plante, Gong, Shao, Churko and Bai2008) did not detect increased Cx40 or Cx45 in the hearts of Gja1 Jrt/+ mice, and we did not detect increased Cx30 in any brain region, or in cultured astrocytes (nor would LY be expected to diffuse across Cx30 homotypic channels (Manthey et al., Reference Manthey, Banach, Desplantez, Lee, Kozak and Traub2001; Beltramello et al., Reference Beltramello, Bicego, Piazza, Ciubotaru, Mammano and D'Andrea2003)). Thus, why granulosa cells are more affected in Gja1 Jrt/+ mice remains to be explained.
Although GJs have long been recognized to be a prominent feature of astrocytes (Peters et al., Reference Peters, Palay and Webster1991), their functions have only recently been elucidated, largely by investigating mice that have null alleles. Although Gja1-null mice were initially thought to have normal brains at birth (when they die of a cardiac defect (Dermietzel et al., Reference Dermietzel, Gao, Scemes, Vieira, Urban and Kremer2000)), conditionally deleting Cx43 in the CNS results in abnormal cerebellar development (Wiencken-Barger et al., Reference Wiencken-Barger, Djukic, Casper and McCarthy2007) and abnormal neuronal migration in the cortex (Cina et al., Reference Cina, Maass, Theis, Willecke, Bechberger and Naus2009). Deleting both Cx30 and Cx43 in astrocytes completely disrupts GJ communication, with diminished K+ buffering (Wallraff et al., Reference Wallraff, Kohling, Heinemann, Theis, Willecke and Steinhauser2006), and decreased trans-cellular diffusion of a glucose analog between astrocytes (Rouach et al., Reference Rouach, Koulakoff, Abudara, Willecke and Giaume2008). In addition, these mice are long lived, with mild but wide spread white matter abnormalities (Lutz et al., Reference Lutz, Zhao, Gulinello, Lee, Raine and Brosnan2009), in contrast to the more severe phenotype of mice lacking both Cx32 and Cx47, which die at ~6 weeks (Menichella et al., Reference Menichella, Goodenough, Sirkowski, Scherer and Paul2003; Odermatt et al., Reference Odermatt, Wellershaus, Wallraff, Seifert, Degen and Euwens2003).
In contrast, the G60S mutant did not produce a discernible effect on dye transfer of LY, although our analysis could have missed a subtle effect on electrical coupling, as was found in cardiac myocytes (Manias et al., Reference Manias, Plante, Gong, Shao, Churko and Bai2008). Just as not all ODDD patients have CNS manifestations (Paznekas et al., Reference Paznekas, Karczeski, Vermeer, Lowry, Delatycki and Laurence2009; Alao et al., Reference Alao, Bonneau, Holder-Espinasse, Goizet, Manouvrier-Hanu and Mezel2010), perhaps the lack of detectable abnormalities in Gja1 Jrt/+ astrocytes owes to the mild effect of the Gja1 Jrt allele. The analysis of astrocytes coupling in mice that express mutations known to result in a CNS phenotype in humans, such as I130 T (Kalcheva et al., Reference Kalcheva, Qu, Sandeep, Garcia, Zhang and Wang2007) and G138R (Dobrowolski et al., Reference Dobrowolski, Sasse, Schrickel, Watkins, Kim and Rackauskas2008), should be informative.
ODDD mutants appear to produce their clinical phenotype in a cell autonomous manner, and a dominant-negative effect on WTCx43 is the best substantiated mechanism (McLachlan et al., Reference McLachlan, Manias, Gong, Lounsbury, Shao and Bernier2005; Roscoe et al., Reference Roscoe, Veitch, Gong, Pellegrino, Bai and McLachlan2005; Shibayama et al., Reference Shibayama, Paznekas, Seki, Taffet, Jabs and Delmar2005; Gong et al., Reference Gong, Shao, Lounsbury, Bai and Laird2006). Disrupting Cx43:Cx43 homotypic channels is the most obvious way that ODDD mutants would affect astrocytes, but mutants could also affect heterotypic Cx43:Cx47 coupling between astrocytes and oligodendrocytes. A reduction in the amount of Cx43 in certain cells might account for neurological manifestations, either by altering proteins expression (Iacobas et al., Reference Iacobas, Scemes and Spray2004) or by impairing other functions of Cx43 such as it has adhesive properties (Elias et al., Reference Elias, Wang and Kriegstein2007), or by protein–protein interactions (Chanson et al., Reference Chanson, Kotsias, Peracchia and O'Grady2007).
ACKNOWLEDGEMENTS
This work was supported by the NIH grants NS55284 (to S.S.S.) and NS050705 (to C.K.A.). We thank Drs. Ann Flenniken and Janet Rossant for the Gja1Jrt/+ mice, Dr. John Dempster for the WCP software, and Drs. Christian Giaume, Philip Haydon, Jian Li, Kenneth Morgulies, Haji Takano and Ambuin Mu for advice.
Statement of interests
None.
Supplementary material
The supplementary material referred to in this article can be found online at journals.cambridge.org/ngb.