I. INTRODUCTION
Lath martensitic steels have a myriad of military and civilian applications due to their high-strength wear resistance and toughness, which results from its unique microstructure. Morito et al.Reference Morito, Tanaka, Konishi, Furuhara and Maki1, Reference Morito, Huang, Furuhara, Maki and Hansen2 have characterized lath martensitic microstructures into lath, block, and packet substructures, which have well-defined orientation relationships (ORs) with the parent austenite grain. Through the addition of microalloying elements and thermomechanical treatments, a variety of microstructures and superior combinations of mechanical properties have been achieved.Reference Takaki, Kawasaki and Kimura3–Reference Kimura, Inoue, Yin and Tsuzaki8 Furthermore, recent advances in grain refinement methods have yielded ultrafine-grained (UFG) steels with surprisingly high strengths and fracture resistance.Reference Song, Ponge, Raabe, Speer and Madock9–Reference Calcagnotto, Adachi, Ponge and Raabe11 However, the limited ductility of UFG steels render them impractical for engineering applications.Reference Howe12, Reference Tsuji, Ito, Saito and Minamino13 Tsuji et al.Reference Tsuji, Kamikawa, Ueji, Takata, Koyama and Terada14 have attributed the limited ductility to the lack of strain hardening capability in UFG microstructures, and the introduction of softer phases and the Transformation-Induced Plasticity effect have been used to partially overcome this issue.
In Guo et al.,Reference Guo, Lee and Morris15 the ductility in lath martensitic steels is related to the coherence length on the {110} and {112} slip planes, while fracture toughness is related to the coherence length on the {100} cleavage planes. Grain refinement reducing the coherence length on the cleavage planes relative to the slip planes through intercritical heat treatments have been used to achieve high strengths and toughness.Reference Jin, Morris and Zackay16, Reference Kim, Kim and Morris17 However, the relative effects of block and packet boundaries on dislocation transmission and the coherence length on the slip and cleavage planes are not clearly understood, where the size of cleavage facets in transgranular fracture modes have been related to both the packetReference Inoue, Matsuda, Okamura and Aoki18, Reference Matsuda, Okamura, Inoue and Mimura19 and block sizes.Reference Hughes, Smith, Crocker and Flewitt20 The presence of block and packet boundaries is also known to significantly influence deformation in martensitic microstructures.Reference Shibata, Nagoshi, Sone, Morito and Higo21, Reference Ohmura and Tsuzaki22 Complex interactions between dislocations and boundaries can lead to different interfacial behavior that can have a significant effect on the nucleation and propagation of transgranular and intergranular cracks.Reference Kim, Hong and Lee23, Reference Zhang, Wang and Eckert24 The high angle misorientations at variant interfaces act as strong barriers to dislocation movement, resulting in dislocation absorption and dislocation pileups, and can consequently affect crack directions, such as rendering transgranular cracks into intergranular cracks.Reference Qiao and Argon25–Reference Robertson, Lee and Birnbaum27
These investigations clearly indicate that the morphology and distribution of the blocks and packets have a significant influence on the ductility and toughness of martensitic microstructures, through the complex interactions of the packet and block boundaries with the evolving dislocation microstructure and propagating cracks. However, a systematic investigation of the relationship between refined lath microstructures and material behavior is lacking, and design guidelines for the tailoring of variant distributions to further improve the ductility and toughness in martensitic steels are not well established. The objective of the present work, therefore, is to develop an integrated framework that incorporates material descriptions, based on dominant martensitic microstructural features, with specialized computational representations of evolving failure surfaces and microstructurally based failure criteria, and to accurately model the initiation and evolution of failure in martensitic steels. A physically based dislocation–density grain boundary (GB) interaction scheme that is representative of the resistance to dislocation transmission across block and packet boundaries is developed and used to determine favorable distributions of blocks and packets for plastic slip transmission. It is incorporated into a multiple-slip dislocation–density-based constitutive formulation, which accounts for variant morphologies and ORs that are uniquely inherent to lath martensitic microstructures. Some of the disadvantages of existing crack propagation methods are overcome through the use of a specialized finite-element (FE) methodology using overlapping elements to represent failure surfaces,Reference Hansbo and Hansbo28 and a failure criterion based on the evolving orientation of the cleavage planes in different martensitic variants is developed. This framework is then used to perform large-scale FE simulations to characterize the dominant dislocation–density mechanisms for the localization of plastic strains and the initiation and propagation of failure in martensitic microstructures.
This paper is organized as follows: the dislocation–density crystalline plasticity formulation, the derivation of the dislocation–density GB scheme, and the martensitic microstructure representation are presented in Sec. II; the numerical implementation of the failure surface representation and mictostructural failure criterion, which is based on resolving stresses along fracture planes, are outlined in Sec. III; the results are presented and discussed in Sec. IV; and a summary of the results and conclusions is given in Sec. V.
II. DISLOCATION–DENSITY-BASED MULTIPLE-SLIP FORMULATION
In this section, the multiple-slip crystal plasticity rate-dependent constitutive formulation and the derivation of the evolution equations for the mobile and immobile dislocation–densities, which are coupled to the constitutive formulation, are presented.
A. Multiple-slip crystal plasticity formulation
The crystal plasticity constitutive framework used in this study is based on the formulation developed by Asaro and RiceReference Asaro and Rice29 and Zikry.Reference Zikry30 It is assumed that the velocity gradient is decomposed into a symmetric deformation rate tensor Dij and an antisymmetric spin tensor Wij. Dij and Wij are then additively decomposed into elastic and inelastic components as


The inelastic parts are defined in terms of the crystallographic slip rates as
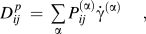
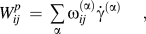
where α is summed over all slip systems, and  and
 are the symmetric and antisymmetric parts of the Schmid tensor in the current configuration, respectively.
A power law relation can characterize the rate-dependent constitutive description on each slip system as
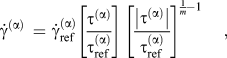
where  is the reference shear strain rate, which corresponds to a reference shear stress
 , and m is the rate sensitivity parameter.
 is the resolved shear stress on slip system α. The reference stress used is a modification of widely used classical formsReference Franciosi, Berveiller and Zaoui31 that relate reference stress to immobile dislocation–density
 as

where  is the static yield stress on slip system α, G is the shear modulus, nss is the number of slip systems,
 is the magnitude of the Burgers vector, and
 are Taylor coefficients, which are related to the strength of interactions between slip systems.Reference Devincre, Hoc and Kubin32–Reference Kubin, Devincre and Hoc34T is the temperature, T 0 is the reference temperature, and ξ is the thermal softening exponent.
B. Mobile and immobile dislocation–density evolution equations
Following the approach of Zikry and Kao,Reference Zikry and Kao35 it is assumed that, for a given deformed state of the material, the total dislocation–density,  , can be additively decomposed into a mobile and an immobile dislocation–density,
 and
 , respectively. During an increment of strain on a slip system, a mobile dislocation–density rate is generated and an immobile dislocation–density rate is annihilated. Furthermore, the mobile and immobile dislocation–density rates can be coupled through the formation and destruction of junctions as the stored immobile dislocations act as obstacles for evolving mobile dislocations. This is the basis for taking the evolution of mobile and immobile dislocation–densities as


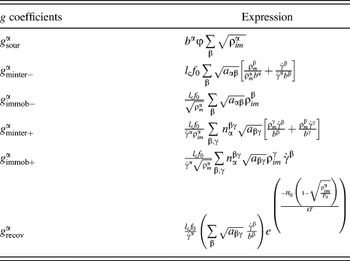
where g sour is a coefficient pertaining to an increase in the mobile dislocation–density due to dislocation sources, g mnter are coefficients related to the trapping of mobile dislocations due to forest intersections, cross-slip around obstacles, or dislocation interactions, g recov is a coefficient related to the rearrangement and annihilation of immobile dislocations, and g immob are coefficients related to the immobilization of mobile dislocations.
C. Determination of dislocation–density evolution coefficients
To couple the evolution equations for mobile and immobile dislocation–densities to the crystal plasticity formulation, the nondimensional coefficients in Eqs. (5) and (6) were determined as functions of the crystallography and deformation mode of the material, by considering the generation, interaction, and recovery of dislocation–densities in Shanthraj and Zikry.Reference Shanthraj and Zikry36 These expressions are summarized in Table I, where f 0 and  are geometric parameters. H 0 is the reference activation enthalpy, ρs is the saturation density, and the average junction length, lc, can be approximated as
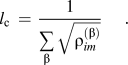

The interaction tensor,  , is defined as having a value of 1 if dislocations on slip systems β and γ interact to form an energetically favorable junction on slip system α and a value of 0 if there are no interactions.
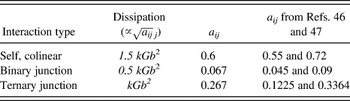
The Taylor interaction coefficients,  , for the slip system interactions in BCC crystalline materials, which are required to determine the reference shear stress [Eq. 4] and the evolution of mobile and immobile dislocation–densities [Eqs. (5) and (6)], have been calculated in Ref. Reference Shanthraj, Hatem, Zikry, Dronskowski, Turchi, Adachi and Raabe37 and listed in Table II, where k is a proportionality constant.
Interaction coefficient values for the types of reactions between slip systems in bcc crystals. The dissipation values indicate the energy dissipated due to the corresponding dislocation interaction type.

D. Dislocation–density GB interaction scheme
In this section, a dislocation–density GB interaction scheme is presented. It is assumed that the dislocation–density interactions occur between slip systems on each side of the GB. Following Ma et al.,Reference Ma, Roters and Raabe38 the dislocation–density transmission is modeled as an activational event, and the constitutive relation [Eq. (3)] has been modified at the GB through the introduction of a transmission factor P (α):

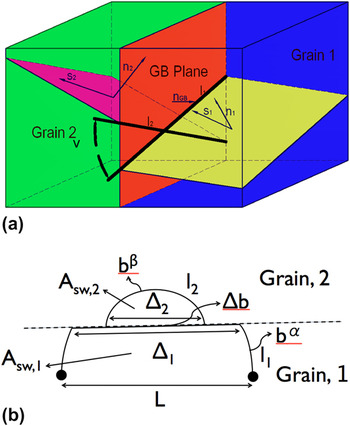
where the line tension model for the activation of a Frank–Read source in the presence of a GB developed in de Koning et al.Reference de Koning, Miller, Bulatov and Abraham39 is used to obtain the energy required for dislocation–density transmission across a GB,  . The energy of such a dislocation configuration (Fig. 1), for incoming and outgoing slip systems α and β, is given by
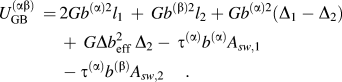
Dislocation configuration of a Frank–Read source in the vicinity of a GB.

The magnitude of the effective residual Burger’s vector,  , is related to the residual Burger’s vector,
 , by

where
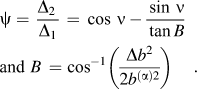
For the critical configuration of a Frank–Read source, it is assumed that the geometric parameters are constant. The energy required to drive the system to the critical configuration, and thus initiate dislocation–density glide across a GB, which is taken here to be the energy required for dislocation–density transmission across a GB, for incoming and outgoing slip systems α and β, can then be simplified as

where c 1–c 4 are constants related to the geometric parameters at the critical configuration. They are given by c 1b = 2l 1 + l 2 and c 1c 2b = Δ2, and using the condition that for activated boundaries with no misorientation,  , we obtain c 3 = 0.5 and c 4 = 0.5. Dislocation–density transmission is assumed to be for the most energetically favorable outgoing slip system
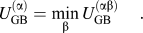
In the FE implementation, the modified constitutive relation [Eq. (8)] is used for elements in the vicinity of the GB, which implies that the motion of dislocation–densities within the element width, L e, is constrained by the GB. However, only the motion of dislocation–densities within the GB region, L gb « L e, should be affected by the GB, and the dislocation–density motion in the FE implementation at the GB is overconstrained. To overcome this spurious constraint, the activation energy for dislocation–density transmission  is relaxed by a scaling factor L gb/L e, which absorbed into the constant c 1. Through this formulation, the criteria for dislocation–density transmission proposed by Lee et al.Reference Lee, Robertson and Birnbaum40 have been incorporated into a physical model for dislocation–density GB interaction:
(i) The misorientation between the slip planes must be minimum;
(ii) The magnitude of the residual Burger’s vector at the GB must be minimum;
(iii) The shear stress on the outgoing slip system must be maximum.
Furthermore, the flux of dislocation–densities across the GB is given by
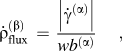
where β is the most favorable outgoing slip system and w is the boundary width, and the accumulation of residual GB dislocation–densities is given by
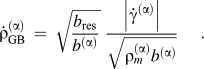
E. Martensitic microstructural representation
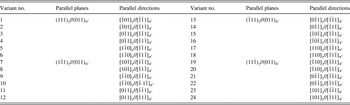
Following Hatem and Zikry,Reference Hatem and Zikry41 the martensitic lath structure is related to the global coordinates through the parent austenite grain orientation and variant orientations. Commonly accepted ORs for lath martensitic steels are Kurdjumov–Sachs (KS) and Nishiyama–Wassermann (NW) ORs. KS ORs are based on a γ austenite transformation to α′ martensitic transformation as  . The NW OR is a KS OR with a 5.12 degree rotation around the [011]γ direction. The 24 variants obtained from a KS OR are tabulated in Table III.
The 24 variants corresponding to the KS OR.

To relate the martensitic local orientation to the global orientation, three transformations are needed. The first transformation, [T]1, relates an observed OR to a theoretical OR, such as KS and NW ORs. The second transformation, [T]2, relates a martensite OR to the parent austenite grain orientation. The third transformation, [T]3, relates the austenite grain orientation to the global coordinates. These transformations are given by  .
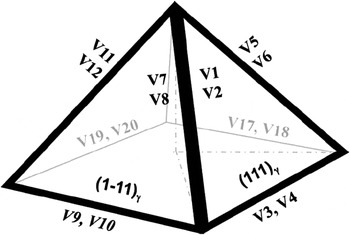
To classify the martensitic microstructure, we will follow the characterization scheme of Morito et al.Reference Morito, Tanaka, Konishi, Furuhara and Maki1 We designate a block as a group of laths with low angle misorientation and a packet as a collection of blocks with the same habit plane. The lath long directions are oriented along [011]γ as shown in Fig. 2. Blocks will have the largest dimension aligned with the constituent lath long direction. Using this methodology, we can use the ORs and original austenite orientations to model different variant orientations for different blocks and packets arrangements.
The alignment of variant lath long directions.

III. COMPUTATIONAL REPRESENTATION OF FAILURE SURFACES AND MICROSTRUCTURAL FAILURE CRITERION
In this section, a method for the representation of the initiation and evolution of failure surfaces using overlapping elements and a microstructural criterion for fracture in martensitic steels is presented.
A. Computational representation of failure surfaces
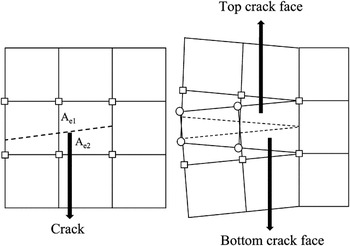
Following the work by Hansbo and Hansbo,Reference Hansbo and Hansbo28 we consider an element in a FE mesh with area A 0, which is crossed by a crack, dividing the element domain into two subdomains with areas Ae 1 and Ae 2 (Fig. 3). Adding an overlapping element on top of the existing element represents the displacement discontinuity due to the crack surface. The connectivity of the overlapping element is defined such that the two elements do not share nodes and therefore have independent displacement fields. For a four-node quadrilateral element with reduced integration and hourglass control, the internal nodal force vector of the cracked element is given byReference Song, Areias and Belytschko42:

Representation of a crack using overlapping elements.

where fe 1 and fe 2 are the internal nodal force vectors of the overlapping elements representing the cracked element and is given by:

To improve numerical performance, a penalty force, which decays with time, is added to resist large initial relative displacements between overlapping elements due to the sudden loss in stiffness of a cracked element. The penalty force is given by

where α is a penalty parameter.
B. Fracture in martensitic steels
The inherent fracture mode in martensitic steels is cleavage on the {100}α′ planes in the microstructure.Reference Guo, Lee and Morris15 To formulate this into a microstructural failure criterion, the orientation of the cleavage planes for each variant in the global coordinate system is obtained by applying the series of transformations outlined in Sec. II. E.

The global orientation of the cleavage planes in the current configuration is then obtained by updating at every time step as a function of lattice rotations as  .
The normal component of the traction acting on each cleavage plane has a direct influence on fracture along that plane. The maximum, over all the {100}α′ cleavage planes, of the normal component of the traction on these planes is, therefore, used as the failure criterion as

A crack is assumed to nucleate when t cleave is greater than a specified fracture strength, σfrac, and the crack is oriented along the most favorable cleavage plane.
The total deformation rate tensor,  , and the plastic deformation rate tensor,
 , are needed to update the material stress state. The method used here is the one developed by ZikryReference Zikry30 for rate-dependent crystalline plasticity formulations, and only a brief outline will be presented here. To overcome numerical instabilities associated with stiffness, a hybrid explicit–implicit method is used to obtain the plastic deformation rate tensor,
 . This hybrid numerical scheme is also used to update the evolutionary equations for the mobile and immobile densities.
IV. RESULTS AND DISCUSSION
Ductility in martensitic steels is directly related to the transmission of plastic slip across variant boundaries.Reference Tsuji, Kamikawa, Ueji, Takata, Koyama and Terada14, Reference Guo, Lee and Morris15, Reference Shibata, Nagoshi, Sone, Morito and Higo21 The slip transmission factor (Sec. II. D),
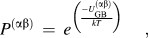
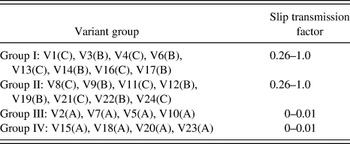
between the most active slip systems α and β across a variant boundary can therefore be used as a measure of the ductility. The activation energy,  , is given by Eq. (12). Taking τ/τref as approximately unity for the most active slip systems, the transmission factor can then be reduced to a function of the orientation of the interacting slip planes, slip directions, and GB. The orientation of the slip plane and slip direction of the most active slip system in a variant is determined from the variant OR (Table III) for a cube oriented parent austenite grain. The transmission factor across the variant boundaries for the 24 KS variants is calculated using Eq. (12) for different GB orientations. The variants are grouped based on the transmission factors in Table IV. The boundaries between variants belonging to group I and II have large transmission factors (>0.26), which is desirable for ductility, while variant boundaries in group III and IV have low transmission factors (<0.01), which can result in slip blockage, stress accumulation, and crack nucleation. In addition, fracture resistance in martensitic steels is related to the misorientation between the cleavage planes across variant boundaries (Sec. III). The KS variants can be categorized into three Bain groups: A, B, and C, as indicated in Table IV, where variants belonging to each Bain group have low misorientations in the {100} cleavage planes. Boundaries between variants belonging to different Bain groups can have large misorientations in the {100} cleavage planes,Reference Guo, Lee and Morris15 which can be desirable for fracture resistance as it can result in crack deflection and crack arrest. A microstructural distribution, which increases the boundaries between variants belonging to different Bain groups and having large slip transmission factors (Table IV), therefore optimizes ductility and fracture toughness in martensitic steels.
Slip transmission factor across variant boundaries indicating Bain groups A, B, and C.

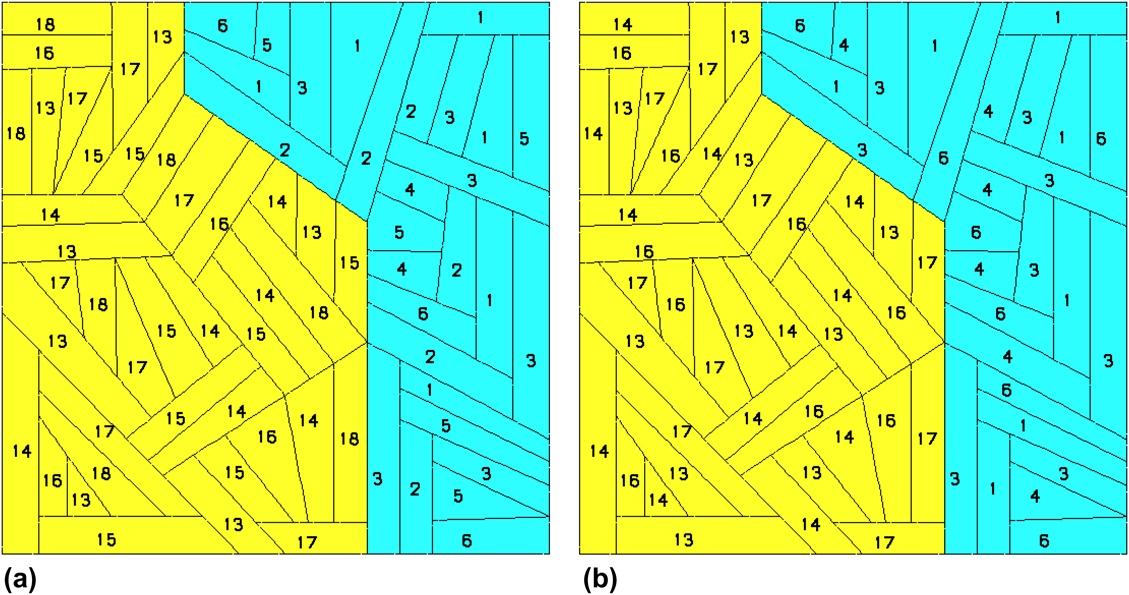
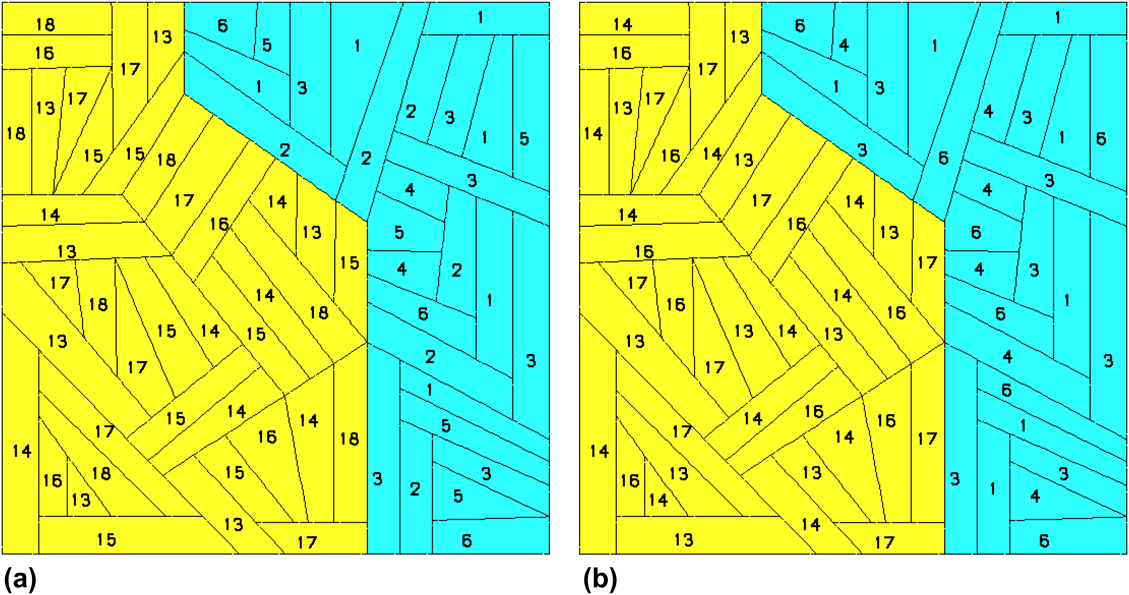
Based on these guidelines, the microstructure associated with a single parent austenite grain for a random and optimized variant distribution on the (100)γ plane is shown in Fig. 4, where 68 blocks are distributed within two packets and the block morphology is obtained by projecting the constituent lath variant long direction (Fig. 2) onto the plane. For the optimized variant distribution, only variant boundaries belonging to group I is used and the use of boundaries between variants belonging to the same Bain group is restricted to be along the less effective lath lateral direction (Fig. 4b). The variant orientation is represented as outlined in Sec. II. E. The parent austenite grain is assumed to have a Cube orientation, and the KS relation is adopted as the martensite OR with {111}γ as the habit plane.
Block and packet distribution in (a) random variant distribution and (b) optimized variant distribution. Packets are represented by distinct colors, and numbers in blocks indicate the constituent lath variant (Table III).
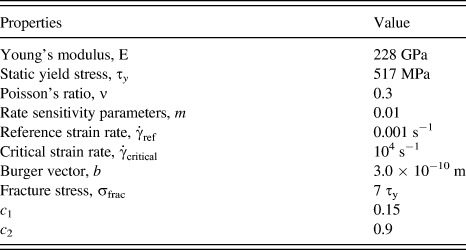
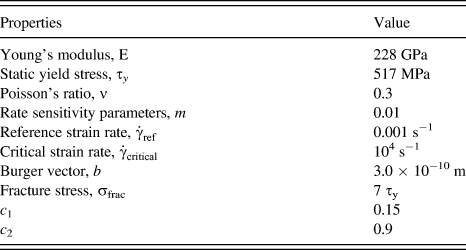
The multiple-slip dislocation–density-based crystal plasticity formulation, the dislocation–density–GB interaction scheme, and the representation of cracks using overlapping elements were then used to investigate the microstructural failure behavior. A convergent plane strain FE mesh with approximately 9000 elements was subjected to tensile loading along the (001) direction at nominal strain rate of 10−4 and 5000 s−1. The material properties (Table V) that are used for the constituent crystals are representative of low nickel alloy steel.Reference Hatem and Zikry41, Reference Hatem and Zikry43
Material properties.
A. Random variant distribution
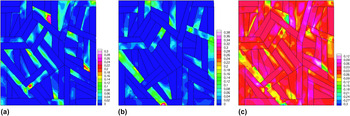
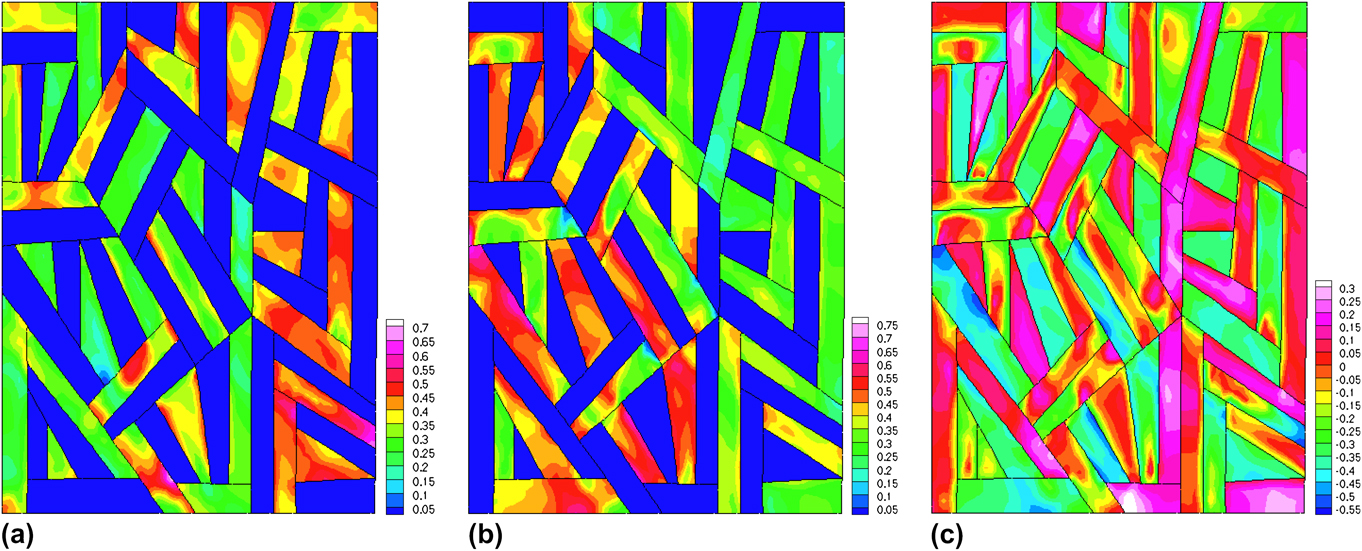
The normalized (by the saturation dislocation–density) mobile dislocation densities corresponding to the two most active slip systems at a nominal strain of 4.8%, which is just before the onset of crack nucleation, are shown in Fig. 5(a) and 5(b). The maximum normalized mobile dislocation densities are 0.30 for slip system  and 0.38 for slip system
 . The normalized interaction density

Normalized mobile dislocation–densities for a random variant distribution at a nominal strain of 4.8% on (a) slip system  , (b) slip system
 , and (c) normalized interaction density at a strain rate of 10−4 s−1.

which is the increase in immobile dislocation density due to junction formation relative to the decrease of mobile dislocation density, is shown in Fig. 5(c). Negative values, with a minimum of −0.35, indicate that the annihilation of dislocation junctions through self and colinear dislocation interactions is dominant. Positive values, with a maximum of 0.12, indicate that the formation of dislocation junctions through binary and ternary dislocation interactions is dominant (Table II). The dominant interaction type is determined by the active slip systems in each variant and using the interaction tensor (Sec. II. C).
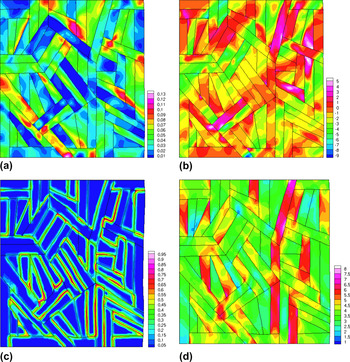
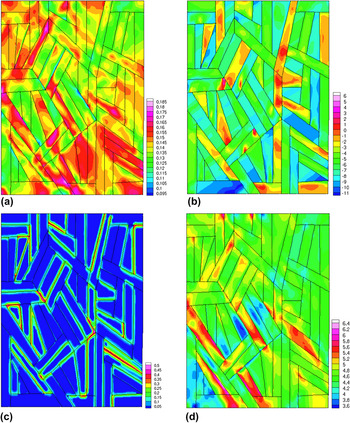
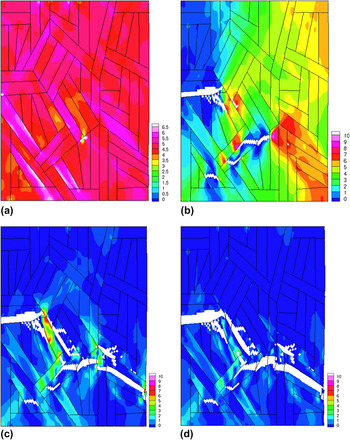
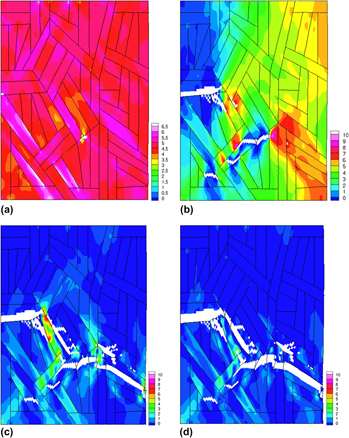
The accumulated plastic slip at a nominal strain of 4.8% is shown in Fig. 6(a). The maximum accumulated slip is 0.13. The loading is aligned along the [001]γ direction, which results in a maximum resolved shear stress along the [011]γ directions. The [011]γ directions are also parallel to the long direction of the laths and blocks and to the slip direction [111]α′ based on the KS OR. This configuration, which aligns the slip systems with the maximum resolved shear stress, along with local material softening mechanisms due to the annihilation of dislocations in the blocks corresponding to a negative interaction density [Fig. 5(c)] result in the localization of shear strain. Mobile dislocation–densities are transmitted across the block boundaries between the active  and
 slip systems through the compatibility of the slip systems, which is associated with a low activation energy [Eqs. (12) and (13)], and result in shear pipes for the formation of shear bands.Reference Hatem and Zikry41 The accumulation of plastic slip is observed along high-angle boundaries as a result of dislocation density blockage due to slip system incompatibility, which is exacerbated by lattice rotations [Fig. 6(b)], and is also observed experimentally.Reference Morito, Tanaka, Konishi, Furuhara and Maki1
(a) Plastic slip, (b) Lattice rotations, (c) GB dislocation density, and (d) normal stress for a random variant distribution at 4.8% nominal strain indicating dislocation–density pileup and plastic slip accumulation at a strain rate of 10−4 s−1.

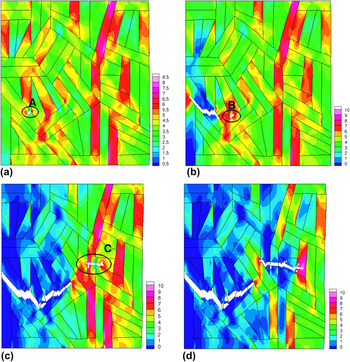
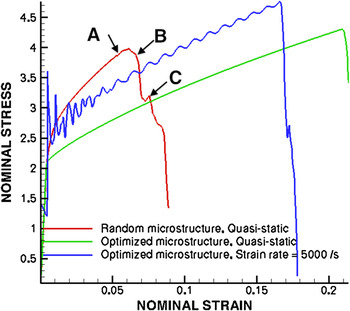
The total normalized GB dislocation density due to all active slip systems at a nominal strain of 4.8% is shown in Fig. 6(c). The normalized GB dislocation density attains a maximum value of 0.95, which is due to the pileup of dislocation–densities at the block and packet boundaries. This occurs along block boundaries between variant pairs belonging to group III and IV in Table IV, which have large incompatibilities between the active slip systems and low slip transmission factors. This results in large local stress concentrations along high-angle block and packet boundaries, with a maximum normalized stress (by static yield stress) of 8.0, as shown in Fig. 6(d). The nucleation of a crack occurs at 5.0% nominal strain at a triple junction between variants 13, 17, and 18 [Fig. 7(a)], as a result of the local stress concentrations [Fig. 6(d)] due to GB dislocation density accumulation at the triple junction [Fig. 6(c)]. The crack initially grows across the block width in variant 13 but is deflected at the boundaries with variant 17 and is constrained to propagate along the block morphology [Fig. 7(b)] because variant 17 is not favorably oriented for fracture as it belongs to a different Bain group resulting in a large misorientation in the cleavage planes along which the crack propagates. A new crack is then nucleated in a neighboring block due to the large stress buildup ahead of the arrested crack tip [Fig. 7(b)]. The neighboring block morphologies are such that the lath long directions is normal to the crack propagation path, which results in resistance to crack propagation, defection of the crack path along the variant boundaries due to the GB dislocation–density accumulation and cleavage plane incompatibilities, and the nucleation of microcracks ahead of the arrested crack tip [Fig. 7(c) and 7(d)]. These intergranular and transgranular fracture modes are consistent with experimental observations,Reference Inoue, Matsuda, Okamura and Aoki18, Reference Matsuda, Okamura, Inoue and Mimura19, Reference Krauss44 as well as crack path deflection and crack arrest.Reference Hughes, Smith, Crocker and Flewitt20 The nominal stress (normalized by the static yield stress)–strain curve indicating the toughening due to crack arrest and deflection at incompatible variant boundaries, and the stress drop due to the subsequent nucleation of secondary cracks during the different stages of crack propagation [Fig. 7(a)–7(d)] is shown in Fig. 8.
Normal stress for a random variant distribution at (a) 5.0% nominal strain, (b) 6.8% nominal strain showing crack nucleation, (c) 8.0% nominal strain, and (d) 8.8% nominal strain showing crack propagation at a strain rate of 10−4 s−1.

Nominal stress–strain curves.

B. Optimized variant distribution
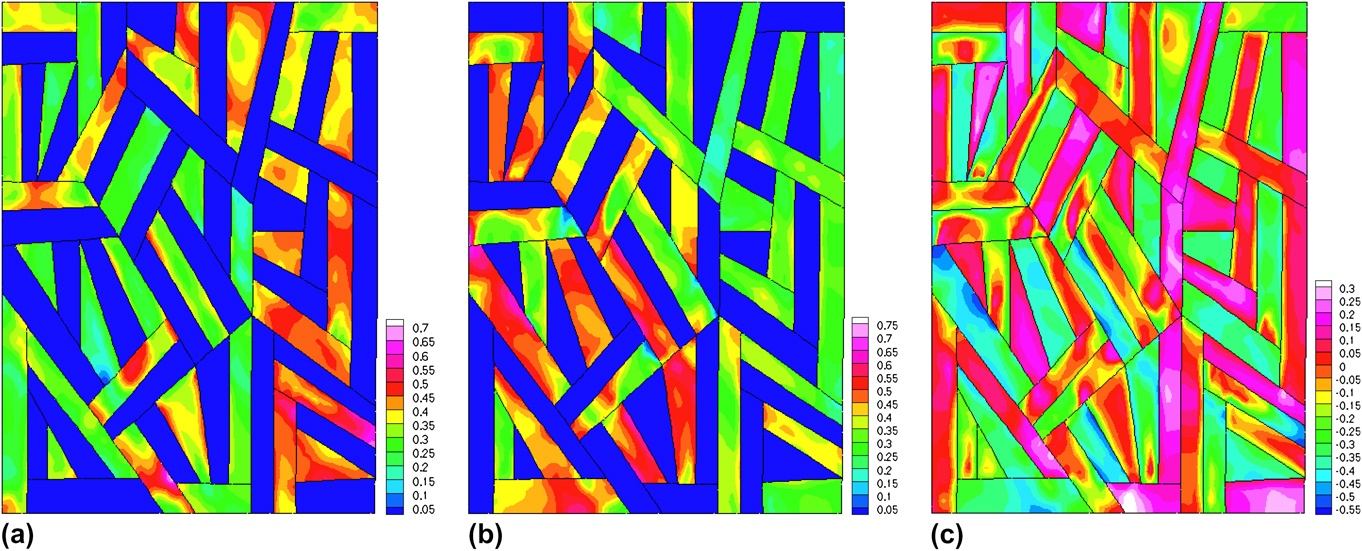
These results are compared with the failure behavior of a variant distribution, optimized for slip transmission [Fig. 4(b)]. The normalized mobile dislocation densities corresponding to the two most active slip systems at a nominal strain of 20% are shown in Fig. 9(a) and 9(b). The maximum normalized mobile dislocation density is 0.7 for slip system  and 0.75 for slip system
 , compared to 0.3 and 0.38, respectively, for the random variant distribution. The mobile dislocation–density activity on these slip systems corresponds to a negative interaction density with a minimum value of −0.55 [Fig. 9(c)] compared to −0.35 for the random variant distribution, indicating a greater degree of dislocation annihilation activity. The accumulated plastic slip and the resulting lattice rotation at a nominal strain of 20% are shown in Fig. 10(a) and 10(b). Larger accumulated slip is observed, with a maximum of 0.19 compared to 0.13 for the random variant distribution, with lattice rotations ranging from −11° to 6°. The localization of shear strain in relation to the lath orientation, interaction density, and lattice rotations [Fig. 10(b)] occur as discussed in Sec. IV. A. The plastic slip is not constrained to flow along the lath long directions as in the random variant distribution, as the low activation energy associated with the transmission of dislocation–densities between the active slip systems in neighboring blocks results in extensive plastic deformation, and lower accumulated GB dislocation densities with a maximum normalized GB dislocation–density of 0.5 [Fig. 10(c)] compared to 0.95 in the random variant distribution. This also results in a more homogeneous normal stress distribution [Fig. 10(d)], with a maximum normal stress level of 6.5, as a result of the relaxation of stress concentrations at the block and packet boundaries due to dislocation transmission.
Normalized mobile dislocation densities for an optimized variant distribution at a nominal strain of 20% on (a) slip system  , (b) slip system
 , and (c) normalized interaction density at a strain rate of 10−4 s−1.
(a) Plastic slip, (b) Lattice rotations, (c) GB dislocation density, and (d) normal stress for an optimized variant distribution at 20% nominal strain indicating dislocation–density pileup and plastic slip accumulation at a strain rate of 10−4 s−1.

In contrast to the random variant distribution, where the refinement of the block and packet sizes increases the number of incompatible variant triple junctions, which serve as sites for stress concentrations due to the accumulation of GB dislocations, and results in the nucleation of a crack at a lower nominal strain of 5%, the large slip transmission factors associated with boundaries between variants belonging to group I in the optimized variant distribution decreases the number of incompatible variant triple junctions and results in the delayed nucleation of cracks, at a nominal strain of 21%, and increased ductility. The dislocation–density transmission and relaxation of stress at the boundaries also result in a reduction in strength of approximately 350 MPa (Fig. 8) since the microstructural strength is associated with the resistance to plastic slip. Block size refinement is effective in improving fracture resistance by arresting the crack to propagation across variants belonging to different Bain groups. Since the crack propagation path is constrained along the lath long direction, the effects of both block and packet refinement should be considered in relation to the lath morphology in determining fracture behavior.
C. Dynamic behavior
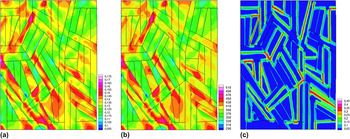
In this section, we investigate the dynamic fracture of the optimized microstructure at a loading rate of 5000 s−1. The nominal stress–strain curves over the range of loading conditions are shown in Fig. 8. The oscillations at high strain rates occur due to stress wave reflections along the free and fixed boundary, which is dampened due to the dissipative plastic mechanisms. The lower failure strain of 16% at a strain rate of 5000 s−1 is a result of dynamic strain-rate hardening (Fig. 8). The accumulated plastic slip at a nominal strain of 16% at a strain rate of 5000 s−1 is shown in Fig. 11(a). The maximum accumulated slip is 0.175 compared to 0.19 under quasistatic loading, and the shear strain localization is narrower at higher strain rates, which is a result of material and thermal softening mechanisms, with a maximum temperature of 518 K, which is approximately 0.5T solidus, as well as the dynamic strain rates, which prevent the accumulation of shear strains over wide regions. Narrow shear strain localization at higher strain rates is consistent with the experimental observations of Dodd and Bai.Reference Dodd and Bai45 A lower accumulation of GB dislocation–densities, with a maximum value of 0.45 compared to 0.5 under quasistatic loading, occurs as a result of the strain-rate hardening at high strain rates [Fig. 11(c)]. At this strain rate, crack nucleation occurs at a nominal strain of 16%, as shown in Fig. 12(a). Crack deviation, crack arrest, and secondary crack nucleation occurs due to boundaries between variants belonging to different Bain groups, with large incompatibilities in the cleavage planes, along the variant long directions [Fig. 12(b)–12(d)]. This results in a greater fracture resistance upon block size refinement. The high strain rate characteristics result in fracture modes that are different from quasistatic strain rates.
(a) Plastic slip, (b) temperature, and (c) GB dislocation density for an optimized variant distribution at 16% nominal strain indicating dislocation–density pileup and plastic slip accumulation at a strain rate of 2500 s−1.

Normal stress for an optimized variant distribution at (a) 16% nominal strain, (b) 17% nominal strain showing crack nucleation, (c) 18% nominal strain, and (d) 19% nominal strain showing crack propagation at a strain rate of 5000 s−1.

V. CONCLUSION
A physically based dislocation–density GB interaction scheme that is representative of the resistance to dislocation–density transmission across block and packet boundaries in martensitic steel has been developed and was incorporated into a dislocation–density-based multiple-slip crystalline plasticity framework, which accounts for variant morphologies and ORs that are uniquely inherent to lath martensitic microstructures. Specialized FE methodologies to represent evolving failure surfaces and a microstructurally based failure criterion for cleavage were then used to perform large-scale FE simulations to characterize and predict the dominant dislocation–density mechanisms for the localization of plastic strains and the initiation and propagation of failure in martensitic microstructures over a range of loading conditions.
A slip transmission criterion and microstructural failure based on resolving stresses onto variant cleavage planes is used to determine optimal distributions of blocks and packets. The results indicated that for random variant distributions, the variant interfaces along the lath long direction were dominant, with plastic slip constrained by these interfaces to flow along the lath long direction, and slip transmission to neighboring blocks was accommodated through compatible slip systems or the formation of low energy residual GB dislocations. The effective block size refinement for strengthening was determined to be along the lath long direction. These interfaces also result in resistance to crack propagation and deviation of the crack path along the variant boundaries due to the GB dislocation–density accumulation and cleavage plane incompatibilities. However, block size refinement also increases the number of incompatible triple junctions, which serve as sites for stress concentrations, and results in the nucleation of a crack at a lower nominal strain. In optimized variant distributions, increased ductility, delayed crack nucleation, and greater resistance to crack propagation occurred as a result of greater slip transmission and misorientation between cleavage planes. Through quantifying these mechanisms (Table V), which control the nucleation and propagation of different failure modes, validated design guidelines for a new generation of high strength and high toughness steels can be obtained.
ACKNOWLEDGMENTS
Support from the Office of Naval Research through Grant N000 10848631 is gratefully acknowledged.