Implications
Oilseed-supplemented diets varying in n-6/n-3 ratio can alter the fatty acid profile of steer cheek and diaphragm muscles. Linseed increased polar lipid 18:3n-3 in both muscles, whereas soya bean increased polar lipid 18:2n-6. Expression of delta-5 desaturase (Δ5d) and delta-6 desaturase (Δ6d) proteins differed in response to supplement ratio and muscle, in turn affecting muscle long-chain polyunsaturated fatty acids (LC, ⩾20 carbons PUFA) formation. The LC n-6/n-3 ratio was highest for soya bean or soya–canola diets. Influencing the Δ5d and Δ6d protein expression via diet could potentially be used to increase the proportion of LC-PUFA as a means of enhancing the nutritionally functional properties of ruminant meat for consumers.
Introduction
The shared desaturase/elongase pathways leading to the formation of long-chain polyunsaturated fatty acids (LC, ⩾20 carbons PUFA) from the essential dietary fatty acids, namely 18:2n-6 and 18:3n-3, are relatively well defined (Sprecher, Reference Sprecher2000). However, the extent to which variations in dietary PUFA can influence the in vivo formation of LC-PUFA derivatives in meat-producing animals remains unclear. The muscle phospholipid or polar lipid fatty acid composition is relatively static in order to maintain cellular function and signalling; however, some variability does occur because of competition between n-6 and n-3 PUFA for insertion (Raes et al., Reference Raes, De Smet and Demeyer2004). One reason for this might be the effect of diet on protein expression of the lipogenic enzymes, namely delta-5 desaturase (Δ5d) and delta-6 desaturase (Δ6d). Few trials have investigated Δ5d and Δ6d enzyme expression in meat-producing animals. In porcine m. longissimus dorsi, fish oil, but not linseed, increased the Δ5d and Δ6d expression, suggesting that n-3 LC-PUFA could upregulate protein expression (Missotten et al., Reference Missotten, De Smet, Raes and Doran2009). Recent beef studies have investigated the role of Δ5d and Δ6d enzymes in lipogenesis (Ward et al., Reference Ward, Woodward, Otter and Doran2010) and dietary regulation of expression in backfat and longissimus muscle (Herdmann et al., Reference Herdmann, Nuernberg, Martin, Nuernberg and Doran2010). The concept of fatty acids as nutraceuticals is important for promoting the development of functional foods as a means of proactive disease prevention. In particular, attention has been given to 20:5n-3 and 22:6n-3, in relation to reduced inflammatory response processes and as key mediators in neurological development (Palmquist, Reference Palmquist2009). Feeding strategies that affect Δ5d and Δ6d activity and/or expression can potentially enhance the deposition of n-3 LC-PUFA and concomitant nutraceutical properties of the meat, which could have wide-reaching beneficial human health implications.
Beef is considered to be an excellent source of protein and iron, and is also recognized as an important source of LC-PUFA for many cultures (Howe et al., Reference Howe, Meyer, Record and Baghurst2006; Givens and Gibbs, Reference Givens and Gibbs2008). In addition, beef is also a natural source of 18:1t-11 and conjugated linoleic acid (CLA) c-9,t-11, which are known for their beneficial health effects (Park and Pariza, Reference Park and Pariza2007; Roy et al., Reference Roy, Chardigny, Bauchart, Ferlay, Lorenz, Durand, Gruffat, Faulconnier, Sebedio and Chilliard2007). Supplementing ruminant diets with PUFA to increase the content of beneficial fatty acids has been the subject of numerous reviews (Raes et al., Reference Raes, De Smet and Demeyer2004; Givens et al., Reference Givens, Kliem and Gibbs2006; Wood et al., Reference Wood, Enser, Fisher, Nute, Sheard, Richardson, Hughes and Whittington2008). The challenge of feeding unprotected unsaturated fatty acids (UFA) is the extensive modification by rumen microbes yielding biohydrogenation intermediates and saturated fatty acids (SFA; Bauman et al., Reference Bauman, Perfield, de Veth and Lock2003). Manufactured lipids whereby UFA are bound to calcium-salts or acyl-amides to protect them from biohydrogenation have been reviewed by Jenkins and Bridges (Reference Jenkins and Bridges2007). Heat processing of oilseeds, such as by roasting or extrusion, has also been shown to increase PUFA in milk (Glasser et al., Reference Glasser, Ferlay and Chilliard2008) and in beef muscle (McNiven et al., Reference McNiven, Duynisveld, Charmley and Mitchell2004), with the added benefit of increasing the proportion of rumen undegradable protein.
Accessibility and risk of incurring economic damage to the carcass limits the opportunity to collect muscle samples from prime cuts in commercial abattoirs immediately following exsanguination. Therefore, the use of more accessible muscles for evaluation of muscle lipogenesis and fatty acid composition, such as m. masseter and pars costalis diaphragmatis, has considerable appeal. In general, diet has a similar effect on the fatty acid profile across different muscles (Rule et al., Reference Rule, Broughton, Shellito and Maiorano2002). Previously, pars costalis diaphragmatis has been used to demonstrate dietary influences on the fatty acid profile in a number of studies (Gibb et al., Reference Gibb, Owens, Mir, Mir, Ivan and McAllister2004; Mir et al., Reference Mir, Dugan, He, Entz and Yip2008; Dugan et al., Reference Dugan, Aldai, Kramer, Gibb, Juarez and McAllister2010). Moreover, the polar fatty acid profiles of m. masseter and pars costalis diaphragmatis reportedly have similar UFA proportions (Tsuneishi et al., Reference Tsuneishi, Takimoto, Nishimura and Takeda1987), and hence should have comparable responses to different feeding regimes.
The trial objectives were to (i) investigate how feeding oilseeds over a range of n-6/n-3 ratios affects the total and polar fatty acid profiles of cheek (m. masseter) and diaphragm (pars costalis diaphragmatis) muscle, (ii) determine how heat processing by extrusion or roasting oilseeds affects muscle deposition of biohydrogenation intermediates, (iii) identify the presence of Δ5d and Δ6d protein in cheek and diaphragm muscle and (iv) investigate how the supplement and muscle fatty acid profile affects the Δ5d and Δ6d protein expression in these muscles.
Material and methods
Animals and basal diet
Animals used in this trial were from a production trial with diet and trial design reported by McNiven et al. (Reference McNiven, Duynisveld, Turner and Mitchell2011). In brief, steers were housed in a free-stall barn in six pens of eight steers (Trial 1) and five pens of eight (for each Trial 2a and 2b) for a total of 128 animals with an initial live weight of 508 ± 6.0 kg. Animals were fed individually with diets consisting of a total mixed ration (TMR) top-dressed with an oilseed supplement and hand mixed. Each diet was represented by one animal per pen. On a dry matter (DM) basis, the basal TMR consisted of 300 g/kg DM grass silage and 685 g/kg DM barley. The Trial 1 TMR nutrient content was 129.8 g/kg DM CP, 34.7 g/kg DM fat, 566 g/kg DM NDF and 395 g/kg DM ADF. The Trial 2 nutrient content was 115.5 g/kg DM CP, 19.9 g/kg DM fat, 572 g/kg DM NDF and 368 g/kg DM ADF fibre. A vitamin/mineral premix was included in the TMR to provide 500 IU vitamin E daily.
Oilseed supplement
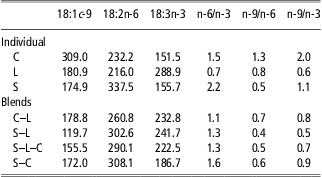
Oilseeds were divided, with half of each lot being roasted or extruded. Linseed and canola were roasted at 121°C for 45 s and soya beans roasted at 143°C for 60 s, on a fluidized bed roaster (Sweet Manufacturing, Springfield, OH, USA). Extrusion was performed by a single screw Insta-Pro extruder (Triple F Inc., Des Moines, IA, USA) with canola and linseed extruded at 72°C for 30 s and soya bean at 130°C for 30 s. Selected temperatures were representative of commercial settings. Oilseed supplements were fed to provide n-6/n-3 ratios ranging from 0.3 : 1 to 5 : 1 using pure or 1 : 1 blends of canola, linseed and soya bean. Feeding groups were designated by the oilseed supplement; with pure oilseeds in Trial 1 supplemented at 2.5 kg per day as-fed and included linseed (L, n-6/n-3 = 0.3, n = 16), canola (C, n-6/n-3 = 2.0, n = 16) or soya bean (S, n-6/n-3 = 5.0, n = 16). Trial 2 blended oilseeds were supplemented at 2.0 kg per day as-fed and included canola–linseed (C–L, n-6/n-3 = 0.6 : 1, n = 20), soya–linseed (S–L, n-6/n-3 = 1.0 : 1, n = 20), soya–linseed–canola (S–L–C, n-6/n-3 = 1.2 : 1, n = 20) and soya–canola (S–C, n-6/n-3 = 3.6 : 1, n = 20). The diet fatty acid profile and specific ratios are presented in Table 1. Soya bean meal and soya bean oil were added to give equivalent lipid and protein contents to the supplements. Steers were slaughtered after 100 to 120 days on the study diets, with an equal number of animals from each treatment being sent on each slaughter date. Steers in Trial 2 animals were split into two replicates because of limited bunk space. One steer from Trial 1 and two steers from Trial 2 were removed from the feeding trials because of factors unrelated to the dietary treatments. A further description of the feeding design and animal welfare considerations can be found in McNiven et al. (Reference McNiven, Duynisveld, Turner and Mitchell2011).
Main fatty acids (mg/g lipid) and select ratios from extruded or roasted oilseed-supplemented dietsFootnote z
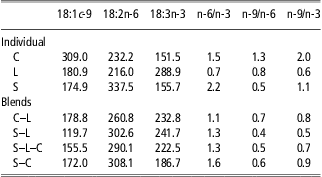
C = canola; L = linseed; S = soya bean; C–L = canola–linseed; S–L = soya–linseed; S–L–C = soya–linseed–canola; S–C = soya–canola.
Oilseed supplements include C, L or S or blends of C–L, S–L, S–L–C or S–C in 1 : 1 ratios.
z Adapted from McNiven et al. (Reference McNiven, Duynisveld, Turner and Mitchell2011).
Sample collection
Samples (roughly 50 g) of cheek (m. masseter) and diaphragm (pars costalis diaphragmatis) muscle were collected within 10 min of exsanguination. Samples were snap-frozen in liquid nitrogen and transported to the lab on dry ice. All samples were stored at −80°C until fatty acids and protein expression analyses. Previous studies have demonstrated that these storage conditions do not affect Δ5d and Δ6d protein expression (Missotten et al., Reference Missotten, De Smet, Raes and Doran2009; Herdmann et al., Reference Herdmann, Nuernberg, Martin, Nuernberg and Doran2010).
Lipid extraction and fatty acid composition analysis
Feed lipid was extracted using the method described by Folch et al. (Reference Folch, Lees and Stanley1957). Muscle was extracted following the method described by Bligh and Dyer (Reference Bligh and Dyer1959). Separation of polar lipid fatty acids was performed using NH2 SPE columns (3 ml to 500 mg, 55 μm, 70a, Phenomenex Inc., Torrance, CA, USA). Columns were activated with 2 × 2 ml hexane before applying 25 mg lipid extract, along with 0.2 mg 1,2-dibehenolyl-sn-glycerol-3-phosphocholine (Avanti Polar Lipids Inc., Alabaster, AL, USA) marker suspended in 1.5 ml CHCl3. Polar fatty acids were eluted with 6 ml methanol through the columns under slight vacuum pressure. Extracts were evaporated under N2 in a 46°C water bath, resuspended in hexane and stored at −20°C until methylation the following day.
Methylation of the feed and muscle fatty acids followed the procedure as described in McNiven et al. (Reference McNiven, Duynisveld, Turner and Mitchell2011). Feed fatty acids were analysed by gas chromatography (model-5890, Agilent, ON, Canada) equipped with a DB23 column (30 m × 0.53 mm i.d. × 0.5 μm film thickness, Agilent), auto-sampler (model-7673, Agilent) and flame ionization detector (FID) set at 250°C. Samples were injected on-column with an initial oven temperature of 70°C for 0.5 min, increasing to 170°C at 10°C/min, held for 3 min, increasing to 210°C at 5°C, held for 6 min, increasing to 230°C and held for 4.2 min. Muscle fatty acids were analysed by gas chromatography (model-5890, Agilent) equipped with a HP-88 column (100 m × 0.25 mm i.d. × 0.20 μm film thickness, Agilent), split injector set at 20 : 1, auto-sampler (model-7673, Agilent) and FID detector. Column oven conditions were as follows: initial temp 70°C, hold for 5 min, increase to 175°C at 10°C/min, hold for 30 min, increase to 250°C at 4°C/min. Injector and FID detector temperatures were 250°C and 260°C, respectively, with hydrogen as the carrier gas. All chromatogram peaks were identified in relation to retention times of standards (Nu-Chek Elysian, MN, USA) and integrated using Agilent Chemstation v A.09.01 software. Results were reported as a proportion (mg/g of identified fatty acids) utilizing published correction factors (Ackman, Reference Ackman2002).
Isolation of microsomal fraction
Isolation of Δ6d and Δ5d enzymes from the microsomal fractions of cheek and diaphragm muscle were prepared by differential centrifugation using the Ca2+ method following the procedure described by Ward et al. (Reference Ward, Woodward, Otter and Doran2010) with minor modification during centrifugation. The Ca2+ method is widely used for increasing yield of microsomes, especially in cases where the amount of tissue from microsomal preparation is limited (Missotten et al., Reference Missotten, De Smet, Raes and Doran2009; Herdmann et al., Reference Herdmann, Nuernberg, Martin, Nuernberg and Doran2010; Ward et al., Reference Ward, Woodward, Otter and Doran2010). In brief, 5 g of muscle was homogenized in 20 ml Tris-sucrose buffer (10 mM Tris-HCl, 250 mM sucrose, pH 7.4), and the homogenate was centrifuged at 12 000×g for 10 min. The recovered supernatant was centrifuged at 45 000×g for 30 min in the presence of 8 mM CaCl2 (final concentration) to facilitate sedimentation of microsomes. The recovered pellet containing the microsomal fraction was resuspended in a Tris-KCl buffer (150 mM KCl and 10 mM Tris-HCl, pH 7.4) containing a mixture of inhibitors of proteolytic enzymes (1.5 μM pepstatin, 1.5 μM antipain, 2.0 μM leupeptin). The total protein concentration was determined by Bradford assay (Bradford, Reference Bradford1976; Bio-Rad Laboratories Inc., ON, Canada) using bovine serum albumin as standard. The average protein concentrations of microsomal extracts ranged between 5 and 8 mg/ml for both muscles.
Western blot analysis
The expression of microsomal Δ5d and Δ6d proteins was analysed by Western blotting. Proteins (10 μg) were separated by SDS-PAGE using Bis-Tris 4% to 12% precast gels (Bio-Rad Laboratories Inc.) at 125 V for 90 min, electroblotted onto the ImmunoBlot PVDF membrane (Bio-Rad Laboratories Inc.) at 15 V for 30 min. The membrane was then probed with either Δ5d or Δ6d primary antibodies at 1 : 500 v/v (custom produced by Sigma, UK). The antibodies were produced in rabbit against the synthetic peptide containing amino acid sequence from the region that is conserved in a number of species near C-terminus of the corresponding protein. The immunoreactive antibodies were previously evaluated and demonstrated to recognize bovine Δ5d and Δ6d proteins (Ward et al., Reference Ward, Woodward, Otter and Doran2010). The membrane with transferred proteins was washed with PBST (100 ml 10× PBS and 900 ml H2O, 1 ml Tween 20, Bio-Rad Laboratories Inc.), and then probed with a commercial goat anti-rabbit secondary antibody at 1 : 10000 v/v (Santa Cruz Biotechnology Inc., Santa Cruz, CA, USA). The blots were developed using the Immuno-Star WesternC kit (Bio-Rad Laboratories Inc.). The membranes were scanned using a UVP Biospectrum AC Imaging System (UVP, Upland, CA, USA), and the intensity of signals of protein bands was quantified using Vision Works LS software v6.7.4 (UVP). The membrane was washed and re-probed using rabbit anti-β actin primary 1 : 000 v/v, and then probed with goat anti-rabbit secondary antibody at 1 : 10 000 v/v (Santa Cruz Biotechnology Inc.). The molecular weight of β-actin is 40 kDa (Santa Cruz Biotechnology Inc.). The expression of a housekeeping protein, β-actin, was analysed and the ratio of Δ5d/β-actin and Δ6d/ β-actin was determined to normalize Δ5d and Δ6d signals on the blots for cross-comparisons.
The optimum amount of protein for Western blotting was detected by calibration. A positive linear relationship between the amount of microsomal protein loaded on gel and the intensity of protein signal was observed in the range between 5 and 20 μg for Δ5d and for Δ6d signals in each muscle, with the clearest bands between 10 and 15 μg for both desaturase proteins in each muscle (data not shown).
Statistical model
Data for each trial were analysed as a completely randomized design using the Proc Mixed procedure of SAS v9.1 (2002). The analysis of variance model included the fixed effects of sub-trial (when applicable), dietary supplement and oilseed heat treatment. Two-way interaction effects between supplement and oilseed heat treatment were investigated. For each muscle, the total and polar fatty acids and Δ5d and Δ6d protein expression reported the least square means and standard error of the means (s.e.m.). On the basis of studentized residuals, a log transformation of the normalized protein expression was warranted. Using the combined Trial 1 and Trial 2 data, the Proc Reg procedure of SAS v9.1 (2002) was used to calculate coefficients for linear regressions between concentrations of muscle total fatty acids against dietary and muscle total fatty acids. Linear regressions were also made between Δ5d and Δ6d protein expression and muscle total and polar lipids. Values of P < 0.05 were considered significant; slope, r 2 are reported in the tables.
Results
The cheek lipid content (g/100 g fresh muscle) in Trial 1 was: linseed = 5.1, canola = 5.6 and soya bean = 5.0; in Trial 2 it was: C–L = 5.0, S–L = 4.8, S–L–C = 4.4 and S–C = 4.7. The diaphragm lipid content (g/100 g fresh muscle) in Trial 1 was: linseed = 12.0, canola = 14.7 and soya bean = 13.0; in Trial 2 it was: C–L = 10.6, S–L = 8.6, S–L–C = 10 and S–C = 10. Trial 1 and Trial 2 results are presented simultaneously within each table for objective comparison of the total and polar fatty acid profiles for each muscle. For both trials, animals fed roasted oilseeds had a slightly higher (P > 0.05) fat content than those fed extruded oilseeds in each muscle. The influence of oilseed processing on the fatty acid profile is presented in the text where applicable. Interactions between diet and oilseed heat treatment were found to be non-significant (P > 0.05).
Total fatty acids
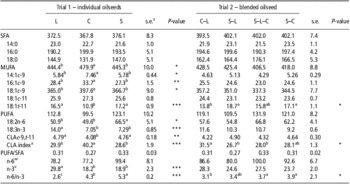
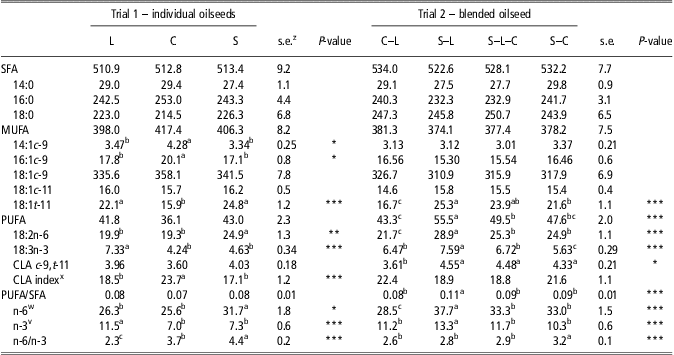
The cheek and diaphragm individual SFA and total SFA were unaffected by diet or processing method in either Trial 1 or Trial 2. The Trial 1 pure canola diet resulted in higher 14:1c-9, 16:1c-9, 18:1c-9 and total MUFA in the cheek muscle (P < 0.05; Table 2) and higher 14:1c-9 and 16:1c-9 in diaphragm muscle (P < 0.05; Table 3). For each muscle, the CLA index was higher for the Trial 1 pure canola diet (P < 0.05). The Trial 2 blended diets had no effect on the levels of cis-MUFA in either muscle; however, the CLA index was highest for the C–L diet in the cheek muscle (P < 0.05), with a similar tendency in the diaphragm muscle (P = 0.06).
Fatty acid profile (mg/g FAME) of m. masseter tissue from steers supplemented with extruded or roasted C, L or S fed individually or blended as C–L, S–L, S–L–C or S–C in 1 : 1 ratios

FAME = fatty acid methyl ester; C = canola, L = linseed; S = soya bean; C–L = canola–linseed; S–L = soya–linseed; S–L–C = soya–linseed–canola; S–C = soya–canola; SFA = saturated fatty acids; MUFA = monounsaturated fatty acids; PUFA = polyunsaturated fatty acid; CLA = conjugated linoleic acid.
a,b,cDifferent letters within a row of individually fed oilseeds or oilseed blends indicate a statistical difference, where *P < 0.05; **P < 0.01; ***P < 0.001.
zStandard error of the means (s.e.).
xCLA index = 100 × (CLA c-9,t-11/18:1 t-11).
wn-6 = 18:2n-6 + 20:4n-6 + 22:4n-6 + 22:5n-6.
vn-3 = 18:3n-3 + 20:5n-3 + 22:5n-3 + 22:6n-3.
Fatty acid profile (mg/g FAME) of pars costalis diaphragmatis tissue from steers supplemented with extruded or roasted C, L or S fed individually or blended as C–L, S–L, S–L–C or S–C in 1 : 1 ratios
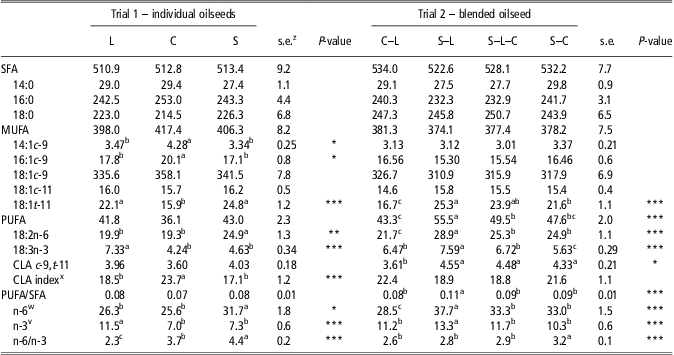
C = canola; L = linseed; S = soya bean; C–L = canola–linseed; S–L = soya–linseed; S–L–C = soya–linseed–canola; S–C = soya–canola; SFA = saturated fatty acids; MUFA = monounsaturated fatty acids; PUFA = polyunsaturated fatty acid; CLA = conjugated linoleic acid.
a,b,cDifferent letters within a row of individually fed oilseeds or oilseed blends indicate a statistical difference, where *P < 0.05; **P < 0.01; ***P < 0.001.
zStandard error of the means (s.e.).
xCLA index = 100 × (CLA c-9,t-11 / 18:1 t-11).
wn-6 = 18:2n-6 + 20:4n-6 + 22:4n-6 + 22:5n-6.
vn-3 = 18:3n-3 + 20:5n-3 + 22:5n-3 + 22:6n-3.
For each muscle, the 18:1t-11 concentration was lowest for the Trial 1 canola diet (P < 0.001), and the Trial 2 C–L diet. Extruded diets resulted in higher 18:1t-11 levels in each muscle for Trials 1 and 2 compared with roasted diets (P < 0.05, results not shown). The cheek muscle CLA c-9,t-11 concentration was lowest for the Trial 1 pure canola diet (P < 0.05), with no difference between diets in Trial 2. Alternatively, in the diaphragm muscle, the Trial 2 C–L diet had the lowest CLA c-9,t-11 concentration (P < 0.05), with no difference between diets in Trial 1. Compared with roasted diets, the Trial 2 extruded diets had higher concentrations of CLA c-9,t-11 in each muscle (P < 0.001, results not shown), whereas in Trial 1 extruded diets only had a higher concentration of CLA c-9,t-11 in the cheek muscle (P < 0.05, results not shown). The CLA index was higher for the Trial 2 roasted diets compared with the extruded diets in each muscle (P < 0.05, results not shown). The Trial 1 soya bean diet had the highest 18:2n-6 and n-6 levels in each muscle (P < 0.05). Alternatively, in each muscle, the Trial 1 linseed diet had the highest 18:3n-3 and total n-3 levels (P < 0.001). Diet effects for Trial 2 were only apparent in the diaphragm, with the S–L diet resulting in higher levels of 18:2n-6, n-6, 18:3n-3 and n-3 (P < 0.001). The diaphragm muscle 18:2n-6 and 18:3n-3 levels were higher for Trial 2 roasted diets than the extruded diets (P < 0.01, results not shown). In each muscle, the n-6/n-3 ratio increased in relation to the dietary n-6/n-3 ratio for Trial 1 and Trial 2 (P < 0.05).
Regression analysis indicated a positive relationship between 18:1t-11 and diet 18:2n-6 in cheek (P < 0.01, r 2 = 0.08) and diaphragm muscles (P < 0.001, r 2 = 0.11), but no relationship to dietary 18:3n-3. A slightly positive relationship existed between diaphragm CLA c-9,t-11 and diet 18:2n-6 (P < 0.05, r 2 = 0.05), but not in the cheek. The CLA index had a negative relationship to 18:2n-6 (P < 0.05, r 2 = 0.04) and 18:3n-3 (P < 0.05, r 2 = 0.05), with a slope of −0.81 v. −5.15, respectively. The diaphragm showed a similar negative slope to the respective fatty acids; however, there were no significant relationships.
Polar lipid fatty acid fraction
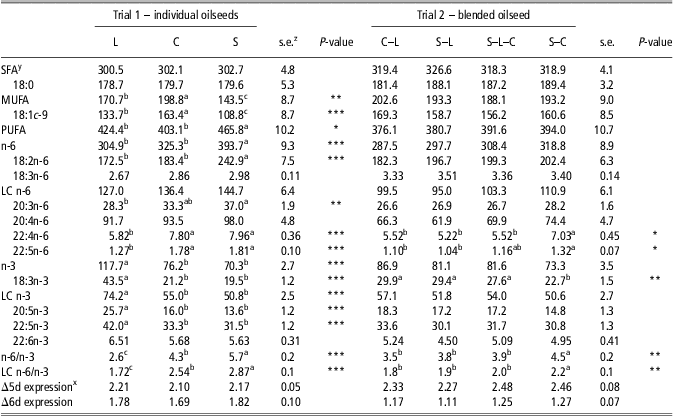
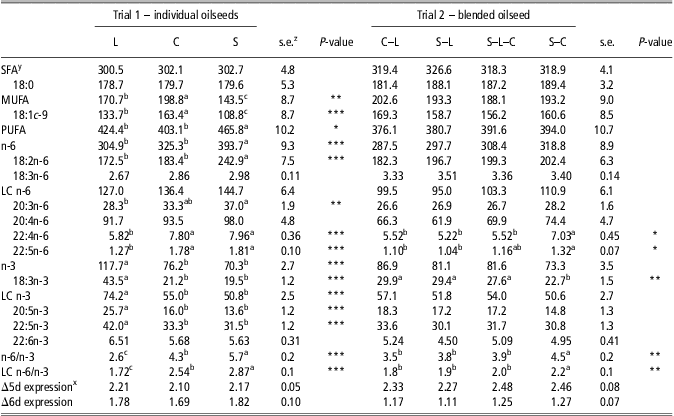
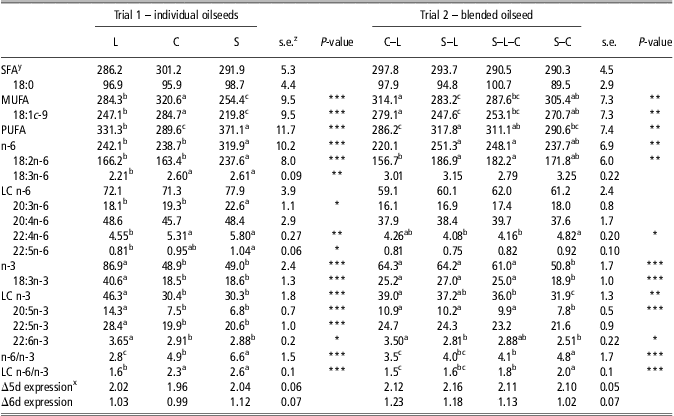
Neither cheek or diaphragm polar lipid 18:0 and SFA concentrations differed between treatments in either trial (P > 0.05; Tables 4 and 5, respectively). In Trial 1, cheek and diaphragm 18:1c-9 and MUFA concentrations were highest for the canola diet and lowest for the soya bean diet (P < 0.01). In Trial 2 diaphragm muscle, the 18:1c-9 and MUFA concentrations were highest for the C–L diet and lowest for the S–L diet (P < 0.01).
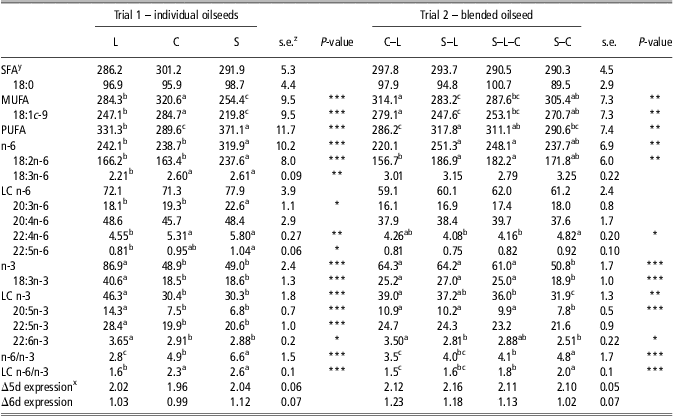
Polar lipid fatty acid profile (mg/g FAME), Δ5 (Δ5d) and Δ6 (Δ6d) expression of m. masseter tissue from steers supplemented with extruded or roasted C, L or S fed individually or blended as C–L, S–L, S–L–C or S–C in 1 : 1 ratios
C = canola; L = linseed; S = soya bean; C–L = canola–linseed; S–L = soya–linseed; S–L–C = soya–linseed–canola; S–C = soya–canola; SFA = saturated fatty acids; MUFA = monounsaturated fatty acids; PUFA = polyunsaturated fatty acid; FA = fatty acid.
a,b,cDifferent letters within individual or blended oilseed treatments indicating statistical difference, where *P < 0.05; **P < 0.01; ***P < 0.001.
zStandard error of the means (s.e.m.).
yn-6, sum of all n-6 FA; LC n-6, sum of n-6 FA ⩾20:3n-6; n-3, sum of all n-3 FA; LC n-3, sum of n-3 FA ⩾20:5n-3.
xDesaturase protein expressed as log value.
Polar lipid fatty acid profile (mg/g FAME), Δ5 (Δ5d) and Δ6 (Δ6d) expression of pars costalis diaphragmatic tissue from steers supplemented with extruded or roasted C, L or S fed individually or blended as C–L, S–L, S–L–C or S–C in 1 : 1 ratios
C = canola; L = linseed; S = soya bean; C–L = canola–linseed; S–L = soya–linseed; S–L–C = soya–linseed–canola; S–C = soya–canola; SFA = saturated fatty acids; MUFA = monounsaturated fatty acids; PUFA = polyunsaturated fatty acid; FA = fatty acid.
a,b,cDifferent letters within individual or blended oilseed treatments indicating statistical difference where *P < 0.05; **P < 0.01; ***P < 0.001.
zStandard error of the means (s.e.).
yn-6, sum of all n-6 FA; LC n-6, sum of n-6 FA ⩾20:3n-6; n-3, sum of all n-3 FA; LC n-3, sum of n-3 FA ⩾20:5n-3.
xDesaturase protein expressed as log value.
In Trial 1, cheek and diaphragm PUFA concentration was highest for the soya bean diet (P < 0.05), whereas in Trial 2 diaphragm muscle the PUFA level was highest for the S–L diet and lowest for the C–L diet (P < 0.01), with no difference in the cheek muscle. The cheek and diaphragm 18:2n-6 and n-6 concentrations were highest for the soya bean diet in Trial 1 (P < 0.001) and lowest for the Trial 2 C–L diet in the diaphragm muscle (P < 0.01). In Trial 1, for each muscle, the 20:3n-6, 22:4n-6 and 22:5n-6 levels were highest for the pure soya bean diet (P < 0.05). Similarly, the Trial 2 S–C diet had the highest 22:4n-6 level in each muscle (P < 0.05) and 22:5n-6 level in the cheek muscle (P < 0.05).
In Trial 1, the linseed diet had the highest levels of 18:3n-3, 20:5n-3, 22:5n-3, n-3 and LC n-3 in each muscle (P < 0.001), and 22:6n-3 in the diaphragm muscle (P < 0.05). In Trial 2 cheek muscle, the S–C diet had the lowest 18:3n-3 level (P < 0.01), whereas in the diaphragm muscle the S–C diet had the lowest 18:3, 20:5n-3, n-3 and LC n-3 levels (P < 0.01). In Trial 2 diaphragm muscle, the C–L diet had the highest 22:6n-3 concentration (P < 0.05). The n-6/n-3 and LC n-6/n-3 ratios for Trial 1 and Trial 2 increased in relation to the dietary n-6/n-3 ratio in each muscle (P < 0.05).
Processing effects were only present in polar lipids of Trial 2 diaphragm muscle, with extruded diets having a higher MUFA level (P < 0.01, results not shown) and roasted diets resulting in a higher 18:3n-3 level (P < 0.05, results not shown).
Desaturase expression
The Δ5d and Δ6d protein expression did not differ significantly between diets in Trial 1 or Trial 2 in either cheek (Table 4) or diaphragm muscle (Table 5). In the diaphragm muscle in Trial 2 the Δ6d protein expression was higher for roasted diets than extruded diets, 1.23 v. 1.05 log units, respectively (P < 0.05; data not shown).
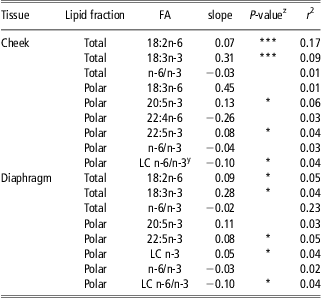
In this study, we investigated the relationships between the expression of Δ5d and Δ6d proteins in the cheek and diaphragm muscles and the fat content as well as individual fatty acids in total and polar lipid fractions. The Δ5d protein expression had a negative relationship with the total lipid content in the cheek (P < 0.001, r 2 = 0.13) and diaphragm (P < 0.05, r 2 = 0.04) muscle (data not shown). The Δ5d protein expression had a positive relationship with 18:2n-6 (P < 0.001) and 18:3n-3 (P < 0.001) in the total lipid fraction and with 20:5n-3 (P < 0.05) and 22:5n-3 (P < 0.05) in the polar lipid fraction, with a negative tendency towards 22:4n-6 (P = 0.07; Table 6). Similar to the cheek muscle, there was also a positive relationship between the diaphragm Δ5d protein expression and 18:2n-6 (P < 0.05) and 18:3n-3 (P < 0.05) of the total lipid fraction and with 22:5n-3 (P < 0.05) of the polar fraction. There was a positive tendency between the diaphragm Δ5d protein expression and polar lipid 20:5n-3 (P = 0.07). Expression of the cheek and diaphragm Δ5d protein had a negative relationship to the polar fraction LC n-6/n-3 (P < 0.05), with a tendency towards total lipid n-6/n-3 in cheek (P = 0.06).
Relationships between Δ5-desaturase protein expression and muscle fatty acids cheek (m. masseter) and diaphragm (pars costalis diaphragmatis) from steers fed a grass silage based diet supplemented with roasted or extruded C, L or S fed individually or as blends including C–L, S–L, S–L–C, or S–C in 1 : 1 ratios
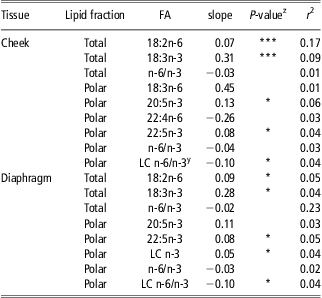
C = canola; L = linseed; S = soya bean; C–L = canola–linseed; S–L = soya–linseed; S–L–C = soya–linseed–canola; S–C = soya–canola; FA = fatty acid.
zSignificance where *P < 0.05; **P < 0.01; ***P < 0.001.
yLong-chain polyunsaturated fatty acids, LC.
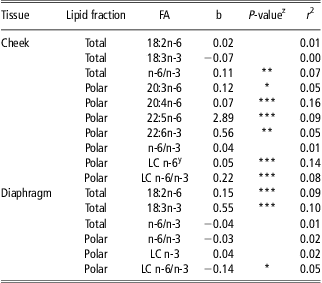
There was no significant relationship between expression of Δ6d protein and total fat content in either cheek or diaphragm muscle (data not shown). In the cheek muscle, there were positive relationships between Δ6d protein expression and polar lipid 20:3n-6 (P < 0.05), 20:4n-6 (P < 0.001), 22:5n-6 (P < 0.001) and cumulative n-6 (P < 0.001), as well as 22:6n-3 (P < 0.01; Table 7). There was also a positive relationship between the cheek Δ6d protein expression and total lipid n-6/n-3 (P < 0.01) and the polar lipid LC n-6/n-3 (P < 0.001). In the diaphragm muscle, there were positive relationships between Δ6d protein expression and 18:2n-6 (P < 0.001) and 18:3n-3 (P < 0.001) of the total lipid fraction. A negative relationship was observed between diaphragm Δ6d and the polar lipid LC n-6/n-3 (P < 0.05). There was a positive relationship between Δ5d and Δ6d protein expression in the cheek (P = 0.002, r 2 = 0.079) and diaphragm (P = 0.001, r 2 = 0.082).
Relationships between Δ6-desaturase protein expression and muscle fatty acids cheek (m. masseter) and diaphragm (pars costalis diaphragmatis) from steers fed a grass silage based diet supplemented with roasted or extruded C, L or S fed individually or as blends including C–L, S–L, S–L–C, or S–C in 1 : 1 ratios
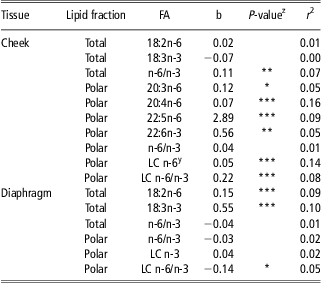
C = canola, L = linseed; S = soya bean; C–L = canola–linseed; S–L = soya–linseed; S–L–C = soya–linseed–canola; S–C = soya–canola; FA = fatty acid.
zSignificance where *P < 0.05; **P < 0.01; ***P < 0.001.
yLong-chain polyunsaturated fatty acids, LC.
Discussion
Total lipids
The fatty acid profile of the cheek and diaphragm muscle had a similar response to pure and blended oilseed supplementation reported for m. longissimus dorsi (McNiven et al., Reference McNiven, Duynisveld, Turner and Mitchell2011). Slight differences between the fatty acid profiles m. longissimus dorsi and muscles in the present study likely relate to differences in oxidative, type 1 and glycolytic, type 2 muscle fibre composition of the muscles (Raes et al., Reference Raes, De Smet and Demeyer2001). Similarly, higher lipid content of the diaphragm tissue compared with the cheek tissue likely relates to the high proportion of perimysial connective tissue and subsequent increased adipocyte deposition (Smith et al., Reference Smith, Kawachi, Choi, Choi, Wu and Sawyer2009).
In Trial 1, the 18:2n-6 and 18:3n-3 concentrations of both muscles were increased when supplementing with soya bean or linseed, respectively. Previous feedlot trials have shown that the muscle 18:2n-6 and 18:3n-3 concentrations can be increased by supplementing with processed soya beans (McNiven et al., Reference McNiven, Duynisveld, Charmley and Mitchell2004) or linseed (Maddock et al., Reference Maddock, Bauer, Koch, Anderson, Maddock, Barcelo-Coblijn, Murphy and Lardy2006), respectively. In Trial 2 the diaphragm muscle, a lower muscle lipid content associated with the S–L diet had a reciprocal effect on the PUFA proportion, with notable increases of 18:2n-6 and 18:3n-3. Excluding the S–L diet, there were slight differences in the concentration of PUFA among the other dietary groups, with diets low in 18:2n-6 having a greater effect than diets low in 18:3n-3. The relative concentration of 18:2n-6 and 18:3n-3 in the muscle means that slight differences in dietary 18:3n-3 content has a more substantial effect than differences in 18:2n-6. Differences in diaphragm n-6 and n-3 levels were due to the predominance of 18:2n-6 and 18:3n-3 among total lipid PUFA. In both trials, the n-6/n-3 ratio of the muscles responded to differences in the dietary n-6/n-3 ratio. For both trials, the muscle n-6/n-3 ratio was near or below the 4 : 1 ratio recommended as optimal for human health (Simopoulos, Reference Simopoulos2000).
Dietary 18:2n-6 and 18:3n-3 can both form 18:1t-11 as an intermediate during biohydrogenation (Bauman et al., Reference Bauman, Baumgard, Corl and Griinari2000), and hence the pure linseed and soya bean diets in Trial 1 increased the 18:1t-11 level in both muscles compared with the canola diet. The higher concentration of 18:1t-11 associated with the Trial 2 S–C diet over the C–L diet and the positive relationship between muscle 18:1t-11 and diet 18:2n-6, but not 18:3n-3 supports Scheeder et al. (Reference Scheeder, Casutt, Roulin, Escher, Dufey and Kreuzer2001) findings that 18:2n-6 is the primary contributing factor. Differences between treatments may have been compounded by the use of soya bean oil to balance the lipid content of the diets containing soya beans. Soya bean oil is rapidly hydrolysable and is known to increase the 18:1t-11 and CLA c-9,t-11 concentrations in beef tissues (Aharoni et al., Reference Aharoni, Orlov, Brosh, Granit and Kanner2005).
Endogenous conversion of 18:1t-11 via stearoyl-CoA desaturase (SCD) accounts for the majority of CLA c-9,t-11 in ruminant products (Griinari et al., Reference Griinari, Corl, Lacy, Chouinard, Nurmela and Bauman2000). Gillis et al. (Reference Gillis, Duckett and Sackmann2004) reported that over 86% of the CLA c-9,t-11 in beef tissue originated from the desaturation of 18:1t-11, based on duodenal flows of 18:1t-11 and CLA c-9,t-11 found within adipose tissue. Presently, there was a similar pattern between the concentration of 18:1t-11 and CLA c-9,t-11 in the muscles, although this was not always statistically evident. The stronger relationship between muscle CLA c-9,t-11 and dietary 18:2n-6 is partially explained by the aforementioned relationship between diet and 18:1t-11. Moreover, CLA c-9,t-11 can also be produced as a biohydrogenation intermediate of 18:2n-6, but not 18:3n-3 (Bauman et al., Reference Bauman, Baumgard, Corl and Griinari2000), which could also have contributed to the higher CLA c-9,t-11 concentrations associated with the Trial 2 soya bean blend diets in the diaphragm muscle. The CLA index suggests a reduction in SCD activity associated with the Trial 1 linseed and soya bean diets, which also had a stronger negative relationship with 18:3n-3 than 18:2n-6 concentrations in the muscles. Dietary PUFA from both the n-6 and n-3 series have been reported to reduce SCD mRNA expression (Ntambi, Reference Ntambi1999), with 18:3n-3 having a stronger inhibitory effect than 18:2n-6 (Daniel et al., Reference Daniel, Wynn, Salter and Buttery2004). A similar trend was also present for the CLA index among the Trial 2 blended diets in relation to the concentration of linseed and soya bean present. Lack of diet effect in Trial 2 may be due to the limited variation in dietary PUFA content.
The high 18:1c-9 content of canola partially accounts for the higher 18:1c-9 and MUFA in cheek in the present study. Previously, the in vitro biohydrogenation rate of 18:1c-9 was reportedly similar between raw and extruded canola, being half that of PUFA (Enjalbert et al., Reference Enjalbert, Eynard, Nicot, Troegeler-Meynadier, Bayourthe and Moncoulon2003). When feeding ruminants processed canola, the lower biohydrogenation rate and higher intestinal absorption of 18:1c-9 has resulted in an appreciable transfer to milk (Tymchuk et al., Reference Tymchuk, Khorasani and Kennelly1998) and adipose tissue (Huard et al., Reference Huard, Seoane, Petit, Fahmy and Rioux1998). In agreement with the CLA index, higher concentrations of 14:1c-9 and 16:1c-9 associated with the Trial 1 canola diet, as shown in Tables 2 and 3, suggest a reduction in SCD activity caused by the higher dietary PUFA levels of the linseed and soya bean diets.
Higher concentrations of 18:1t-11 and CLA c-9,t-11 were associated with the extruded diets in both muscles. Extrusion physically disrupts the seed hull, exposing the oil to microbial fermentation. Reddy et al. (Reference Reddy, Morrill and Nagaraja1994) reported that during in vitro incubation, the release of fatty acids from extruded soya beans was slower than that of soya bean oil; however, it was more rapid than that of roasted soya beans. Free oils are more susceptible to lipolysis and subsequent hydrogenation of UFA, leading to increased formation of biohydrogenation intermediates, such as 18:1t-11. The UFA of roasted oilseeds are partially protected by the intact seed coat. McNiven et al. (Reference McNiven, Duynisveld, Charmley and Mitchell2004) reported that roasting increased concentration of PUFA in loin muscle compared with raw or extruded oilseed supplements. In the present trial, the roasting effect was minor, only increasing the 18:2n-6 and 18:3n-3 in Trial 2 diaphragm.
Polar lipids
As polar lipids are associated with membrane tissues, the absolute content remains relatively unaffected to changes in muscle lipid content; however, the concentrations of the different polar fatty acids are influenced by diet (Warren et al., Reference Warren, Scollan, Enser, Hughes, Richardson and Wood2008). In the present trial, the polar lipid SFA level was unaffected by the diet, whereas the 18:1c-9 and MUFA were affected by the source and concentration of dietary PUFA. In Trial 1 cheek and diaphragm, the 18:1c-9 and MUFA concentrations were reduced more by the soya bean diet than the linseed diet. Similarly, in Trial 2 diaphragm muscle, dietary PUFA supplanted the polar lipid MUFA, with dietary 18:2n-6 levels having a stronger effect than 18:3n-3. The present findings are in agreement with current research, which indicates that 18:2n-6 is preferentially incorporated over 18:3n-3 into ruminant muscle phospholipids (Wood et al., Reference Wood, Enser, Fisher, Nute, Sheard, Richardson, Hughes and Whittington2008).
Fibre type can have a small influence on the muscle fatty acid profile, with type 1 fibres having a higher concentration of PUFA (Wood et al., Reference Wood, Richardson, Nute, Fisher, Campo, Kasapidou, Sheard and Enser2003). Goat cheek muscle entirely comprises type 1 fibres, whereas 60% of the fibres are type 1 in the diaphragm muscle (Ibebunjo et al., Reference Ibebunjo, Srikant and Donati1996). Assumedly, these concentrations are representative of other ruminant species because of the similar continual phasic activity associated with rumination. Alasnier et al. (Reference Alasnier, Rémignon and Gandemer1996) proposed that the higher mitochondrial density of type 1 fibres could account for the slightly higher PUFA concentration observed in the cheek compared with diaphragm muscle.
In ruminants, PUFA are almost entirely associated with the polar lipid fraction because of a higher incorporation affinity, with the aforementioned preference for 18:2n-6 over 18:3n-3 (Wood et al., Reference Wood, Enser, Fisher, Nute, Sheard, Richardson, Hughes and Whittington2008). The Trial 1 findings clearly indicated that the soya bean diet resulted in a higher PUFA concentration, with 18:2n-6 accounting 64% and 52% of the polar lipid PUFA in cheek and diaphragm muscle, respectively. Moreover, in both muscles the 18:2n-6 concentration was roughly 25% greater for the Trial 1 soya bean diet than the other diets. When blended, diet effects were not as apparent; however, Trial 2 soya bean blends did increase 18:2n-6 in the diaphragm muscle.
Warren et al. (Reference Warren, Scollan, Enser, Hughes, Richardson and Wood2008) showed that the concentrate v. forage diets had a substantial effect on polar lipid 18:2n-6 and 18:3n-3, ultimately influencing the respective n-6 and n-3 LC-PUFA. The present basal diets were more similar to each other, and hence the 20:4n-6 level was similar between the diets in both trials for both muscles. However, 22:4n-6 and 22:5n-6 levels were different between the diets, suggesting that the precursor concentration was not the only factor determining the LC-PUFA profile.
In both muscles, the pure linseed diet led to a higher polar lipid 18:3n-3 concentration and subsequently 20:5n-3 and 22:5n-3. Similarly, the Trial 2 diets containing linseed resulted in higher concentrations of 18:3n-3 in both muscles and 20:5n-3 in the diaphragm. These findings are consistent with other cattle feeding trials using diets differing in n-6/n-3 content (Dannenberger et al., Reference Dannenberger, Nuernberg, Nuernberg, Scollan, Steinhart and Ender2005; Warren et al., Reference Warren, Scollan, Enser, Hughes, Richardson and Wood2008). In agreement with Maddock et al. (Reference Maddock, Bauer, Koch, Anderson, Maddock, Barcelo-Coblijn, Murphy and Lardy2006), processed linseed diets increased the 22:6n-3 concentration in the diaphragm muscle in Trial 1 and Trial 2, with a similar tendency in the cheek muscle from Trial 1. In contrast, Scollan et al. (Reference Scollan, Choi, Kurt, Fisher, Enser and Wood2001) reported that whole linseed did not increase the 22:6n-3 level m. longissimus thoracis; however, fish oil was effective. Differences in 18:3n-3 availability partially account for the conflicting results, emphasizing the need for processing when including linseed in ruminant diets.
Δ5d and Δ6d protein expression and their relationship with fatty acid composition
In the endoplasmic reticulum, 18:2n-6 and 18:3n-3 undergo a series of elongase and desaturase steps involving Δ5d and Δ6d to form LC-PUFA, as reviewed by Sprecher (Reference Sprecher2000). The desaturase enzymes have a higher affinity towards n-3 PUFA, with the first Δ6d step being rate limiting (Williams and Burdge, Reference Williams and Burdge2006). In this study, we did not find a significant effect of diet on Δ5d and Δ6d protein expression in either the cheek or diaphragm muscle. This is not consistent with Herdmann et al. (Reference Herdmann, Nuernberg, Martin, Nuernberg and Doran2010) who reported decreased Δ6d protein expression in bovine m. longissimus when feeding an n-3-rich diet. However, in that trial there was a sixfold difference in the dietary n-6/n-3 ratios compared with a threefold difference in the present trial, owing largely to the proportion of grass silage in the basal diet. Differences in muscles sampled may also have been a factor. Moreover, the present study does not exclude the possibility of a dietary fatty acid effect on Δ5d and Δ6d enzyme activities, rather than expression. Hiller et al. (Reference Hiller, Herdmann and Nuernberg2011) found that diet had an influence on bovine m. longissiumus dorsi Δ6d protein expression, but no effect on gene expression. Although the present diets were practical from a commercial production perspective, the narrower n-6/n-3 range likely hampered the full extent to which diet could be used to influence the desaturase protein expression. However, this study did find a stronger positive relationship between the Δ5d and Δ6d protein expression and their respective desaturase products, but not with their precursors, in the muscle investigated. This suggests that the Δ5d and Δ6d influenced the LC-PUFA profile beyond what can be attributed to precursor concentration alone.
The present findings indicated a negative relationship between total fat content of either the cheek or diaphragm and Δ5d expression, but no effect on Δ6d expression, whereas Ward et al. (Reference Ward, Woodward, Otter and Doran2010) reported that in M. semimembranosus Δ5d and Δ6d expression was positively related to intramuscular fatty acid content and n-6 PUFA content. A number of differences between the two studies make comparisons regarding the relationship between protein expression and intramuscular fat difficult, such as differences in muscles and fat content, as well as single diet v. multiple diets as in the present study. Furthermore, higher 18:2n-6 content of the fatter animals and inclusion of 18:2n-6 in the n-6 PUFA regression in the Ward et al. (Reference Ward, Woodward, Otter and Doran2010) study may have confounded the interpretation that the rate of n-6 LC-PUFA synthesis may be linked to IMF formation.
The narrow dietary n-6/n-3 range, compounded by possible tissue specific effects, impedes clear conclusions of how diet influences the desaturase protein expression in the present trial, as well as comparisons to published findings. This study established positive relationships in the cheek and diaphragm between Δ5d protein expression and total lipid content, as well as 18:2n-6 and 18:3n-3 content, with a stronger positive slope for 18:3n-3. This suggests that protein expression is increased in relation to muscle PUFA concentration, with 18:3n-3 having a slightly stronger effect. A similar pattern was observed for Δ6d expression in the diaphragm but not in the cheek. This is consistent with studies by other authors who observed tissue specificity in relationship between lipogenic enzyme expression and dietary PUFA content (Missotten et al., Reference Missotten, De Smet, Raes and Doran2009; Herdmann et al., Reference Herdmann, Nuernberg, Martin, Nuernberg and Doran2010).
As dietary PUFA are preferentially incorporated into ruminant muscle phospholipids (Wood et al., Reference Wood, Enser, Fisher, Nute, Sheard, Richardson, Hughes and Whittington2008), interpretations regarding the regulation of Δ5d and Δ6d protein expression can be made more clearly by looking at the relationships to polar lipid LC-PUFA, which has not been reported previously. Stronger relationships between Δ5d and Δ6d expression and their respective LC-PUFA products indicate that regulation of expression could affect the LC-PUFA profile. In each muscle, the Δ5d expression was inversely related to the LC n-6/n-3 ratio. As the LC n-6/n-3 ratio relates to the dietary n-6/n-3 ratio, findings suggest that Δ5d expression is increased in each muscle by higher dietary n-3. This may present a possible avenue to enhance the n-3 LC-PUFA content of muscle through increased Δ5d expression; however, given the low r 2 values, further studies are necessary.
Interpreting relationships between Δ6d expression and individual PUFA are more difficult as the Δ6d enzyme is active at two steps in the pathway (Sprecher, Reference Sprecher2000). However, introduction of the first double bond is a rate-limiting step and could be considered the most important (Williams and Burdge, Reference Williams and Burdge2006). In the present study, the Δ6d expression showed stronger positive relationships to individual n-6 LC-PUFA in the cheek muscle. The relationship between the Δ6d expression and the LC n-6/n-3 ratio was contradictory, being positive in the cheek muscle, but negative in the diaphragm muscle. Again, tissue-specific enzyme expression may account for the contradiction between the cheek and diaphragm. As such, the modest relationships between Δ6d expression and polar lipids offer an indication of dietary influence; however, protein expression results do not establish a clear dietary effect.
Conclusion
This study makes significant contributions towards understanding tissue-specific mechanisms underlying dietary regulation of fatty acid composition in the muscle of cattle. The key findings of this study are: (i) dietary n-6/n-3 ratio influenced the fatty acid profile of the cheek and diaphragm muscle. In both muscles, n-6/n-3 ratio was lowest for the Trial 1 linseed diet and the Trial 2 C–L diet. (ii) Dietary PUFA reduced the formation of MUFA likely by downregulating SCD activity in both muscles. (iii) Oilseed processing had little influence; however, extrusion increased formation of 18:1t-11 and CLA c-9,t-11 in both muscles, whereas roasting increased 18:2n-6 and 18:3n-3 concentrations in the diaphragm muscle. (iv) Δ5d and Δ6d immunoreactive proteins were identified in the cheek and diaphragm muscle. Protein expression did vary between tissues; however, in general, there was a stronger positive relationship between expression of Δ5d and Δ6d protein and n-3 LC-PUFA products of reactions catalysed by these proteins. The above suggests that expression of lipogenic enzymes involved in LC-PUFA biosynthesis has an impact on tissue-specific regulation of fatty acid composition when feeding steers processed whole-fat canola, linseed and soya bean.
Acknowledgements
The authors gratefully acknowledge the following bodies for their contributions to this project. PEI ADAPT Council, Canadian Agricultural Adaptation Program, Agriculture and Agri-food Canada, PEI Department of Agriculture, Agriculture Innovation Program and Island Grain & Protein Council Inc. The authors would also like to acknowledge K. Richards and J. Knight for their technical support and use of the equipment and facilities at the Atlantic Centre for Comparative Biomedical Research, Atlantic Veterinary College, University of Prince Edward Island, Canada.