An important topic in Political Science for decades has been the relationship of protests to elections, especially regarding issues of racial justice (Gillion Reference Gillion2020; Wasow Reference Wasow2020). This was a big topic several decades ago, as scholars sought to understand the political consequences of the Black Rebellion of the late 1960s (in particular see Piven and Cloward Reference Piven and Cloward1971; Reference Piven and Cloward1977; Schram and Turbett Reference Schram and Turbett1983; Fording Reference Fording1997; Reference Fording2001). While the protest–election connection over time faded in prominence as a topic of investigation, periodically it would return as with the Occupy Wall Street protests that started in 2011 (Schram Reference Schram2014). The extensive protests led by the #BlackLivesMatter movement over the murder of George Floyd by Minneapolis police on May 25, 2020, have however brought the topic back with the racial justice focus fully intact. In fact, the level of outrage over the killing of George Floyd has made the issue of racial injustice once again central to U.S. political discourse and is a sign that it is likely to continue to occupy that spot for some time to come.
The general topic of the relationship of social movements, including protest movements, to elections was understudied for too long (McAdam and Tarrow Reference McAdam and Tarrow2010). There has been growing appreciation that the protest–election connection in particular significantly involves issues regarding changes in campaign discourse and effects on the level of mass electoral participation. Prominent questions have often been about whether protests increase or depress election turnout for various constituencies, given that protests can heighten concern or turn off voters depending on whether they turn violent (Wasow Reference Wasow2020).
Yet, today's protests add an additional dimension when considering their possible connection to upcoming elections. While it is true that similar to today the spark for many of the protests of the late 1960s was outrage over police brutality directed primarily at African-American males, the recent wave of protests looks different in one very important respect. As Sugrue (Reference Sugrue2020) has noted, in contrast to the exclusively Black composition of the participants in the late 1960s protests that were responding to police brutality, the largely Black protesters of #BlackLivesMatter that rose up after the 2014 police killings of Michael Brown in Ferguson, MO and Eric Garner in Staten Island, have now been joined by a racially diverse set of allies who for a variety of reasons support that resistance (see Lopez Bunyasi and Smith Reference Lopez Bunyasi and Smith2019; Tillery Reference Tillery2019).
It is true that Whites were actively involved in the 1960s Civil Rights Movement, including protest marches and demonstrations. Yet, the protests and riots that were sparked in reaction to police violence back then overwhelmingly involved Black participants. The racial diversity of today's protesters in the #BlackLivesMatter protests is noteworthy for many reasons, but not the least of which is that it is in all likelihood connected to growing White racial liberalism that is surging in our politics now with possible repercussions for the upcoming election and beyond. Given the size and scope, as well as the multi-racial composition, of the George Floyd protests, we need to ask whether they are indicative of a broader multi-racial coalition surging now not just to protest Floyd's killing, or even racist policing, but the White racism that infects our society more generally.
In the 1960s the protest–election equation was primarily about the effects of largely young, male Black protesters on the political behavior of a disproportionately older, White voting public of men and women. That equation is now changing and in fact the protesters may be more representative of the voting public and in many cases the same people. The current protests are undoubtedly first and foremost about people of color demanding racial justice, but now the Black protesters are joined by visible White allies who are explicitly stepping forward to make a public statement that they too oppose the system of White dominance. The Black–White alliance so starkly represented in public demonstrations and marches is a politically potent symbol, signifying to the country that the uprising is about an issue that concerns the entire society and implicates us all in taking action to redress it. Although the protests may have started in response to yet another police killing of a Black man, they quickly came to be about the systemic racism that pervades the entire institutional infrastructure of the social order. The scope of the protests widened as the racial composition of the protesters diversified. The protests not only came to be about more than racist policing they came to be about everyone taking responsibility for dismantling the system of institutional racism that pervades the entire society (Stewart Reference Stewart2020).
The #BlackLivesMatter movement undoubtedly was always about more than racist policing and emphasized that was but a symptom of the larger society-wide problem of systemic racism (Hosam Reference Hosam2019). Yet, the demands of Black people for racial justice get magnified when White people now start explicitly insisting that they themselves refuse to be associated with the systematic racism from which they benefit (offering parallels to pre-Civil War abolitionism, see Kantrowitz Reference Kantrowitz2012). With Whites and Blacks uniting to undo the system of White dominance, the potential for change is greatly enhanced. It is Black activists who forced the nation to consider the issue of racial injustice as reflected in the examples of racist police killings, but it is White allies who supply the missing ingredient that suggests change is ever more possible when White people say they will actively work to disown the unearned privileges they gain from the system of systemic racism. In other words, the multi-racial character of the recent protests suggests there exists a broad coalition capable of significantly moving the Nation down the road toward the racial justice. Also, given that many of the participants are young, the potential for a long-term sustained campaign is increased. The multi-racial coalition could stay involved making a real difference in combating racial injustice for years to come. We need then to ask to what extent is the multi-racial composition of protests in 2020 the sign of a tectonic shift in not just racial politics but U.S. politics more generally.
In the analysis that follows, we consider the changing nature of today's protest–election connection by looking back to the Blue Wave of the 2018 midterm elections that led to Republicans losing control of the House of Representatives. We ask whether White voters' participation in the Blue Wave of the 2018 elections is related to the protests in 2020. Could it be that White participation in both is symptomatic of a larger resurgence of racial liberalism that is likely to continue to play a significant role in our politics going forward starting with the 2020 election?
We frame our analysis of today's multi-racial coalition by drawing on theoretical arguments concerning the cyclical nature of political movements (in particular, see McAdam et al. Reference McAdam, Tarrow and Tilly2001; Schram Reference Schram2015). A key analytical concept for our analysis is the “political opportunity structure” which enables, conditions, and limits movements and corresponding counter movements' mobilization and participation in mainstream politics (Meyer and Staggenborg Reference Meyer and Staggenborg1996). We note that Donald Trump rose to power riding a wave of White resentment toward the presidency of Barack Obama (Tesler Reference Tesler2016; Jardina and Traugott Reference Jardina and Traugott2019). This promoted a merging of movement and electoral politics when first the Tea Party and then the Trump candidacy opened the door to Whites with high levels of racial resentment to join with others in forming winning electoral coalitions (Fording and Schram Reference Fording and Schram2020). Meyer and Staggenborg (Reference Meyer and Staggenborg1996) emphasize that social movements with potential political significance inevitably give rise to counter movements and if the political opportunity structure affords them access they can become critical players in mainstream, electoral politics. The rise of what came to be called “the Resistance” to counter the White racism that helped put Trump in the White House quickly began to be formed right after Trump assumed office in January 2017 starting with the Women's March building to the Blue Wave in the 2018 midterm elections and continuing through the George Floyd protests with the possibility of influencing the 2020 elections. The network of organizations and groups, including “Indivisible” which worked at a congressional district level, changed the political opportunity structure further, merging protest and electoral politics even more, and opening the door to a multi-racial coalition of protesters who would vote as well to conceivably counter the Trump movement in the most effective way possible at the ballot box.Footnote 1
Our analysis however goes beyond focusing on White resentment toward Blacks. Trump exploited White resentment to the Obama presidency but his rise to power involved fanning the flames of not just White racial resentment toward African Americans but his agitating a more generalized White “outgroup hostility” directed against such groups as Latinx immigrants and Muslims as well as African Americans (see Buyuker et al. Reference Buyuker, Jadidi D'Urso, Filindra and Kaplanforthcoming). Our prior research shows that White outgroup hostility was the prime predictor of support for Trump in 2016. In the research we report here, we find that the Resistance that ultimately produced the Blue Wave was most significantly the result of mobilizing White racial liberals with low levels of outgroup hostility to join with others to defeat Republicans at the polls in 2018. We conclude our analysis by suggesting that today's multi-racial countermovement of racial liberalism includes both protest and electoral mobilization with the distinct possibility of overlap in participants in both poised to have a significant effect starting with the 2020 elections.
Our analysis is noteworthy in several respects. Systematic analysis of the Blue Wave has been sparse. Our research is the first to show that the Blue Wave mobilization was driven by racial liberalism producing a multi-racial coalition that opposed the racism of President Donald Trump and the Republicans in Congress who supported him. Our findings suggest that the racial liberalism of White voters was key to mobilizing the Blue Wave. That made them part of a multi-racial coalition that turned out at the polls to defeat Republicans. The parallels to the multi-racial coalition reflected in the George Floyd protests are striking and suggest that the Blue Wave may not be done washing over our politics as we discuss in our conclusions.
The multi-racial character of the extensive George Floyd protests therefore is arguably part of something larger and more long-lasting, connected to the Blue Wave election of 2018 and poised to influence the 2020 elections. The implications for U.S. politics are what is most significant here but the implications for Political Science are pertinent as well. We may need to revise our understanding of the relationship of protests to elections in an age of multi-racial coalitions. It may be that the protest–election connection regarding racial politics in particular is no longer primarily about nonwhite protesters influencing White voters positively or negatively. Instead we may need to refocus the theoretical lens for understanding the protest–election connection to account for when multi-racial protest coalitions are part of larger movements that include the very same blocs of voters who determine election outcomes.
TRUMPISM AS A REACTIONARY MOVEMENT
Our recently published book, Hard White: The Mainstreaming of Racism in American Politics (Fording and Schram Reference Fording and Schram2020) presents evidence on how Donald Trump ascended to power in the White House in no small part by stoking White racial resentment building off a burgeoning reactionary movement. Consistent with the research of others (e.g., Tesler Reference Tesler2016), we find that an important source of that resentment was the presidency of Barack Obama, the first nonwhite president in the history of the country. Michael Tesler calls this the “Obama Effect.” Trump made the most of the Obama Effect. In pursuit of a political base to support a run for the presidency, Trump worked his way into a position of leadership in championing the outrageous conspiracy theory that Obama was an illegitimate president because he was not an American citizen since he was not born in Hawaii like he claimed but really was born in Kenya as a Muslim (Jardina and Traugott Reference Jardina and Traugott2019). From 2011 until his formal announcement as a candidate for the presidency, Trump pushed the birther lie. By the time he declared his candidacy he had built a base of support among Whites with high levels of hostility toward Obama. In addition, in a development that is unprecedented for a major party candidate in the post-civil rights era, Trump received the public endorsement of many leaders within the white nationalist movement, including the most recognizable figures in this movement—David Duke from the KKK and Richard Spencer from the Alt-Right.
As a candidate, Trump stoked White resentment more broadly reflective of the changing nature of racism. Today, with issues of globalization, immigration, and demographic diversification achieving greater public salience, racism is more likely to manifest itself in the form of a generalized ethnocentrism that expresses “outgroup hostility” toward a diverse set of groups (Kinder and Kam Reference Kinder and Kam2010). The United States has historically been a country where white people are identified as the “ingroup” and various nonwhite groups are constructed as threatening “outgroups” (Jardina Reference Jardina2019). In today's politics Donald Trump's rise as a political force was based in good part on his stoking this more generalized white outgroup hostility, especially toward Latinx immigrants and Muslims, as well as African Americans (see Lajevardi and Oskooii Reference Lajevardi and Oskooii2018).
Our research finds that White outgroup hostility was a predictor of support for Trump in 2016, more important than either White ingroup identity or economic anxiety and rivaling partisan identification in terms of influence on people's vote choice. The evidence underscores that Trump had built a reactionary movement founded on White outgroup hostility and rode it to power in the White House.
THE BLUE WAVE COUNTERS TRUMPISM
The Obama presidency represented to many people the culmination of years of effort to achieve racial inclusion. Yet, some whites resisted those efforts and opposition to substantive racial equality increased in the years since the Civil Rights movement had succeeded in gaining federal action to combat racial discrimination (see Fording and Schram Reference Fording and Schram2020). Trump's ascendancy to the White House was made possible when that counter movement intensified in reaction to Obama's presidency. And now that Trump's racism, first as a candidate and then as President, has alienated many people, a counter movement of racial liberalism has sprung up in quest of defeating Trump and the Republicans in Congress who almost universally stuck with him, if often reluctantly (see Smith and King Reference Smith and Kingforthcoming). While the Obama Effect sparked the movement that led to Trump's victory, there is a “Trump Effect” that has sparked the rise of the Resistance (as they aptly have called themselves) dedicated to pushing back to repudiate Trump and his racist allies.
In other words, there is good reason to think about racial politics today as a cyclical phenomenon where one movement rises up to counter another (Smith and King Reference Smith and Kingforthcoming). Drawing on Meyer and Staggenborg (Reference Meyer and Staggenborg1996) as well as McAdam et al. (Reference McAdam, Tarrow and Tilly2001) and Schram (Reference Schram2015), we frame our analysis in terms of what we call “cycles of contention.” Given Trump's insistence of stoking White outgroup hostility as the main way to keep his base loyal to him, our politics overall have been increasingly structured in terms of this racial dynamic of contention. Race is at the center of our politics and its cyclical dynamic is what today shapes political contestation overall. It makes sense from this perspective that a multi-racial coalition of racial liberals would become central to the Resistance that has formed to oppose Trump's presidency and related politics.
There are two components to this perspective: attitudinal and behavioral. First, there is the question of whether racially liberal attitudes have actually strengthened in reaction to Trump's success. Second, there is the question of whether racial liberalism, whether or not it has increased in reaction to Trump, has been a critical factor affecting people's political behavior, especially in participating in elections but also in other ways such as protesting racialized policing.
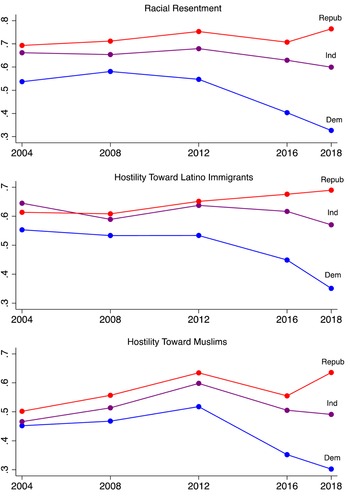
Turning to the first question, there is evidence of a marked increase in racial liberalism among Whites which continues an ongoing trend that pre-dates Trump's presidency and has accelerated since his ascension to the White House. This trend has now been documented in several published studies, including Sides et al. (Reference Sides, Tesler and Vavreck2018), and Hopkins and Washington (Reference Hopkins and Washington2020) and we now can add to this confirmation with our own analyses. Based on data from the American National Election Study (ANES) as well as panel data from the Views of the Electorate Research (VOTER) Survey, we can show that, among Whites, in recent years there has been a significant decrease in racial hostility. Consistent with our theoretical perspective, one aspect of this trend that is most striking is that the magnitude of this decrease in outgroup hostility has been mostly concentrated on the left, among Democratic Party identifiers who are the ones most likely to recoil from Trump's racism. In addition, the decrease in White hostility is largely confined to how Whites feel about the three racial outgroups most frequently targeted by Donald Trump, first as a candidate and then as President: African Americans, Latinx immigrants and Muslims.Footnote 2 In Figure 1 we provide evidence of this decline by presenting trends in White hostility toward these three racial-ethnic outgroups based on data from the ANES data from 2004 through 2018.
Mean hostility score by outgroup target and party identification, 2004–2018. Note: The figure plots the mean score for Whites for racial resentment, an anti-immigrant scale, and the feeling thermometer for Muslims (reverse-scaled), all rescaled to range from 0 to 1. The samples are based on White respondents only, taken from the American National Election Time Series Study (2004–2016) and the 2018 ANES Pilot Study. See the Supplementary Appendix for additional measurement details.

To measure hostility toward Blacks we rely on the racial resentment scale (Kinder and Sanders Reference Kinder and Sanders1996), the most commonly used measure of hostility toward African-Americans in the social science literature (Cramer Reference Cramer2020).Footnote 3 Following Abrajano and Hajnal (Reference Abrajano and Hajnal2015), we measure hostility toward Latinx immigrants through a three-item scale that includes questions measuring opposition to “immigrants.” Although the “immigrants” referenced in these questions do not reflect a specific racial or ethnic identity, the majority of Whites associate the terms “illegal immigrants” or “immigrants” with Latinx immigrants, thus justifying the inclusion of this scale as an indicator of racial outgroup affect toward Latinx immigrants (Abrajano and Hajnal Reference Abrajano and Hajnal2015).Footnote 4 Finally, to measure hostility toward Muslims, we utilize the standard feeling thermometer item, which we have reverse-scaled to create a measure of “coldness” toward Muslims. Although “Muslim” is a religious categorization, scholars have increasingly recognized the “racialization” of Muslims in the United States, especially those of Arab and South Asian descent (Cainkar Reference Cainkar2009). As a result, Muslims now occupy a subordinate position as an “ethnoracial” minority group in America's racial order (Kalkan et al. Reference Kalkan, Layman and Uslaner2009; Treitler Reference Treitler2015; Lajevardi and Oskooii Reference Lajevardi and Oskooii2018; Tesler Reference Tesler2018).Footnote 5
Our three measures of racial group hostility have all been rescaled to range from 0–1. Values above .5 indicate some degree of hostility, a value of .5 indicates indifference toward that group, and values below .5 represent some degree of sympathy or warmness toward each group. We refer to the Whites who score below the .5 mark on one or more of these scales as “racial liberals,” and we use “racial conservatives” to refer to Whites with scores above .5. Turning to Figure 1, the trends in hostility toward the three racial groups are remarkably similar. Among Republicans there has been a long-term increase in hostility toward each group but the magnitude of the increase is rather small. It is also noteworthy that there has been not really been that much of an increase in hostility toward any of the three groups during the Trump era. Racial hostility has similarly remained relatively stable among Independents and again there is no obvious indication of a Trump effect. However, this is not the case for Democrats. Indeed, racial liberalism has significantly increased among Democrats for each of the three racial groups and the timing of the increase in each case is clearly associated with the rise of Donald Trump.
OUTGROUP HOSTILITY, THE OBAMA EFFECT, AND NOW THE TRUMP EFFECT
It is striking that Trump's inflammatory rhetoric has not led to a significant increase in racial hostility, even among Republicans. Yet, this does not mean that Trump's emphasis on outgroup hostility did not help him win the 2016 election. In Hard White, we argue that outgroup hostility was a crucial factor especially in swing states where Trump's stoking of White resentment toward African Americans, Latinx immigrants, and Muslims helped mobilize disaffected White people who previously had not voted in 2012. Our research finds that the outgroup hostility of disaffected Whites was strongly associated with their being mobilized in the swing states to participate in the 2016 election and vote for Trump. Our research confirms what other studies (Parker and Barreto Reference Parker and Barreto2014; Sides et al. Reference Sides, Tesler and Vavreck2018) have found—that much of that resentment was fueled by the election of Barack Obama as President, the first African American to ever hold that office. We show that Obama's election was a catalyst for the mobilization of disaffected White racial extremists into conventional politics, a phenomenon that we argue has played an important role in what we refer to as the “mainstreaming of racism” in American politics. The mainstreaming of White extremists began in earnest with the mobilization of angry, resentful Whites into the Tea Party Movement and it accelerated with the rise of Donald Trump's candidacy beginning in 2015. Trump effectively mobilized people with high levels of outgroup hostility more so than increased their ranks. While the rise of the Tea Party was the first major step in the changing political opportunity structure that opened the door for White racial extremists to mobilize and participate in mainstream electoral politics effectively (Fording and Schram Reference Fording and Schram2020), Trump ended up being the biggest beneficiary of this development. Our findings do not show that Trump increased the number of people with high levels of outgroup hostility in 2016 as much as he effectively mobilized them to vote and help flip swing states from blue to red (Fording and Schram Reference Fording and Schram2020).
Yet, U.S. politics, as we have argued, is cyclical (Schram Reference Schram2015). Political movements tend to create their own opposition (Meyer and Staggenborg Reference Meyer and Staggenborg1996), and just as the Trump campaign profited from a reaction to Obama's presidency, the counter movement that produced the Blue Wave arose in reaction to Trump's fanning the flames of outgroup hostility. Our research shows that the Blue Wave of 2018, like the 2016 Trump campaign, was successful to a significant degree by mobilizing non-voters based on racial attitudes. However, in reaction to the racism manifested in Trump's Presidency, the Blue Wave responded by mobilizing racially liberal non-voters to augment the Democrat vote in 2018. This finding has important possible implications for U.S. politics in 2020. There is good reason to believe that this backlash against racism has only accelerated, contributing to the active participation of Whites in the 2020 protests and more generally the racial diversity of the #BlackLivesMatter movement. Given the changes in the political opportunity structure that have allowed for a merging of movement and electoral politics on both the Right and the Left, this further suggests that the surge in racial liberalism that we are witnessing in the streets may very well be redirected back to the voting booth, thereby perhaps spearheading a Democratic victory to take back the Presidency and the Senate in 2020 and posing lasting effects going forward.
RACIAL LIBERALISM AND POLITICAL MOBILIZATION: AN EMPIRICAL TEST
We test our proposition concerning the impact of recent trends in White outgroup affect on the 2018 election by examining the two mechanisms through which racial liberalism may have contributed to the 2018 Blue Wave. First, we examine the plausibility of what we might term a “persuasion effect.” It is possible that the surge in racial liberalism observed in Figure 1 was accompanied by increased opposition to Trump once he assumed office and followed through on his racially-inspired agenda. In turn, this may have led to greater opposition to Republican congressional candidates among racial liberals in 2018 compared to 2016. We can test this possibility by examining the relationship between outgroup hostility and support for Trump over the last two elections—2016 and 2018. To measure support for Trump we utilize the feeling thermometer items for Trump from the 2016 American National Election Studies (ANES) Time Series Study and the 2018 ANES Pilot Study (administered soon after the 2018 midterm election). To measure racial attitudes, we created an outgroup hostility scale based on the results of a factor analysis of the three outgroup hostility items represented in Figure 1.Footnote 6 The factor analysis results found that the three items loaded on a single distinct factor, with the three factor loadings ranging from .73–.83.Footnote 7
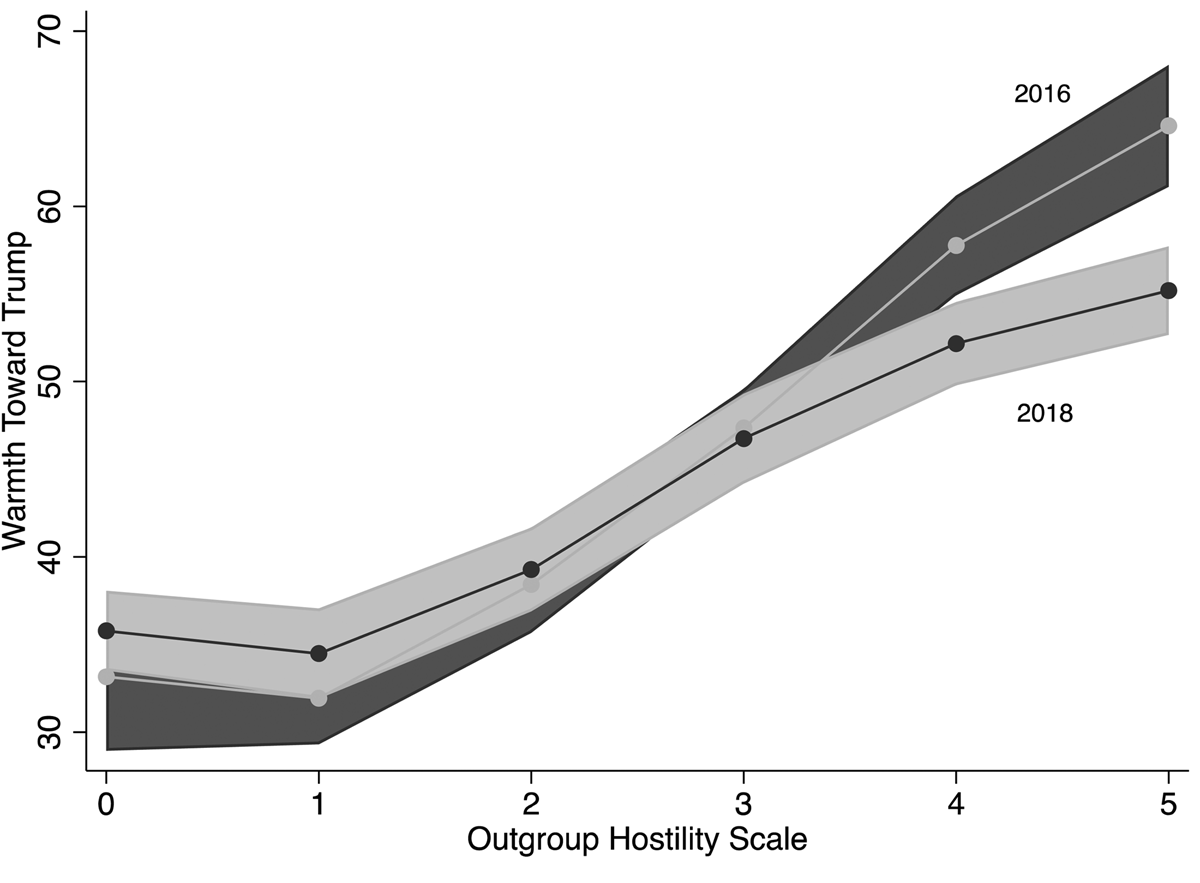
We estimated the relationship between our outgroup hostility scale and the feeling thermometer for Trump for both 2016 and 2018 among White respondents, controlling for party identification, ideology, and other standard demographic factors. We allow for nonlinearity in the effect of outgroup hostility due to our specific interest in voters located at the extreme ends of the outgroup hostility scale—especially racial liberals. Specifically, we converted our outgroup hostility scale to a 6-point scale (0–5). We then estimated the effect of outgroup hostility by including in each regression a series of dummy variables representing each point on the scale (omitting the first category as the baseline). The full results for this analysis are presented in our Supplementary Appendix. We summarize the findings for outgroup hostility in Figure 2. Our results are consistent with other studies which find a strong, positive effect of racial hostility on support for Trump during the 2016 campaign (Fording and Schram Reference Fording and Schram2017; Sides et al. Reference Sides, Tesler and Vavreck2018; Jardina Reference Jardina2019). However, in this case we are more interested in whether the pattern of support for Trump changed in 2018, especially among racial liberals. The results suggest this has not happened. Racial liberals opposed Trump in 2018 just as strongly as they did in 2016. In many ways, this is not surprising. Trump's racism was well-known during the 2016 campaign and there is probably not much he could have done to worsen his reputation among racial liberals after being elected.
Effect of outgroup hostility on support for Donald Trump, 2016 versus 2018. Note: The figure displays the predicted level of warmth (and 95% confidence interval) toward Trump by outgroup hostility. Outgroup hostility is collapsed to a 6-point ordinal scale to allow for nonlinearity. Predicted Trump warmth values are computed based on a regression model which controls for party identification, ideology, economic evaluations, education, income, age, gender, and church attendance. Data sources include the 2016 ANES Time Series Study and the 2018 ANES Pilot Study (White respondents only). See the Supplementary Appendix for estimation and measurement details.

Interestingly, there appears to have been a small, yet statistically significant decrease in support for Trump among those at the far right of the outgroup hostility scale—those who we refer to as racial extremists. Although racial extremists still supported Trump far more than racial liberals and moderates in 2018, it is not surprising to find that they have become a bit more lukewarm on Trump compared to 2016. Trump set high expectations with his racially inflammatory rhetoric during the 2016 campaign but like most presidents, Trump has been unable to fully deliver on his extravagant promises. Nevertheless, the magnitude of the decrease in support for Trump from 2016 to 2018 is, in our analysis, small and there is no doubt that White racial conservatives and extremists continued to support Trump in 2018, even if they had become disappointed to some degree.
Although it appears that the Blue Wave backlash may not have been driven by increased opposition to Trump, there is a second mechanism through which racial liberalism may have led to the sweeping Democratic victory in 2018. Rather than becoming more negative in their feelings toward Trump, racial liberals may have become more determined to defeat him at the polls. Our final two analyses suggest that this was in fact the case. The political mobilization of the racial left has indeed intensified in opposition to Trump's racism, contributing to the 2018 Blue Wave. We provide two sources of evidence to support this conclusion. First, we return to the 2016 and 2018 ANES surveys to examine the relationship between outgroup hostility and political participation for both 2016 and 2018 (again limiting the sample to White respondents).
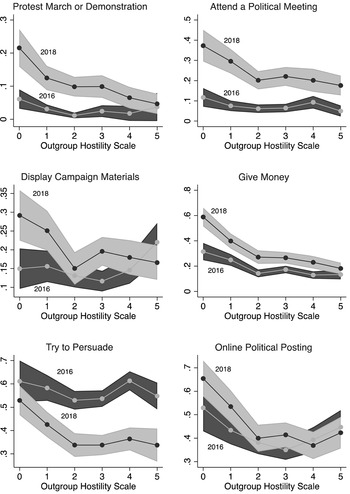
Specifically, we estimated the effect of outgroup hostility on the respondent's self-reported participation (0 = no, 1 = yes) in six different political activities over the previous 12 months, where the activities include (1) attending a political protest, (2) attending a political meeting, (3) displaying or wearing campaign materials, (4) giving money to a political candidate or organization, (5) trying to persuade others to vote one way or another, and (6) posting a political comment on social media. We then estimated the relationship between outgroup hostility and each participation item, controlling for party identification, ideology, the feeling thermometer for Trump, and other demographic factors.Footnote 8 We again allowed for nonlinearity in the effect of outgroup hostility. We also allowed for nonlinearity in the effects of party identification and the Trump feeling thermometer. The results for each of the participation items are summarized in Figure 3 (the full regression results can be found in our Supplementary Appendix).
Effect of outgroup hostility on political participation, 2016 versus 2018. Note: The figure displays the predicted probability of participation (and 90% confidence interval) for six types of political activity surrounding the 2016 and 2018 elections by outgroup hostility. Predicted probabilities were computed based on a logistic regression model which controls for party identification, ideology, economic evaluations, the feeling thermometer for Donald Trump, education, income, age, gender, marital status, and church attendance. Data sources include the 2016 ANES Time Series Study and the 2018 ANES Pilot Study (White respondents only). See the Supplementary Appendix for estimation and measurement details.

Ordinarily, we would expect that the level of mobilization in 2018 would be lower than what it was in 2016 due to the fact that participation usually drops off during midterm elections. Although voter turnout in 2018 (50.3%) was lower than it was in 2016 (60.1%), post-election reports indicate that the level of voter mobilization efforts by political organizations in 2018 actually exceeded that of 2016 (U.S. Elections Project Reference Wasow2019). Our results from the ANES for White respondents are generally consistent with these reports as participation in several types of political activities (other than voting) surrounding the 2018 campaign was higher than the levels seen in 2016. However, as we can see in Figure 3, the increase in mobilization was not evenly distributed across the White electorate. Rather, the increase in mobilization in 2018 was significantly related to outgroup hostility. For the most part, the level of participation remained the same on the extreme right, despite the fact that enthusiasm for Trump may have dampened a bit among racial extremists (as we noted above). For only two types of activities—attending a political meeting and trying to persuade others how to vote—did the participation level differ significantly in 2018 for racial conservatives. Interestingly, the direction of change was different in each case. Compared to 2016, in 2018 racial conservatives were more likely to attend a political meeting but less likely to try to persuade others how to vote.
The story changes significantly when we examine the increase in participation on the racial left. Participation in 4 of the 6 items (protest, attending meeting, displaying campaign materials, and giving money) increased among White racial liberals in 2018. Similarly, in each of these cases we also see that the magnitude of the increase in 2018 was larger for racial liberals compared to racial conservatives. There is also a significant difference between racial liberals and conservatives in efforts to persuade others. Even though racial liberals were just as likely to engage in this type of activity in 2018 as they were in 2016, as we noted above racial conservatives were significantly less likely to try to persuade others in 2018. For only one activity does the pattern of participation in 2018 closely resemble that of 2016—online political posting. However, it is noteworthy that of the six activities included in our analysis, this is the activity that is the least costly in terms of time as well as money. Overall, given the fact that these results are found even after controlling for party identification, ideology, and general opposition to Trump, the findings provide compelling evidence that racial liberalism is indeed an important mechanism underlying White participation in the Blue Wave.
We supplement this analysis using validated turnout data from the most recent version of the VOTER panel survey for 2016–2018 to better understand the impact that this mobilization had on White turnout in 2018. For this analysis we focus on two processes that affected the composition of the midterm electorate—the mobilization of new voters (defined as those who had not voted in 2016 but then did in 2018), and the demobilization of 2016 voters (defined as those who voted in 2016 but did not vote in 2018). If racial liberals were mobilized more so than racial conservatives in 2018, outgroup hostility should be negatively associated with the turnout of 2016 non-voters in 2018 (racial liberal mobilization). Conversely, we would expect to see a positive relationship between outgroup hostility and drop off in voting among those who voted in 2016 (racial conservative demobilization). In other words, White racial liberals who were keen to participate in the Blue Wave to repudiate Trump are hypothesized to both be more likely to be mobilized and less likely to be demobilized in 2018.
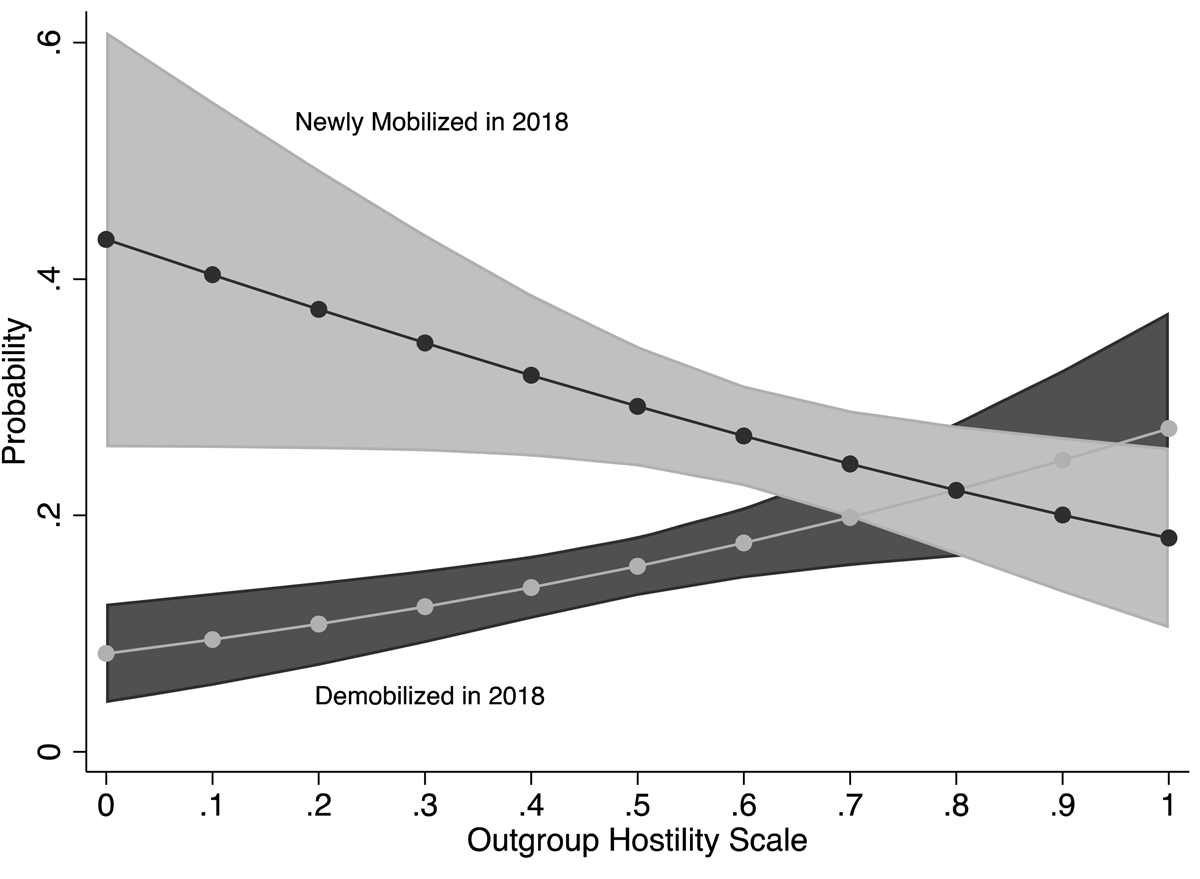
The results of our analyses of 2018 turnout are presented in Figure 4. Specifically, the figure presents the predicted probability of voting in 2018 (based on a sample of White 2016 non-voters) as well as the probability of not voting in 2018 (based on a sample of White 2016 voters). As before, we control for other political attitudes as well as other economic and demographic factors (see the Supplementary Appendix for details). Generally, the results are consistent with our analysis of political participation and provide strong support for our specific hypotheses regarding the importance of outgroup hostility in the process of mobilization and demobilization in 2018. Specifically, we find that outgroup hostility had a statistically significant effect in both the mobilization and demobilization analyses. Of those who sat out the 2016 election, racial liberals were significantly more likely to vote in 2018 than racial conservatives. Indeed, our results suggest that the most extreme racially liberal 2016 non-voters were approximately twice as likely to vote in 2018 than the most extreme racial conservatives. Similarly, racial liberals who voted in 2016 were significantly less likely to sit out 2018 compared to racial conservatives. Overall, these findings offer strong evidence that the success of the Blue Wave was in part driven by the participation of White racial liberals and that mobilizing racial liberals, White as well as non-White, may indeed be an effective electoral strategy to combat the mainstreaming of racism.
Effect of outgroup hostility on changes in voter turnout, 2016–2018. Note: The figure displays (1) the predicted probability (and 95% confidence interval) of voting in the 2018 general election among 2016 non-voters (Newly Mobilized) and (2) the predicted probability of not voting (and 95% confidence interval) in 2018 among 2016 voters (Demobilized) by outgroup hostility. Predicted probabilities were generated based on logistic regression models using validated turnout data for 2016 and 2018 from the 2018–2019 VOTER survey (White respondents only). The logistic regression models control for party identification, ideology, a social issues scale, the modern sexism scale, support for universal healthcare, evaluation of the economy, 2016–2018 change in family income, church attendance, marital status, education level, age, and gender.

RETHINKING THE PROTEST–ELECTION CONNECTION IN A TIME OF RESURGENT RACIAL LIBERALISM
Our results lend strong support to our argument that the relationship of protests to elections may be changing. As we have documented elsewhere (Fording and Schram Reference Fording and Schram2020), changes in the political opportunity structure after 2008 led to a merging of protest and electoral politics that eventually helped put Trump in the White House. Today, consistent with the theory of movements creating their own opposition in the form of counter movements, the merging of protest and electoral politics may lead to Trump's ouster in 2020 in the face of a resurgent racial liberalism. The multi-racial composition of 2020 #BlackLivesMatter protests may be not an isolated development but instead part of a broader counter movement rising up to push back against the racism that Donald Trump has exploited for his own political ends. The Resistance that sprung up in response to Trump's ascension to the White House led to the Blue Wave that defeated Republicans in the 2018 midterm elections. The Blue Wave was powered by a multi-racial coalition of racial liberals keen to repudiate Trump's racism. The multi-racial coalition of racial liberals involved in the protests is arguably part of the same multi-racial coalition that is focused on defeating Trumpism at the ballot box. In the 1960s, and at other times as well, the protest–election connection often involved younger, male Black protesters influencing a more diverse but older, and disproportionately White electorate composed of men and women. Today however it might be better to emphasize that a multi-racial coalition of protesters is not just influencing but joining a multi-racial coalition of racially liberal voters.
Trump's 2016 campaign built off white resentment to the presidency of Barack Obama (the Obama effect) but then went on to stoke White outgroup hostility especially toward Muslims, Latinx immigrants, as well as African Americans. High levels of outgroup hostility proved to be a potent factor in determining whether White voters supported Trump. Once in office, Trump's presidency however led to Whites with low levels of outgroup hostility rising up and defeating Republicans in the 2018 midterms (the Trump effect). Racially liberal Whites are joining a multi-racial coalition to defeat Trumpism, sometimes participating in protests and sometimes voting.
Whether it is epressed in protests or elections, many Whites are appalled by Trump's racist politics, including his encouraging police brutality against communities of color and his demonization of #BlackLivesMatter as a “symbol of hate” (Cohen Reference Cohen2020). Our research that we have reported in the foregoing analysis is suggestive of how a broad, multi-racial coalition of people with liberal attitudes on issues of race and diversity might well prove to be available for successful mobilization not just to defeat Trump and his racism but perhaps to sustain long-term change for racial justice.
Not everyone will agree with the way we are characterizing the relationship today between the protests and elections. They have often been studied as distinct forms of politics and not always related. It is true protests and elections often involve different leaders and actors. It is more than readily apparent that still today to even the casual observer most often protesters appear to be younger and less well-off and also more alienated from the conventional political system. Piven and Cloward (Reference Piven and Cloward1977) however for years prominently emphasized that there is a symbiotic relationship between protest and electoral politics. A growing body of Political Science research in fact has found evidence of the connection between protests and elections (see Gillion Reference Gillion2020; Wasow Reference Wasow2020). In particular, protests publicize grievances, heighten consciousness about them, intensify conflict over them, and mobilize support for taking action regarding them, but elected officials at critical moments can feel pressure that if they do not respond a voting public will make them pay. In fact, our own past research showed that the connection between protests and welfare policy responses in the late 1960s and early 1970s (Schram and Turbett Reference Schram and Turbett1983) was greatest when policymakers were more likely to face electoral consequences (Fording Reference Fording1997). In other words, choosing to emphasize either protest or electoral politics at the expense of the other is a false choice and a strategic mistake.
So it is with the relationship of the #BlackLivesMatter protests and the recent elections (Putnam et al. Reference Putnam, Chenoweth and Pressman2020). In fact, as we have suggested, their relationship may be stronger than the connection between previous protests and elections. Today's racially diverse set of protesters, who are in fact often young and unlikely to be active voters, are a key target group for mobilizing non-voters to extend the 2018 midterm Blue Wave into the 2020 presidential election. Victory in national elections today may depend not just on responding to the cries of the diverse protesters but mobilizing them as a multi-racial coalition of voters to repudiate the racism that continues under Trump to permeate our politics. The blurring of the boundary between protest and election politics may be a significant dimension to what is happening.
In fact, some Republicans have acted in ways that suggest they are aware of the new connections between protest and election politics and are seeking to sever them. In Tennessee, they moved to penalize certain relatively harmless forms of protest, such as camping out on state property, and specifying among the possible punishments losing the right to vote (Axelrod Reference Axelrod2020). Republican officials are indicating that they think protesters can be threatened by depriving them access to the ballot box. This is undoubtedly going to be subject to litigation for it is likely to be judged a blatant attempt to threaten protesters with denying them a basic constitutional right to participate in elections. This is telling in the least suggesting that Republicans are likely aware that increasingly the protesters are also voters and are part of a broad multi-racial coalition who actively resist the Republican Party's racism.
Times have changed as has the protest–election connection and what it portends for our politics going forward. In 1968, the protests of the Black Rebellion, which included many riots involving mass destruction and other acts of physical violence, could be used by Richard Nixon the Republican nominee against the incumbent President Lyndon Baines Johnson to claim the President had failed to enforce “law and order.” Today, the protest–election connection could prove to be quite different because an incumbent Donald Trump is now vulnerable to repudiation as a racist President who has consciously chosen to not combat persistent racial injustice but instead to perpetuate it.
SUPPLEMENTARY MATERIAL
The supplementary material for this article can be found at https://doi.org/10.1017/rep.2020.40.