Implications
Knowing the technical properties and protein composition of white and merino wools is very important for the textile industry. The diameter and curvature of the fibre and protein composition of black and white merino wools were compared. Both breeds had similar fibre diameter and curvatures and differences were found in the proportions of high-sulphur protein (HSP) and high-glycine–tyrosine protein (HGTPs) classes, but not among the type I and II keratins. Results suggest structural differences between the black and white merino wool at the fibre level, specifically in the sites where these proteins are located in the matrix of the fibre, leading to a paracortex proportion reduction, and an orthocortex proportion increase. These changes have an effect on fibre quality and implications for their use by the textile industry.
Introduction
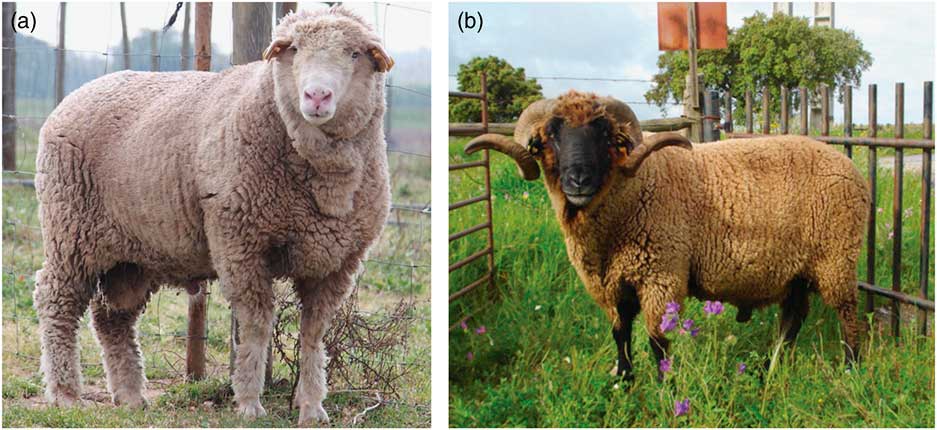
Animal fibres are very important in the world’s textile industry. Fine fibres include Mohair and Cashmere, both from goats, alpaca (Vicugna pacos), qiviut from muskox and sheep’s wool. Sheep’s wool is one of the world’s most economically important agricultural commodities. This fibre has historically formed the basis of the economies of Southern Hemisphere countries, with the finest quality sheep’s wool (ranging from 16 to 25 µm) being obtained from merino sheep. The origin of merino sheep is unclear but they were present on the Iberian Peninsula (Spain and Portugal) in the early Middle Ages (Pereira et al., Reference Pereira, Davis, Pereira, McEvoy, Bradley and Amorim2006), being exported to other countries in the last three centuries. Most of the modern merino breeds resulted from crosses with other types with the aim of improving aspects such as meat production or carcass conformation, in addition to the wool yield per animal. In the Iberian Peninsula, wool production continued practically unchanged using the original merino types until the 20th century. Today, merinos are known worldwide for their superior wool quality, being from the genetic point of view, a group of sheep separate from all others (Ciani et al., Reference Ciani, Lasagna, D’Andrea, Alloggio, Marroni, Ceccobelli, Delgado Bermejo, Sarti, Kijas, Lenstra and Pilla2015). As shown in Figure 1, two coloured types of Portuguese merino exist, white and pigmented (locally known as black merinos). The advent of dyed wool fabrics led to a worldwide-generalised preference for white wool that progressively replaced black wool. Portugal followed that trend, particularly during the 20th century, as a result of which white merinos now make up 85% to 90% of the merino ovine inventory (Matos, Reference Matos2000), whereas the numbers of black merinos has dropped significantly. Black merinos still exist in Portugal, particularly in the Northern Alentejo region and are considered a separate breed, albeit managed by the same breeders association as white merinos. The similarities are remarkable: white and black merinos are animals of similar size, productive and reproductive performance, sharing a common geographical distribution. The existence of these two types of merino has created an opportunity to conduct studies on wool property characteristics, allowing researchers to determine if the difference between these two types of wool that are solely linked to pigmentation.
(colour online). The white (a) and black (b) Portuguese merino sheep (Ovis aries) breeds. Photographs by the Portuguese Merino Breeders Association (Ėvora, Portugal).

The importance of proteomics in animal science and applications for it have increased significantly in recent years, albeit with some limitations, mainly regarding public databases (Soares et al., Reference Soares, Franco, Pires, Ventosa, Palhinhas, Koci, Martinho de Almeida and Varela Coelho2012). In this respect, proteomics-derived information is of extraordinary importance in sequenced and well-studied species (Almeida et al., Reference Almeida, Bassols, Bendixen, Bhide, Ceciliani, Cristobal, Eckersall, Hollung, Lisacek, Mazzucchelli, McLaughlin, Miller, Nally, Plowman, Renaut, Rodrigues, Roncada, Staric and Turk2015) including the sheep (Almeida et al., Reference Almeida, Palhinhas, Kilminster, Scanlon, van Harten, Milton, Blache, Greeff, Oldham, Coelho and Cardoso2016). Plowman et al. (Reference Plowman, Bryson and Jordan2000) first described the wool proteome and its application to the study of wool quality. Since then there have been more publications on distinct aspects including breed diversity in specific HSP groups (Flanagan et al., Reference Flanagan, Plowman and Bryson2002); the effect of oxidation and alkylation (Plowman et al., Reference Plowman, Flanagan, Paton, Fitzgerald, Joyce and Bryson2003), wool cuticle proteome (Koehn et al., Reference Koehn, Clerens, Deb-Choudhury, Morton, Dyer and Plowman2009; Koehn et al., Reference Koehn, Clerens, Deb-Choudhury, Morton, Dyer and Plowman2010) and wool fibre morphogenesis (Plowman et al., Reference Plowman, Harland, Ganeshan, Woods, van Shaijik, Deb-Choudhury, Thomas, Clerens and Scobie2015). For details, see review by Plowman et al. (Reference Plowman, Deb-Choudhury, Clerens, Thomas, Cornellison and Dyer2012). Numerous factors such as genetics (Allain and Renieri, Reference Allain and Renieri2010) and particularly nutritional factors (Almeida et al., Reference Almeida, Plowman, Harland, Thomas, Kilminster, Scanlon, Milton, Greeff, Oldham and Clerens2014) are known to affect wool quality and the proteome.
To the best of our knowledge, no studies have been conducted on the effect of pigmentation on wool characteristics protein abundance profiles. To compare a breed that has remained virtually unchanged over the last centuries with a breed that has evolved to meet selection criteria compatible with modern industry requirements is therefore of high relevance. In recent years, there has been a growing demand for pigmented fibres, particularly from niche markets that produce high-value traditional garments. The objective of this work is to contrast black and white merino wool with regard to the main wool characteristics, diameter and curvature, as well as the expression profiles of wool proteins using iTRAQ (isobaric tag for relative and absolute quantitation). Ultimately our aim is to understand the effect protein composition has on wool quality traits through studying an ancient breed of pigmented wool and what consequences that might have for the conventional and alternative textile industries.
Material and methods
Animals and sample collection
In this study, we sourced wool samples from farms in the Northern Alentejo (Estremoz Municipality, Évora district, Portugal). These were randomly obtained from ewes shorn in early June 2014, all of which were raised under an extensive management system based on natural pastures, without supplementation. The age of the animals ranged between 3 and 6 years, had a similar body condition score (2.5 to 3.5 in scale of 1 to 5) and were registered in the black merino and white merino herd books, managed by the Portuguese Merino Breeders Association (http://www.merina.com.pt/). An area of approximately 100 cm2 was shaved from the left hind quarters of each animal and kept in paper envelopes until further proteomic analysis. A total 15 different animals per breed were sampled, with one wool sample per animal.
Wool diameter and curvature determinations, scouring, protein extraction and quantification
The mean fibre diameter and curvature of the white and black merinos were determined by an optical fibre diameter analyser OFDA 2000 (BSC electronics, Ardross, WA, Australia) at the New Zealand Wool Testing Authority (Napier, New Zealand) following the manufacturer’s instructions. Extraneous dirt and sebum was removed from the wool fibres from each animal by washing first with 0.15% Teric GN9 twice for 2 min each time at 60°C, followed by washing twice with water for 2 min each time at 60°C. The fibres were air dried overnight and then washed twice with dichloromethane, twice with ethanol and twice with water for 30 s each time before being snipped to a powder with scissors. One sample was prepared by mixing an equal weight of powdered fibre from each of 15 white merinos, while a second sample was prepared by mixing an equal weight of fibre powder from 15 of the black merinos. From these two composite samples, four 10 mg replicates of each sample were shaken for 18 h with 1 ml of 8 M urea, 50 mM triethylamonium bicarbonate buffer (TEAB) and 50 mM dithiothreitol at pH 9.3. The wool protein extracts were quantitated using a 2DQuant kit (GE Healthcare Lifesciences, Auckland, New Zealand) following the manufacturer’s instructions.
Isobaric tag for relative and absolute quantitation study
The methodology employed for the iTRAQ analysis is as has previously been described (Almeida et al., Reference Almeida, Plowman, Harland, Thomas, Kilminster, Scanlon, Milton, Greeff, Oldham and Clerens2014). Briefly, a 250 μg protein aliquot was taken from each sample and precipitated using the methanol/chloroform procedure, before resuspension in 0.5 M TEAB. The extracts were reduced, alkylated and digested with 10 µg of TPCK-trypsin (Promega, Madison, WI, USA) as detailed (Almeida et al., Reference Almeida, Plowman, Harland, Thomas, Kilminster, Scanlon, Milton, Greeff, Oldham and Clerens2014). Next they were dried, resuspended and labelled with an iTRAQ® 8 Plex Multiplex kit (ABSciex, Foster City, CA, USA). The iTRAQ-labelled peptide digests were combined into one pooled sample, as described (Almeida et al., Reference Almeida, Plowman, Harland, Thomas, Kilminster, Scanlon, Milton, Greeff, Oldham and Clerens2014) and using standard methodology used in iTRAQ-based wool proteomics (Almeida et al., Reference Almeida, Plowman, Harland, Thomas, Kilminster, Scanlon, Milton, Greeff, Oldham and Clerens2014; Li et al., Reference Li, Zhou, Zhang, Guo, Li, Martin, Chen and Wang2018). Samples were resuspended in formic acid (FA), bound to a C18 Empore™ disk, eluted with 50% acetonitrile (AcN) in 0.1% FA and dried down. The labelled peptide extract was then reconstituted in 0.1% FA and separated on a 5 μM BioX-SCX column (Dionex, Auckland, New Zealand) into 10 fractions with 0%, 1%, 5%, 10%, 20%, 40%, 60%, 80% and 100% 2 M ammonium formate in 2% AcN. The iTRAQ-labelled peptides from each fraction were bound to a C18 Empore™ disk (Sigma-Aldrich, St. Louis, MO, USA), eluted with 50% AcN in 0.1% FA, dried down and reconstituted in 0.1% FA. LC–MS/MS was performed on a nanoAdvance UPLC coupled to a maXis impact MS equipped with a CaptiveSpray source (Bruker Daltonik, Bremen, Germany). A C18AQ nanotrap (Bruker Daltonik) was loaded with 2 µl of sample. The trap column was then switched in line with the analytical column (Bruker Magic C18AQ). The column oven temperature was 50°C. Elution was with a gradient from 0% to 40% B (98% LCMS-grade AcN, 0.1% FA) in 90 min at a flow rate of 800 nl/min. Solvent A was LCMS-grade water with 0.1% FA and 1% AcN. Samples were measured in automatic MS/MS mode, with a mass range of m/z 50 to 2200. For each MS collected, 10 MS/MS of the most intense ions in that mass spectrum were also collected. Acquisition speed was 2 Hz in MS mode and 10 or 5 Hz in MS/MS mode depending on precursor intensity. Precursors were selected in the m/z 400 to 1400 range. Active exclusion was activated after one spectrum for 0.3 min. Peak lists from the 10 BioX-SCX column fractions were concatenated using ProteinScape 3.1.0 rev3 (Bruker Daltonik) and then queried against Ovis aries entries in the NCBI nr database using Mascot search engine (v2.4, Matrix Science) using parameters previously detailed (Almeida et al., Reference Almeida, Plowman, Harland, Thomas, Kilminster, Scanlon, Milton, Greeff, Oldham and Clerens2014).
Statistical analysis of the results
Overall, the study included two groups: black merino wool and white merino wool. Results for wool diameter and curvature were compared using ANOVA-single-factor proceedings (Littel et al., Reference Littel, Freund and Spector1991). For the iTRAQ experiment, we used an approach previously described (Almeida et al., Reference Almeida, Plowman, Harland, Thomas, Kilminster, Scanlon, Milton, Greeff, Oldham and Clerens2014). In brief, the quantitative results generated by the Mascot search engine (v2.4) were reported in terms of the mean black: white ratio of each identified protein from the four technical repeats, the number of labelled peptides used in obtaining this mean and the geometric standard deviation. Given that the geometric standard deviation is a dimensionless multiplication factor, the 95% confidence intervals for each mean were determined. Because of the high sequence homology among the keratins and keratin-associated proteins (KAPs), the results were assessed in terms of the incorporation of all peptides for each protein in the analysis with unique peptides for only the proteins that appeared in all replicates. Relevant material and methods are detailed in Supplementary Material S1.
Results
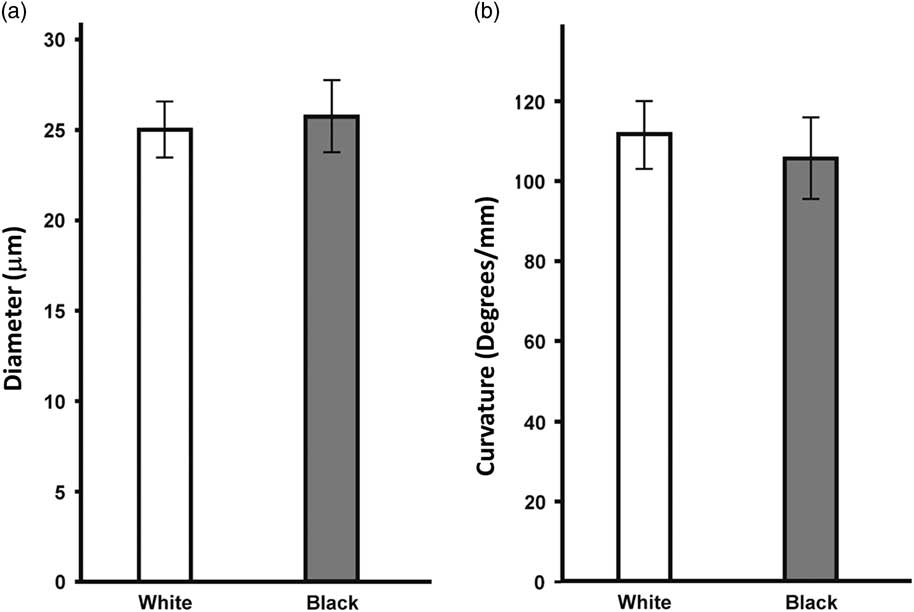
The average mean fibre diameter and curvature of the 15 white and 15 black Portuguese merinos are reported in Figures 2a and b, please refer to Supplementary Material S2 for further details. Both were very similar between the two breeds (around 25 µm) and no significant differences were found between breeds. The standard deviations for both the diameter and curvature were larger for the black merino than the white merino (SD diameter: white, 1.55 µm; black, 2.02 µm; and SD curvature: white, 8.9 °/mm; black 10.5 °/mm) indicating a larger variability within the black breed.
The average mean fibre diameter (a) and curvature (b) of the 15 white and 15 black Portuguese merino sheep (Ovis aries) as measured by OFDA and reported as microns (µm) and °/mm, respectively. The error bars represent the standard deviation of each mean.

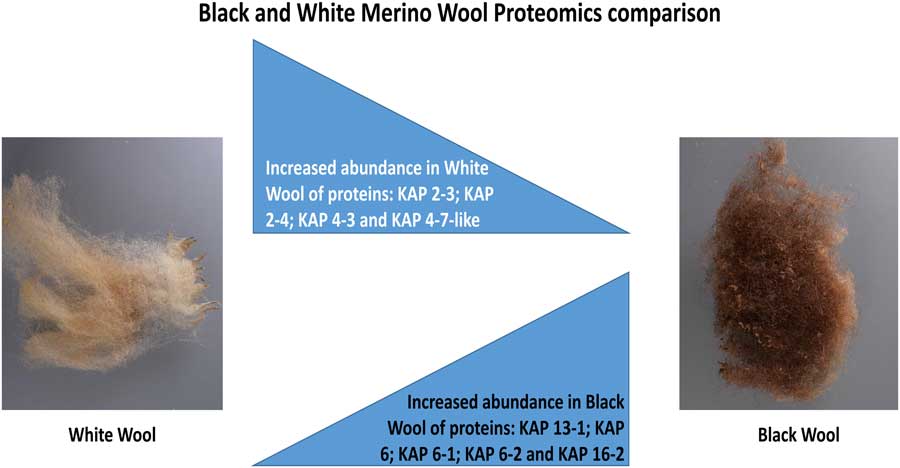
The differences in protein levels between the white and black merinos were determined using a gel-free proteomic approach involving labelling with iTRAQ isobaric tags followed by MS, using four replicate extractions of each of the combined white and black samples. The proteomic results are presented in Table 1 as ratios of the levels of keratins and KAPs of black over white merinos when all peptides for each protein are used in the quantitation as well as when limited to only the unique peptides for each protein. A schematic representation of the main results obtained are highlighted in Figure 3. Full results are shown in detail in Supplementary Material S3. Eight trichocyte keratins, 19 KAPs and one epithelial keratin were identified and quantitated using this process (Table 1). This included five type I and three type II trichocyte keratins, eight HSPs, two ultra-high-sulphur proteins (UHSPs) and nine HGTPs. Based on the results calculated using both all peptides or only unique peptides, the ratio of black/white for the trichocyte keratins and the one epithelial keratin were close to unity, though this ratio was considered significant for K35 when all peptides were taken into consideration and for K31, K33a and K33b when this was restricted to unique peptides.
(colour online). Schematic representation of the major wool (Ovis aries) proteomics results obtained in this experiment with differences in the accumulation of several KAPs (keratin-associated proteins). Results include the decreased abundance of proteins KAP 2-3, KAP 2-4, KAP 4-3 and KAP 4-7-like, and the increased abundance of proteins KAP 13-1, KAP 6, KAP 6-1, KAP 6-2 and KAP 16-2, all KAPs of the high-sulphur, ultra-high-sulphur and high-glycine–tyrosine classes.

Proteins in the black v. white merino sheep relative quantitation results

KAPs=keratin-associated proteins.
Score is the calculated probability that the observed match between the experimental data and the database sequence is a significant event; Number of matches is the total number of peptides identified for each protein (including those used for quantitation); Geometric SD is reported as the Black/White wool quantitation ratio is a geometric mean; No. of peptides refers to the number of peptides used for identification and quantitation of proteins (total and unique); 95% confidence interval refers to the reliability of the quantitation ratio based on its 95% confidence limits.
The proteins have been placed into family groupings. These include the type I trichocyte (or wool) keratins (K31, K33a, K33b, K34 & K35), type II trichocyte keratins (K83, K85 & K86), the high-sulphur proteins (KAP1-1, KAP1-2, KAP1-3 KAP2-3, KAP2-4, KAP3-2, KAP11-1 & KAP13-1), ultra-high-sulphur proteins (KAP4-3 & KAP4-7-like) and high-glycine–tyrosine proteins (KAP6, KAP6-1, KAP6-2, KAP7.1, KAP8-1, KAP8-2, KAP16-2, KAP19-3 & KAP19-6). The KAPs and most of the trichocyte keratins are found in the cortex of the fibre, whereas K35 and K85 are found in both cortex and cuticle. There is also no sequence that matches to KAP6 (gi|224556010) among recent sequence additions to the KAP6 family.
*Indicates significant different ratios (P<0.05).
In the case of the HSPs, the amounts of KAP2-3 and KAP2-4 were significantly lower in black sheep compared with the white breed when all peptides were taken into consideration, but not when limited to unique peptides, though this may have been because of the strong sequence homology between these two proteins. In contrast KAP13-1 was significantly higher in the black merinos when either all or only unique peptides were taken into consideration. In the case of black merino wools the UHSPs KAP4-3 and KAP4-7-like were reduced to half the levels of the white wools and this was considered to be significant for both proteins when all peptides were taken into consideration and significant for only KAP4-7-like when limited to unique peptides. Once again this could have been because of strong sequence homology between these two proteins. The HGTPs KAP6, KAP6-1, KAP6-2 and KAP16-2 all exhibited significant expression increases in the black wools over their white wool counterparts for all peptides, though the ratios were only significant for KAP6-1 and KAP16-2 when unique peptides were considered. This was possibly because of the strong sequence homology between KAP6, KAP6-1 and KAP6-2. KAP19-3 was also significantly more abundant in the black wools but only when unique peptides were considered.
Discussion
The merino group of breeds are one of the most important sources of wool for the textile industry worldwide. Although the majority of the merino breeds are not pigmented (i.e. white), in countries like Portugal and Spain where merino sheep were first selected, pigmented (i.e. black) varieties still exist. They provide an interesting source of wool not just to the mainstream textile industry, but also to a growing niche market of traditional garments that uses un-dyed pigmented wool as a differential characteristic (Matos, Reference Matos2000). Because black merinos have not been subjected to the selective breeding programmes over the centuries, as the white merinos have, they provide a unique opportunity to compare wool quality traits, such as diameter and curvature, between an ancient breed and a relatively modern one and relate them to the protein expression profiles in both types of wool. Herein, we conducted this analysis by comparing two very similar Portuguese merino breeds (the black and the white merinos), which differed mainly in their pigmentation, using a proteomics-based approach involving iTRAQ-labelling.
The relationship between protein content and crimp in wool fibres has long been of interest. Studies have shown that merino fibres with high staple crimp frequency had 20% more cysteine than poorly crimped fibres (Campbell et al., Reference Campbell, Whitely and Gillespie1972). Nutritional studies have shown that a qualitative restriction in merino sheep nutritional levels led to a significant increase in the staple crimp frequency (Campbell et al., Reference Campbell, Whiteley and Gillespie1975). Merino fibres are noted for a bilateral arrangement of their two major cell types, orthocortex and paracortex, with paracortex on the inside of curved fibres (Fraser and Rogers Reference Fraser and Rogers1955). As the fibre diameter of wool, in general, increases the crimp frequency decreases, as does the proportion of paracortical cells in the fibre (Orwin et al., Reference Orwin, Woods and Ranford1984). Some of the earliest in situ hybridisation (ISH) studies into protein expression in sequential cross-sections of merino wool follicles demonstrated that some KAPs were differentially expressed in the wool follicle as opposed to the keratins, which appear in all cell types (Powell et al., Reference Powell, Nesci and Rogers1991). The keratins were the first to be expressed in the follicle, followed by HGTPs in the portion of the cortex that was primarily thought to be the orthocortex. Next to appear were the HSPs in the opposite half of the cortex, primarily the paracortex, followed by UHSPs, also in the paracortex. In time, however, expression of the HSPs extended to both sides of the follicle, whereas the UHSPs remained confined to the paracortex. A more detailed examination of the expression of the KAP6 HGTP family by ISH in cross-sections revealed a variable distribution of this family, which was restricted to a few cortical cells in the lower follicle but which was present in most all cortical cells further up the follicle (Fratini et al., Reference Fratini, Powell and Rogers1993). Likewise, ISH-labelling of follicles has shown that the UHSP, KAP4, was generally localised in the paracortex of some follicles but has been seen to extend slightly beyond its boundary in others (Fratini et al., Reference Fratini, Powell, Hynd, Keough and Rogers1994), while more recently, another ISH study in Wiltshire sheep localised of one UHSP, KAP4-3, to the paracortex. In contrast, the HGTP KAP6-1 was expressed exclusively in the orthocortex of the wool follicle (Yu et al., Reference Yu, Gordon, Nixon, Bawden, Rogers, Wildermoth, Maqbool and Pearson2009). Of interest is the fact that in human hair follicles expression of the HSP KAP11-1 starts around the same time as the keratins, followed by KAP13-1 and that this occurs well before the first HGTPs appear (Rogers et al., Reference Rogers, Langbein, Winter, Ehmann, Praetzel, Korn and Schweizer2001; Rogers et al., Reference Rogers, Langbein, Winter, Ehmann, Praetzel and Schweizer2002). Likewise proteomic studies of sheep wool follicles have revealed that KAP11-1 and KAP13-1 are two of the earliest expressed KAPs (Plowman et al., Reference Plowman, Harland, Ganeshan, Woods, van Shaijik, Deb-Choudhury, Thomas, Clerens and Scobie2015). In mutant mice a concentrically asymmetric expression of KAP11-1 has also been associated with the production of scanty and faulty hair (Fujimoto et al., Reference Fujimoto, Takase, Kadono, Maekubo and Hirai2014). Recent research has demonstrated that the one of the major HSP families, KAP2, in human hair interacts not only with itself but preferentially with the head domain of trichocyte keratins (Fujikawa et al., Reference Fujikawa, Fujimoto, Farooq, Ito and Shimomura2012).
From this study, it was apparent that the difference in average diameter and curvature between the black and white merino wools were not significant. However, it is notable that the higher average fibre diameter in conjunction with the lower average curvature of the black merinos over the white merinos is consistent with previous studies that showed an inverse relationship between fibre curvature and diameter (Orwin et al., Reference Orwin, Woods and Ranford1984). The higher standard deviations for both average diameter and curvature in the black merino type would also be something that might be expected for a population subjected to less selective breeding than that of the white merinos. In fact, in the last 150 years, white merinos have become the predominant type in Portugal and across the world and, with a few exceptions, it is practically impossible to find pigmented merino wool in flocks bred for commercial wool production. Accordingly, white merinos have been subjected to a more intense selection pressure towards a thinner fibre in order to fulfil the requirements of the textile industry.
The quantitative proteomic analysis is also in line with these observations. Accordingly, reduction in the levels of the KAP4 UHSP family would be consistent with a reduction in the proportion of paracortex, while the increase in proteins from the KAP6 HGTP family would be consistent with an increase in the proportion of orthocortex. Such a trend is in line with other observations of the differential expression of these two proteins in the fibre and may suggest that there has been a decrease in paracortex with an associated increase in orthocortex. Furthermore, this would be consistent with a tendency towards the increase in average fibre diameter and the decrease in the average curvature of the black merino wools relative to the white merinos. Given that the HGTPs KAP16-2 and KAP19-2 are higher in the wool of black sheep it is also possible that they are also preferentially expressed in the orthocortex.
At this stage, it is not clear what the effect the reduced levels of the KAP2 HSP family might have on the fibre. They are known to interact with the head group of keratins in the macrofibrils and such interactions are an intrinsic part of the unique properties of wool fibres, as in the modification of the fibre through the use of stretch-set to produce pleats in skirts or creases in trousers. A reduction in the number of KAP2 HSPs in the black wool might affect such processes. In the case of KAP13-1 just what effect its increase would have on the properties of the fibres of the black sheep is also unclear. However, given that it is expressed shortly after KAP11-1, which is thought to be critical to the development of the overall macro structure of the fibre, it may also be important in this process.
Acknowledgements
This work was made possible with the funding from the Integrative Mammalian Research Centre of Ross University School of Veterinary Medicine (Basseterre, St. Kitts and Nevis, West Indies). The valuable collaboration of the Portuguese Merino Breeders Association (Ėvora, Portugal) associates is acknowledged, as is the use of pictures presented in Figure 1. In New Zealand, this work was supported by AgResearch Ltd (grant number MBIE C10X0710).
Declaration of interest
Authors declare that they have no conflicts of interest.
Ethics statement
This work involved the use of samples obtained from regular commercial sheep management procedures (shearing) in the region. As such, and following relevant legislation in Portugal and the European Union, no ethics committee approval is necessary to conduct this study. Author AM Almeida holds a FELASA grade C certificate enabling the design and conduction of animal experimentation in the European Union was the responsible for designing this research.
Software and data repository resources
Not applicable. Data or models were not deposited in an official repository.
Supplementary material
To view supplementary material for this article, please visit https://doi.org/10.1017/S1751731118001647