Introduction
The radiation from the Sun sustains life on the Earth and determines its climate. Solar irradiance on the outer atmosphere of the Earth today is about 1360 W m−2 (at a Sun–Earth distance of 1 AU≈1.5×10⁸ km). The radiation spectrum is similar to that of a 5800 K blackbody, this being the surface temperature of the Sun. Due to the presence of Terrestrial atmosphere, the radiation that reaches ground is differentially absorbed by the intervening gases: atomic and molecular oxygen and nitrogen absorb below 190 nm; ozone absorbs in the region 200–300 nm and weakly in the visible region; water vapour, carbon dioxide and oxygen show absorption bands in the near infrared. Furthermore, Rayleigh scattering and scattering from aerosols produce changes in the spectrum of the radiation that reaches ground.
Solar radiation has benign and harmful effects on biological systems. There is a lot of concern these days about overexposure to Solar ultraviolet (UV) radiation and the effect that ozone layer depletion may have on increasing the UV flux at the Earth surface. The main reason for the concern is the worrying rise in the number of people diagnosed with skin cancer and eye cataracts that has occurred in recent years. It is known that the damaging effects vary greatly with the wavelength of the radiation. For this reason UV radiation is subdivided into three bands in order of increasing damaging power: UVA (400–320 nm), UVB (320–280 nm) and UVC (280–180 nm). Fortunately, UVC radiation, which is very harmful to the skin and eyes, does not reach the Earth surface because it is almost entirely absorbed by the ozone layer.
The reason why UV radiation is harmful to living organisms is that the associated photons can be absorbed by biological molecules. At wavelengths shorter than 320 nm the photons have energies above 90 kcal mol−1 (4 eV) and these are able to break molecular bonds, causing often irreparable damage. The ‘action spectrum’ characterizes the wavelength dependence of specific biological damage. Researchers continue to measure action spectra for important biological processes, leading to a better understanding of the effects of irradiation and changes induced by ozone layer depletion. It is worth pointing out that all of the action spectra show a dramatic increase in damage with decreasing wavelength.
Ozone layer depletion causing higher levels of UVC at the ground re-proposes, in a time reversal approach, some of the conditions existing on the primordial Earth in the absence of atmosphere. In fact, the Solar radiation, together with the radiation from all other sources, drove the early fate of all biological systems stimulating a variety of chemical reactions and transformations. However, the continuous input of radiant energy not only made the primordial syntheses of organic compounds proceed but also caused their degradation. As a consequence, a steady-state chemistry was established, whenever possible, among precursors, bio-molecules and degradation products.
Tracking down the first steps in the evolution of life scenario is of fundamental importance in understanding ‘where’ and ‘how’ the life experiment took place. According to the Standard Solar Model, the Solar flux of the young Sun was lower than at present, but more recent Solar evolutionary models provide a value significantly higher than at present (see Sackman & Boothroyd Reference Sackmann and Boothroyd2003, Lammer et al. Reference Lammer, Ribas, Griessmeier, Penz, Hanslmeier and Biernat2004 and references therein). Furthermore, observational evidence on Solar-like stars at different evolutionary stages indicate that the early Sun should have experienced a highly active phase in particle and radiation emission from 4.5 to 3.5 Gyr ago (Thrany et al. Reference Thrany, Lammer, Selsis, Ribas, Guinan, Hanslmeier and Wilson2002), that is, during a period of time crucial for the emergence of life on Earth. X-ray and extreme ultraviolet (EUV) radiation (which comprise the region 0.1–100 nm) of the young Sun is expected to have been 100–1000 times stronger than the present Sun, on a time scale of 1 Gyr. Similarly, far ultraviolet (FUV) and UV radiation (which comprise the region 100–400 nm) of the young Sun is expected to have been 5–100 times stronger. This higher energy input at sea level bears important consequences in the identification of the environmental conditions that determined the epoch for the appearance of life and subsequently controlled its evolution (Messerotti & Chela Flores Reference Messerotti and Chela Flores2005).
Among the hypotheses on the origin of life, the extraterrestrial theory considers the interstellar organic material as an input for terrestrial chemical reactions yielding biological products. According to the above hypothesis, amino acids and other life important molecules are formed inside dust grain aggregates (Duley Reference Duley2000; Cecchi-Pestellini et al. Reference Cecchi-Pestellini, Scappini, Saija, Iati, Giusto, Aiello, Borghese and Denti2004). This material inseminated the Earth during the formation process from the pre-Solar nebula and afterwards via bombardment by comets and meteorites. The further aggregation of biological units into complex structures had to wait for convenient environmental conditions to occur. In particular, the Solar radiation flux, when the atmosphere was anoxic, played a catalytic or inhibiting role depending on its intensity. In a previous paper, we investigated the effects of UV radiation on water solutions of tyrosine in the laboratory using a broad-band xenon lamp (Scappini et al. Reference Scappini, Casadei, Zamboni, Monti, Giorgianni and Capobianco2007). We found that under conditions mimicking the irradiation of the Sun, the concentration of molecules decreases by about 80% in a period of time corresponding to about two weeks of above-atmosphere irradiation exposure of present Sun.
In this work we irradiate two more protein amino acids, phenylalanine and tryptophan. Their water solutions are exposed to different UV doses from a xenon lamp and investigated with both spectroscopic and analytic techniques. The results of the experiments contribute data to a discussion on the environmental conditions and the approximate time estimate for the appearance of life on Earth.
Experimental details
L-phenylalanine and L-tryptophan with a purity of 99% from Aldrich were dissolved in bi-distilled water to different concentrations. The solutions were placed in a quartz cell to a volume of 10×10×10 mm3. A magnetic stirrer was used to ensure uniform irradiation of the samples. Air was not removed from the solutions. In addition to the main UV absorption band in the vicinity of 200 nm, phenylalanine has a band at 257 nm due to the benzene ring with an absorption coefficient ε=200 l cm−1 mol−1 and tryptophan has a band at 278 nm with an absorption coefficient ε=5000 l cm−1 mol−1. An Oriel 6258 300 W xenon lamp was used as the radiation source. The infrared emission was cut off by the use of a water filter at the output of the lamp. The total power in the band from about 200 to about 800 nm was 1.5 W. The power in a 10 nm band around 257 and 278 nm was 2.5×10⁻² W. The power around 200 nm was more than one order of magnitude lower. The beam spot size on the front side of the cuvette was 10 mm in diameter.
The samples were irradiated for different time intervals. We started with 80 s corresponding to a dose of 2 J and ended with 4 h corresponding to a dose of 375 J. The samples were stored in a refrigerator at 4°C before and after irradiation to ensure chemical stability. Analysis of the transformations produced in the samples by UV irradiation was carried out using both spectroscopy and chromatography–mass spectrometry.
In the following sections we describe the investigation procedures and the results obtained. We draw some conclusions at the end of the article.
Spectroscopy
Ultraviolet spectra were taken in order to determine the change in the phenylalanine and tryptophan absorbance around 257 and 278 nm, respectively, as a consequence of UV irradiation. The band around 200 nm was not taken into consideration because it was poorly affected by the lamp flux and is at the limit of the spectrometer range. The spectrometer was a Jasco V-550 operated at a resolution of 5 nm. The spectra were recorded in the wavelength region 200–400 nm. Water and cuvette material contributions to the spectra were subtracted in a dual-beam arrangement.
Care was taken to minimize the effects on the absorbance from sample manipulation, such as those due to heating to room temperature, exposure to daylight, contamination, etc. The estimated error on the measured absorbance is of the order of a few per cent. Phenylalanine was irradiated at a concentration of 2×10⁻² mol l−1 and spectra were taken at a concentration of 1×10⁻² mole l−1. Tryptophan was irradiated at a concentration of 2×10⁻⁴ mol l−1 and spectra were taken at the same concentration.
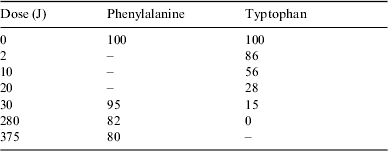
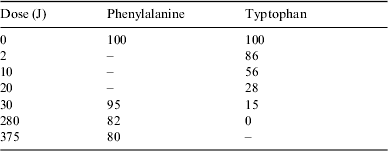
In order to normalize the absorbance of each irradiated sample (A) to the corresponding absorbance before irradiation (A°) the following ratio was calculated ΔA=[(A−A°)/A°]×100. The results from the UV spectra in terms of ΔA, averaged over three measurements, for different doses (power×exposure time) are given in Table 1.
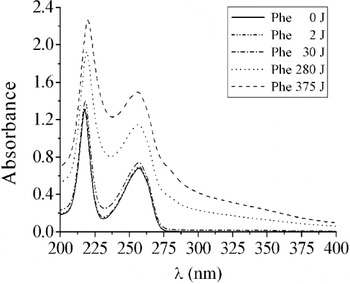
A sample of typical UV spectra of phenylalanine is presented in Fig. 1. It appears that the absorbance curves of the irradiated phenylalanine are coincident with the absorbance curve of the non-irradiated sample or lay above it. The wavelengths of the peaks do not move significantly from 257 nm, not even at the maximum irradiation dose. This indicates that upon irradiation phenylalanine is little affected or undergoes only some chemical transformation, depending on the dose. It is evident (see Table 1 and Fig. 1) that the radiation effects begin to be observable at doses larger than 2 J. The values of absorbance higher than that of non-irradiated phenylalanine can be explained by the contribution of compounds with a higher molecular weight than phenylalanine, for instance tyrosine. It is known that the absorption coefficient of the amino acids becomes larger with increasing complexity.
Ultraviolet spectra of water solutions of non-irradiated and irradiated phenylalanine at different doses with a xenon lamp. Spectra were taken at 1×10⁻² mol l−1, while irradiation was performed at 2×10⁻² mol l−1.

ΔA values of phenylalanine (1×10⁻² mol l−1) at 257 nm and of tryptophan (2×10⁻⁴ mol l−1) at 278 nm. The samples were irradiated at different doses with a xenon lamp. Phenylalanine was irradiated at a concentration of 2×10⁻² mol l−1. Tryptophan was irradiated at a concentration of 2×10⁻⁴ mol l−1. Errors in the ΔA values are estimated to be of the order of ±5%

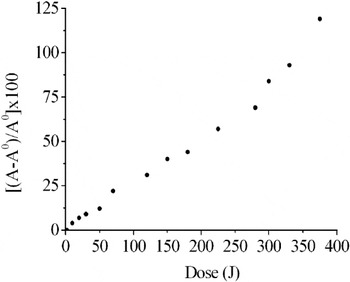
Figure 2 shows a plot of the data from Table 1 for phenylalanine. The curve represents the course of the 257 nm absorption changes upon irradiation from a xenon lamp. It shows that the absorbance of the solution increases with radiation dose. The almost linear behaviour indicates that phenylalanine is still present at high doses to form products with larger absorption coefficients.
Plot of ΔA=[(A−A°)/A°]×100 for phenylalanine (see Table 1) as a function of the irradiation dose.

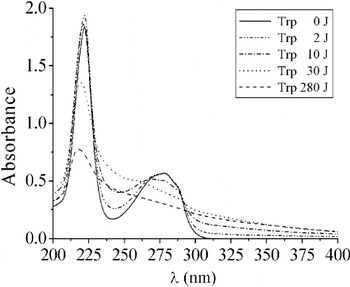
A sample of typical UV spectra of tryptophan is presented in Fig. 3. It is seen that the absorbance curves of the irradiated tryptophan are coincident or lay below the absorbance curve of the non-irradiated sample. With increasing irradiation dose the corresponding bands are smeared into broad features towards wavelengths longer than 278 nm. The irradiation effects start to be significant at doses larger than 2 J (see Table 1 and Fig. 3) as tryptophan undergoes fragmentation into simpler structures, for instance tyrosine and phenylalanine (Hecht et al. Reference Hecht, Bieler and Griehl2005).
Ultraviolet spectra of water solutions of non-irradiated and irradiated tryptophan at different doses with a xenon lamp. Spectra were taken at 2×10⁻⁴ mol l−1 and irradiation was performed at the same concentration.

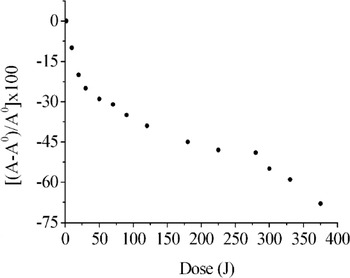
Figure 4 shows a plot of the data from Table 1 for tryptophan. It shows that the absorbance of the solution decreases with radiation dose indicating that mostly products with smaller absorption coefficients are formed.
Plot of ΔA=[(A−A°)/A°]×100 for tryptophan (see Table 1) as a function of the irradiation dose.

Chromatography–mass spectrometry
A number of aqueous solutions of non-irradiated and irradiated phenylalanine and tryptophan, respectively, see Table 1, were analysed by chromatography and mass spectrometry (high-pressure liquid chromatography–mass spectrometry, HPLC-MS) in the ESI (electron spray ionization) mode. The analytical setup consisted of an Agilent 1100 HPLC chromatograph coupled with an Esquire 3000 Plus mass spectrometer. The mass spectrometer detects positive ions resulting from species complexed with a proton or Na+ (from the ambient). For instance, phenylalanine with mass 165 shows peaks at 166 and 188 corresponding to PheH+ and PheNa+, respectively. The same mass spectrometer is also able to detect negative ions resulting from a proton subtraction. Thus, for instance, phenylalanine cations show a peak at 164. Chromatographic separations were obtained using both a Zorbax Extended C-18 (4.6×150 mm2, 5 μm) or a Zorbax Eclipse XDB-C8 resin analytical column, eluting for 5 min with bi-distilled water and then with a linear gradient of methanol 1% min−1 at 0.5 ml min−1, following the UV absorption bands at 257 and 278 nm, respectively. The peaks around 200 nm were not taken into consideration for the reasons already discussed in the spectroscopy section. An external standard was used in the chromatographic analysis to better constrain the quantitative determination.
(a) Phenylalanine
Samples of aqueous solutions of phenylalanine, non-irradiated and irradiated at different doses, were analysed by chromatography with an external standard and by HPLC-MS without any external addition. In the latter experiment, both positive and negative ions were searched for.
Table 2 presents the percentage of the remaining phenylalanine after irradiation at different doses from the chromatographic analysis.
Percentage of mass of phenylalanine and tryptophan remaining after irradiation at different doses from the chromatographic analysis. The error in the percentage is on the order of ±3%
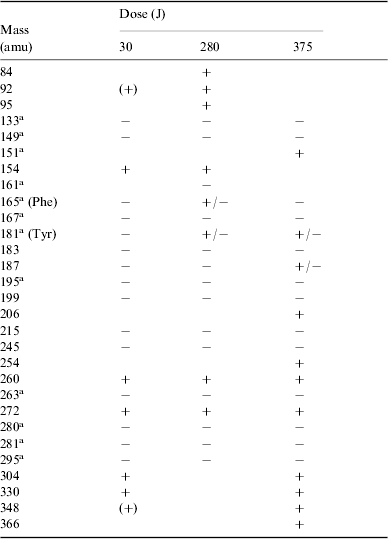
The search for ions produced by the irradiation process was conducted on three solutions at 30, 280 and 375 J, respectively.
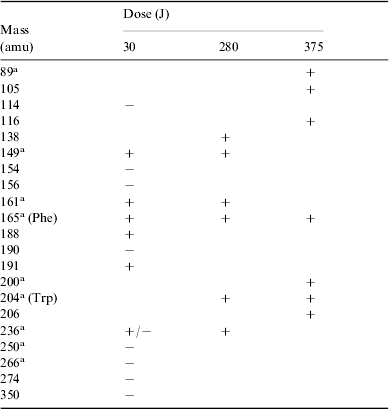
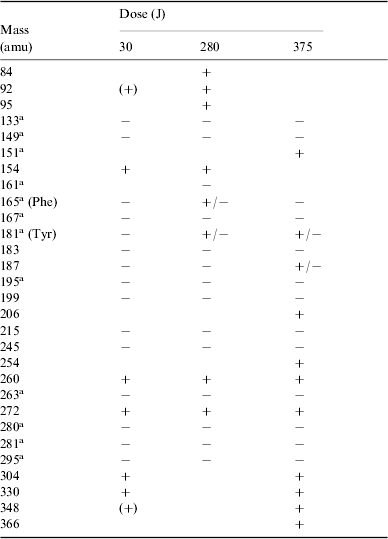
A total of 29 species were detected, most corresponding to products with higher molecular weight than phenylalanine, including tyrosine. In a very few cases the same species were found in the positive as well as in the negative ionic state; see Table 3.
Summary of all positive (+) and negative (−) ions detected by HPLC-MS analysis of irradiated solutions of phenylalanine at different doses. The indicated masses are those of the corresponding neutral molecules. Tentative detections are given in parentheses
a Molecular structures are discussed in the text.
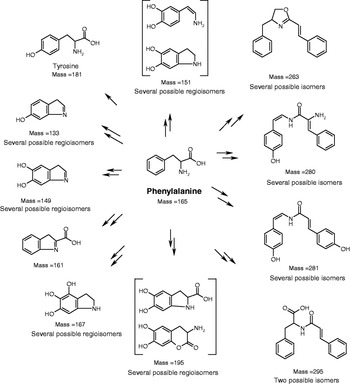
The spectroscopically observed increase of absorbance with irradiation dose, attributed to an attending complexification of the molecular structure, is consistent with the mass spectrometry findings. Among the most abundant ions, some can be formally related with compounds whose structures are hypothesized in Scheme 1.
Scheme 1.

Tyrosine (mass 181) was identified by its known retention time (R t) from chromatography. Compounds such as those with masses 280, 281 and 295 show a peptidic bond and appear closely related to natural dimers.
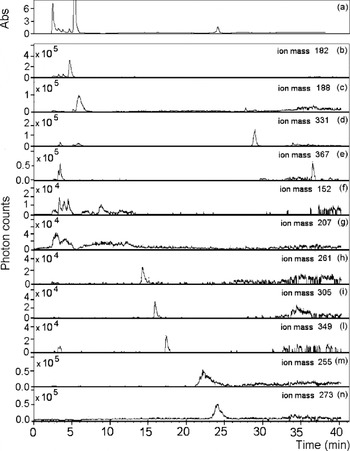
Figure 5 correlates the UV chromatogram at 257 nm of a sample irradiated at a dose of 375 J (a) with chromatograms of the extracted positive ions (b)–(n), detected in the HPLC-MS analysis, corresponding to compounds of masses 181, 187, 330, 366, 151, 206, 260, 304, 348, 254 and 272, respectively. The peak in (a) at R t=5.4 min is due to phenylalanine, corresponding to about 80% of the non-irradiated peak intensity.
Correlation between the UV chromatogram at 257 nm of a water solution of phenylalanine irradiated at a dose of 375 J with a xenon lamp (a) and the extracted positive ions (b)–(n) detected in the HPLC-MS analysis. The peak in (a) at R t=5.4 min is due to phenylalanine. The corresponding ion of mass 166 is omitted throughout the spectra.

The pH value decreases from 7 in the non-irradiated sample to 4 in the sample irradiated at 375 J.
(b) Tryptophan
Samples of aqueous solutions of tryptophan, non-irradiated and irradiated at different doses, were analysed by chromatography with an external standard and by HPLC-MS without any external addition. In the latter experiment, both positive and negative ions were searched for.
Table 2 presents the percentage of the remaining tryptophan after irradiation at different doses from the chromatographic analysis.
The search for ions produced by the irradiation process was conducted on three solutions at 30, 280 and 375 J, respectively.
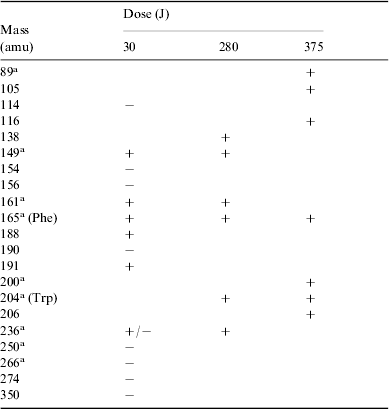
A total of 21 species were detected, most corresponding to species with lower molecular weight than tryptophan, including phenylalanine; see Table 4.
Summary of all positive (+) and negative (−) ions detected by HPLC-MS analysis of irradiated solutions of tryptophan at different doses. The indicated masses are those of the corresponding neutral molecules
a Molecular structures are discussed in the text.
The decrease in the absorbance with the irradiation dose, attributed to an attending simplification of the molecular structure, is consistent with the mass spectrometry findings.
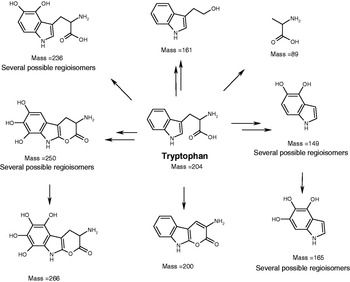
Among the most abundant degradation products we found ions which may correspond to compounds derived from the loss of the carboxylic group and the substitution of the amino group with a hydroxyl (mass 161), from the bi-hydroxylation of the aromatic ring (mass 236), and from the previous ones (mass 236) with the loss of the alkyl moiety (mass 149). Some of the most abundant ions can be formally related with compounds whose structures are hypothesized in Scheme 2.
Scheme 2.

Phenylalanine (mass 165) was identified by its known retention time from chromatography.
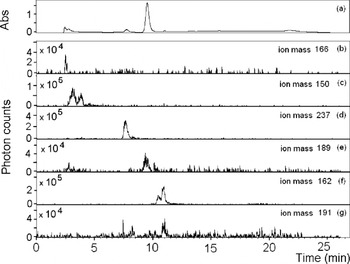
Figure 6 correlates the UV chromatogram at 278 nm of a sample irradiated at a dose of 30 J (a) with chromatograms of the extracted positive ions (b)–(g), detected in the HPLC-MS analysis, corresponding to compounds of mass 165, 149, 236, 188, 161 and 190, respectively. The peak in (a) at R t=8.9 min is due to tryptophan, corresponding to about 15% of the non-irradiated peak intensity.
Correlation between the UV chromatogram at 278 nm of a water solution of tryptophan irradiated at a dose of 30 J with a xenon lamp (a) and the extracted positive ions (b)–(g) detected in the HPLC-MS analysis. The peak in (a) at R t=8.9 min is due to tryptophan. The corresponding ion of mass 205 is omitted throughout the spectra.

The pH value varies from 6 in the non-irradiated sample to 4 in the sample irradiated at 375 J.
Discussion and conclusion
Our experiments were performed in water solutions, as water is an essential component of all biological systems and all biochemical reactions occur in water. It was this speculation that led Haldane (Reference Haldane1929) and Oparin (Reference Oparin1938) to propose that an aqueous ambient was necessary for the emergence of life and its evolution.
The primordial chemical reactions and the energy sources, which produced the early constituents of proteins and nucleic acids, have been simulated by many authors. One crucial point in these organic syntheses is the balance between the two effects of the radiation: stimulating reactions on the one hand and degrading precursors and products on the other. The Sun was the major source of radiant energy in initiating life and is still the major source supporting it.
The present above-atmosphere Solar radiation flux on Earth in a 10 nm band around 270 nm is about 5×10⁻⁴ J cm−2 s−1 or 6.8×10¹⁴ photons cm−2 s−1 (Zelik & Gregory Reference Zelik and Gregory1998). In our experiments, the samples were irradiated (200<λ⩽800 nm) for periods of time from 80 s to 4 h, corresponding to doses of 2 to 375 J, with the surface of the irradiated (and stirred) cuvette of 10×10 mm2. This is equivalent to Solar irradiation from 1 h to 9 days. In these calculations a 100% atmospheric transmission is assumed. A lower value, owing to environmental conditions, implies longer Solar irradiation periods. On the other hand, the UV flux of the young Sun on the Earth could have been about one order of magnitude stronger than at present (see the introduction); in this case, the above time estimates should be reduced.
The photochemistry of amino acids has been widely studied, in the laboratory, over the last few decade (Bensasson et al. Reference Bensasson, Land and Truscott1983; Creed Reference Creed1984; Davies & Truscott Reference Davies and Truscott2001; Ehrenfreund et al. 2001, Scappini et al. Reference Scappini, Casadei, Zamboni, Monti, Giorgianni and Capobianco2007) both in aqueous solutions and in solid matrices. It was found that when the amino acids contain an aromatic ring the effect of the irradiation is reduced and in aqueous solution some hydrogenation of the ring occurs (O'Donnell & Sangster Reference O'Donnell and Sangster1970). In the present experiments, 80% of the phenylalanine survived after 4 h of exposure to UV flux (λ=257 nm) of 3.2×10¹⁶ photons cm−2 s−1, corresponding to a dose of 375 J, and 15% of the tryptophan survived after 1200 s of exposure to UV flux (λ=278 nm) of 2.6×10¹⁵ photons cm−2 s−1, corresponding to a dose of 30 J. As stated above, the xenon lamp used for irradiation has an insignificant effect on the band around 200 nm. Previous experiments on tyrosine (Scappini et al. Reference Scappini, Casadei, Zamboni, Monti, Giorgianni and Capobianco2006), under the same experimental conditions, showed that 50% of the amino acid survived after 3 h of exposure to UV flux (λ=273 nm), corresponding to a dose of 280 J, and 20% survived after 7 h, a dose of 630 J. In all cases, some of the degradation products are protein amino acids and maintain life-building capability.
The band around 200 nm, not discussed in the present experiments, is affected by the Solar radiation flux in the primordial environment and the chemical transformation produced should be added to that presently observed in phenylalanine at 257 nm and tryptophan at 278 nm.
The non-detection of dimers (in spite of a few products showing a peptidic bond) in the irradiated samples is not surprising, as an aqueous ambient does not favour condensation processes. Thus, in order to form peptides, before the appearance of enzymes, some sort of catalysis (in a broad sense) was needed. Furthermore, peptides, once formed, had to survive the Solar radiation to complete protein synthesis. Unfortunately (for the synthesis), laboratory experiments have shown that the presence of peptide bonds introduces an additional photolability in the system. In this sense the works of Hill et al. (Reference Hill, Coyle, Birch, Dawe, Jeffs, Randal, Stec and Stevenson1991), Nikogosyan & Görner (Reference Nikogosyan and Görner1999) and Mulcahy et al. (Reference Mulcahy, McInerney, Nikogosyan and Görner2000) on dipeptides are of interest. These authors have measured the quantum yields for the photodecomposition (Φd) of a number of dipeptides. They have found that the yields are smaller than those of the related monomers, but this effect is counterbalanced by the attending peptide bond scission (Φsc). As an example: Φd of Gly is 5.9, Φd of Gly–Gly is 2.8 and Φsc of Gly–Gly is 2.6 (at λ=193 nm). The rupture of the peptide bond can also take place at wavelengths longer than 193 nm as a consequence of the excitation of different groups elsewhere. The best explanation is a photoinduced intramolecular electron transfer from the absorbing site to the peptide bond, followed by its scission. As an example: Φd of Tyr is 19.7, Φd of Tyr–Tyr is 18.7 and Φsc of Tyr–Tyr is 2.9 (at λ=266 nm).
The above results support the hypothesis that some sort of shielding from the UV radiation was necessary for the peptidic synthesis to take place. This could have consisted in a protected location where chemical reactions occurred with only a mild exposure to Sun radiation, by the presence of UV-screening compounds (Cockell & Knowland Reference Cockell and Knowland1999), or by adsorption of reactants (and products) on mineral surfaces. These could also have acted as concentrating agents for the reactants in the aqueous ambient.
It is reasonable to assume that the first living structures, in the form of very simple cells, appeared earlier than the earliest available microfossils (Messerotti & Chela Flores Reference Messerotti and Chela Flores2005). The reliability of the date, 3.5 Gyr, of the Western Australia microfossils is now much debated in so far as it should be shifted to a more recent epoch (Braisier et al. Reference Brasier, Green, Jephcoat, Kleppe, Van Kranendonk, Lindsay, Steele and Grassineau2002). In this context, Solar irradiation evolutionary models together with laboratory simulations on prebiotic molecules may shed light on the epoch of the emergence of life on Earth. According to Berces et al. (Reference Berces, Kovacs, Ronto, Lammer, Kargel, Komlbe and Bauer2003), this epoch is presently quite undetermined, spanning from the end of the heavy bombardment until approximately 2 Gyr ago. The latter time constraint is supported by the oldest (2.2 Gyr) undoubtedly known biological microfossils found in Transvaal (South Africa) stomatolites.
In 1970 Margulis speculated that ‘If life is a manifestation of the existence of proteins, or more correctly a manifestation of catalysis by means of protein enzymes, the origin of life must have coincided with the origin of proteins, if not preceded them’ (Margulis Reference Margulis1970). This explains the interest in the formation, survival and polymerization of amino acids. Our next experiments will be on the UV exposure of dipeptides composed of aliphatic/aromatic monomers.
In conclusion, we have investigated the effects of UV radiation from 200 to 800 nm on aqueous solutions of phenylalanine and tryptophan, under conditions mimicking irradiation by the Sun of about 1 h to 9 days. However, in our simulations water was the dominant foreign collision partner of the amino acids, while in the primordial bath there would have been many more. This favoured a larger number of chemical reactions than in our simplified model. By taking into consideration the previous experiments on tyrosine (Scappini et al. Reference Scappini, Casadei, Zamboni, Monti, Giorgianni and Capobianco2007), the ease of UV decomposition in the series phenylalanine, tyrosine and tryptophan increases with the absorption coefficients (ε=200, 1300 and 5000 l cm−1 mol−1 at λ=257, 275 and 278 nm, respectively). We have also discussed the likely aqueous ambient in which life-leading reactions took place. Finally, we have speculated on the time span that was relevant for biochemistry to perform its most adventurous experiment: the proto-cell.
Acknowledgment
F. S. and F. C. received financial support for this project from Agenzia Spaziale Italiana.