Introduction
Atomic layer deposition (ALD) in combination with the strategy of templating, which utilizes the existing materials as scaffolds for ALD coating, is a powerful tool for fabricating nanomaterials and nanostructures. It allows control over the composition and physical properties in an exceptionally accurate manner. Basically, the ALD process involves self-limiting surface reactions from the gas phase with atomic monolayer precision. This permits perfect conformal coatings for thin films, even on surfaces with complex shapes. With rapid developments in nanoscience and nanotechnology research, different classes of nanomaterials such as nanoparticles, nanowires (NWs), nanotubes (NTs), and nanoporous membranes have become available in large quantities and varieties. Simply by templating or coating, ALD allows the creation of a second generation of nanomaterials and devices that produces novel, unexplored prototypes such as core-shell and multilayered material systems in three dimensions. Insightful reviews on ALD in general from a historical survey to emerging applications can be found elsewhereReference Lim, Rahtu and Gordon1–Reference George4 and in the other articles in this issue of MRS Bulletin.
In this article, we focus on the fabrication of three-dimensional (3D) nanostructures by ALD on the basis of surface modification of nanoporous materials, as described in the next section. By the connectivity of pores in space, briefly, we choose anodized alumina membranes and colloidal crystals because both have similar porosity but different scattering paths in terms of gas-phase diffusion. In accordance with ballistic-transport-based and random-walk-based ALD results, therefore, we first classify the ALD-modified nanoporous materials into NTs and inverted opals. We also point out the unusual crystallization behaviors due to the high curvature of surfaces from nanopores or NWs. The implication for applications is, in particular, governed by surface-limited reactions and charge-collection efficiency. Examples of conformal coating of the surfaces of semiconductor NWs and NTs and of site-selective ALD on patterned surfaces are summarized as well. These structures allow for the functional and direct fabrication of nanoscale devices in many emerging applications. Finally, we address recent device development using 3D structures by ALD and provide future research directions.
Surface modification of nanoporous materials
The capability of ALD has revealed improved material properties through surface modification and/or the replication of nanoporous materials and coating the insides of the pores with improved step coverage. For example, with increasing demands for structures possessing large surface areas as a direct pathway for collecting electrical charges, nanotubular and inverse opal structures of wide-bandgap semiconducting oxides, transparent conducting oxides, and ion conducting oxides are now emerging in the construction of dye-sensitized solar cells, lithium-ion batteries, and solid oxide fuel cells.Reference Martinson, Elam, Hupp and Pellin5–Reference Yao, McDowell, Ryu, Wu, Liu, Hu, Nix and Cui10 Despite promising applications, an understanding of ALD coating into nanoporous structures—within which reactant molecules are confined—is still in the very early stages. Here, we discuss the results of ALD coating onto different templates by focusing on how the nature of the macroporous materials affects the thickness uniformity in depth.
Ballistic transport-based ALD in 2D-arranged nanopore arrays
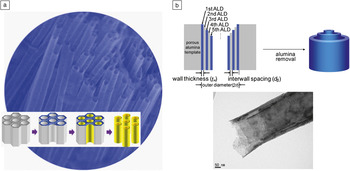
Although nature provides interesting routes for the spontaneous formation of nanotubular structures,Reference Patzke, Krumeich and Nesper11–Reference Jia, Sun, Yan, You, Luo, Han, Pang, Zhang and Yan14 the application of templates in ALD is indeed beneficial in that we can select the physical dimensions and the material system and composition with well-developed, abundant ALD chemistries in a controlled manner.Reference Bae, Yoo, Kim, Lee, Kim, Sung and Shin15 The first successful ALD fabrication of TiO2 and ZrO2 NTs was demonstrated by a collaborative team from Kookmin University in KoreaReference Shin, Jeong, Lee, Sung and Kim16 using track-etched polycarbonate (PC) membranes as templates (Figure 1a). One important observation is that the growth rate was nonlinear as a function of the number of ALD cycles when templates with sub-50 nm pores were subjected to the same deposition conditions. With a conceptually similar approach, ALD was demonstrated on porous alumina templates (e.g., anodic aluminum oxides—AAOs, porous anodic alumina—PAA, or porous aluminum oxide—PAO) to prepare TiO2 NTs.Reference Sander, Côté, Gu, Kile and Tripp17 With templates having straight, cylindrical pores (sub-100 nm in diameter) and a large mean free path (~micrometers), here we define the diffusion of ALD precursor molecules as “(quasi-)ballistic” transport in character. This concept contrasts with the random-walk diffusion that occurs within colloidal aggregates, as will be discussed in the next section.
(a) A scanning electron micrograph of TiO2 nanotubes produced by the template-directed atomic layer deposition (ALD) process with an AAO membrane, and a schematic illustration showing the experimental processes: from left to right, templates such as porous polycarbonate and alumina, OTS-SAMs by microcontact printing, ALD deposition onto the inner pores, and chemical etching of the templates. Adapted with permission from Reference Reference Shin, Jeong, Lee, Sung and Kim16. ©2004, Wiley InterScience. (b) Schematic depiction of the fabrication processes of multiwall metal oxide nanotubes, and a transmission election microscopy image of quadruple-wall anatase TiO2 nanotubes having 7 nm-thick and spaced walls and released after annealing, as an example. Adapted with permission from Reference Reference Bae, Yoon, Yoo, Han, Cho, Lee, Sung, Lee, Kim and Shin20. ©2009, American Chemical Society.

Even though lengths of up to several hundreds of micrometers can be coated by ALD conformally,Reference Elam, Routkevitch, Mardilovich and George18 this is still insufficient for applications in high-efficiency devices due to the limited areal density of the nanotube arrays. Toward improved performance of NT devices involving surface reactions, an interesting extension for achieving high surface area is multiwall (MW) NTs by which the specific surface area exposed per unit area, defined as the roughness factor,

can be significantly multiplied, where A is the surface area of a MWNT, n w is the number of walls, r is the outer radius of a MWNT, σ is the areal density of tubes (number of tubes∙cm‒2), l is the tube length, and t W is the wall thickness, when 2r > (2n w‒1)t W. Note that MWNTs are different from multilayer NTs in that the individual walls are separated from each other, and the surfaces are freely exposed. In other words, simply increasing the number of wall layers of NTs for a fixed areal density of NTs is very promising in applications for unit-area-based device performance, including solar cells, microbatteries, and fuel cells. By coating the surfaces of the tobacco mosaic virus as a template, double-wall TiO2 and Al2O3 NTs were prepared by realizing low-temperature ALD reactions (around 100°C, which is comparable with that for organic devices).Reference Knez, Kadri, Wege, Gösele, Jeske and Nielsch19 A generalized procedure was demonstrated for fabricating MWNTs by utilizing templated ALD synthesis in conjunction with alternating TiO2/Al2O3 nanolaminate structures, followed by wet chemical etching of the sacrificial alumina (Figure 1b).Reference Bae, Yoon, Yoo, Han, Cho, Lee, Sung, Lee, Kim and Shin20 Triple-, quadruple-, quintuple-, and sextuple-wall TiO2 NTs were achieved by this approach, and the specific surface area and the roughness factor were estimated to have increased significantly, exceeding those of existing nanoporous counterparts.
In addition to semiconducting NTs, insulating NTs such as SiO2 tubes are desirable in biomedical, oxidation protection, and nanoelectronic applications. Due to the lack of suitable ALD chemistry, however, ALD fabrication of silica NTs was only recently achieved using the so-called “self-catalytic” reactions of aminosilane precursors with water and subsequently ozone.Reference Bachmann, Zierold, Chong, Hauert, Sturm, Schmidt-Grund, Rheinländer, Grundmann, Gösele and Nielsch21 In these reactions, Si–OH was obtained by tethering a catalytic amino group in the vicinity of the chemical bonds within the precursors, overcoming the inert Si‒O bonds; the aminoalkyl arms remaining were oxidatively removed by ozone. The process is used, for example, to passivate Bi NWs or pore-narrowed materials for realizing nanosize effectsReference Lee, Farhangfar, Yang, Scholz, Alexe, Gösele, Lee and Nielsch22 by coating the inside of porous alumina templates with SiO2 before wire growth. In fact, semi-metallic Bi undergoes a metal-to-semiconductor transition below a critical dimension of ~30‒50 nm. Also avoiding an oxide shell of up to ~10 nm that can form under ambient atmosphere has been a longstanding issue for understanding quantum confinement effects. Oxidation protection and diameter tuning of Bi NWs were successfully demonstrated by introducing ALD SiO2 layers. The diameter of Au NWs can be tuned by coating ALD SiO2 layers and by performing electrochemical characterization of size-reduced Au NW arrays. The double layer charging current (noise of the nanoelectrodes, which is from electrical double layers at the interfaces) decreases with the reduction of the NW diameter.Reference Tan, Chong, Tang and Gao23
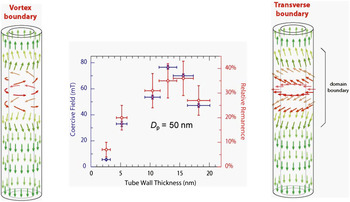
Understanding magnetization reversal in magnetic nanostructures is crucial for fundamental science and for applications in magnetic sensors, data storage, and spin electronic devices. ALD of magnetic materials is thus attractive in that we can magnetically design materials and create new types of magnetic nanostructures. By combining ferrocene [Bis(cyclopentadienyl)iron] and ozone, ALD was also applied for the fabrication of magnetite (Fe3O4) NTs by reducing multilayered SiO2/Fe2O3/SiO2 NTs under a mixed gas of H2 and Ar.Reference Zierold, Wu, Biskupek, Kaiser, Bachmann, Krill and Nielsch24 Interestingly, the authors found that two distinct modes exist in the magnetization reversal in accordance with the wall thickness of magnetite (Fe3O4) NTs prepared by ALD of water and iron (III) tert-butoxide precursors, as shown in Figure 2.Reference Bachmann, Jing, Knez, Barth, Shen, Mathur, Gösele and Nielsch25, Reference Escrig, Bachmann, Jing, Daub, Altbir and Nielsch26 The preparation of iron oxide NTs by ALD of ferrocene and oxygen was reported, and the resulting NTs had a mixed phase of hematite and magnetite/maghemite, probably due to the high deposition temperatures in the range of 350‒500ºC.Reference Rooth, Johansson, Kukli, Aarik, Boman and Hårsta27 The magnetization behavior of diameter-modulated magnetic nanowires, which were tailored by ALD, were studied, along with the effects on the coercivity due to stray fields from the wire nodes.Reference Pitzschel, Montero Moreno, Escrig, Albrecht, Nielsch and Bachmann28 Very recently, it was found that ferromagnetic layers of ternary oxides, such as (Co,Fe)O and (Ni,Fe)O, can be directly deposited without post-reduction processes.Reference Chong, Yau, Nielsch and Bachmann29
Left: A tube during the magnetization reversal from M 0z to –M 0z via a vortex mode (M = M 0z, where M is the magnetization, M 0 is the magnetic moment, and z is the axis). Center: Wall-thickness (t w)-dependent magnetic properties of magnetite (Fe3O4) nanotube arrays possessing an interpore distance of 105 (±10) nm and length of 1000 nm (blue, coercivity Hc//; red, remanence relative to 1 T) for 2.6 (±0.7) ≤ t w ≤ 18.2 (±1.9) nm. Near a 14 nm wall thickness, two distinctive reversal modes are separated. Right: The equivalent situation by means of a transverse reversal mode. D p, the diameter of pore. Colors were employed to highlight the domain boundary in red. Adapted with permission from Reference Reference Escrig, Bachmann, Jing, Daub, Altbir and Nielsch26. ©2008, American Institute of Physics.

In contrast to ALD of ferro/ferrimagnetic oxide NTs, successful, direct fabrication of metallic magnetic NTs by ALD is rare in the literature, even though NiO and CoO NTs can be transformed upon reduction processes under a hydrogen atmosphere.Reference Daub, Knez, Gösele and Nielsch30 Recently, ALD of pure Ni layers into silicon vias (aspect ratio, 5:1) as well as on Si NWs using Ni(dmamb)2, nickel bis(1-dimethylamino-2-methyl-2-butanolate), Ni[OC(CH3)(C2H5)CH2N(CH3)2]2, and NH3 as reactants at 300ºC was demonstrated.Reference Kim, Lee, Heo, Lee, Chung, Kim, Hong, Heo and Kim31 The authors first showed the selective deposition of metallic Ni films onto chemical patterns, as will be discussed later. Diverse hydrogen-plasma-assisted ALD processes of metal layers await detailed experimental studies into porous structures with high aspect ratios.
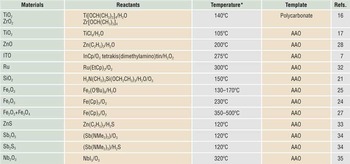
On noble metallic NTs, the preparation of Ru NTs (aspect ratio of 10) by ALD of bis(ethylcyclopentadienyl)ruthenium and oxygen onto AAO templates at 300ºC were reported, and after 180 ALD cycles, the resulting wall of Ru NTs was continuous, probably owing to the relatively long incubation time.Reference Lee, Yim, Kim, Kim and Kim32 The 2D pore template-based formations of NTs by ALD are summarized in Table I.
Negative-template-directed formation of nanotubes by atomic layer deposition.

* Wider temperature zones for atomic layer deposition exist in the references; representative values are displayed.
Et (ethyl), Cp (cyclopentadienyl), Me (methyl), Bu (butoxy)
ITO, tin-doped indium oxide; AAO, anodic aluminum oxide
Random walk-based ALD in 3D nanopore arrays
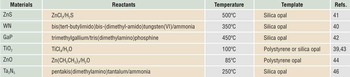
Other types of templates with 3D pore channels are inverse opal structures (partly or fully filled structures by infiltrating into the opal interior), which also present a model system to study gas-phase dynamics inside porous media, as summarized in Table II. Dielectric materials arrayed periodically with appropriate spacing, widely known as photonic crystals, exhibit different colors according to their glancing angles as caused by changes in the symmetry of the structure as it interacts with light. Although self-assembly of monodisperse spherical colloids has served as a facile route to create 3D dielectric structures over the past two decades, results from theoretical studies testify that a close-packed face-centered-cubic (fcc) lattice for dielectric spheres does not possess a full bandgap in which the propagation of light waves is forbidden for all wave vectors.Reference Ho, Chan and Soukoulis36, Reference Leung and Liu37 This is known to be due to the degeneracy at the W point of the first Brillouin zone that is induced by the symmetry of the fcc lattice (no formation of standing waves at certain directions). Accordingly, surface modification of opals by ALD is very promising in that (1) the structural alteration by an ALD coating can possibly break this degeneracy, as expected by Yablonovitch and his colleagues;Reference Yablonovitch, Gmitter and Leung38 (2) it allows for an increase in or tuning of the refractive index of systems by adopting a number of ALD chemistries; and (3) instead of completely filled inverse opals, photonic crystal structures having thin “shell” layers can make the photonic bandgap wider.Reference Yablonovitch, Gmitter and Leung38, Reference King, Graugnard and Summers39
Inverse opal structures prepared by atomic layer deposition.

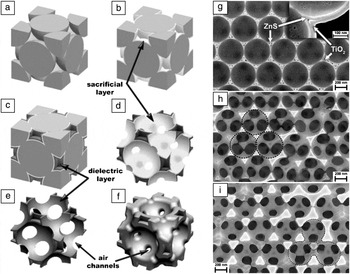
Rugge et al. demonstrated the inverse opal structures of tungsten nitride by ALD with bis(tert-butylimido)bis-(dimethyl-amido)tungsten(VI) and ammonia at 350ºC.Reference Rugge, Becker, Gordon and Tolbert40 A group from the Georgia Institute of Technology reported ZnS, GaP, TiO2, and composite inverse opals through the appropriate choice of ALD conditions for the characteristics of the template materials.Reference King, Neff, Summers, Park, Blomquist, Forsythe and Morton41, Reference Graugnard, Chawla, Lorang and Summers42 In order to get smooth shell surfaces, for example, King et al. employed low-temperature ALD processes of TiCl4 and water for the fabrication of inverted opal structures of TiO2 on opals that were prepared by self-assembling monodisperse polystyrene sub-micron beads.Reference King, Graugnard and Summers39 Graugnard et al. further developed this strategy for preparing non-close-packed photonic crystals,Reference Graugnard, King, Gaillot and Summers43–Reference King, Gaillot, Graugnard and Summers45 as shown in Figure 3. Although the diameter of individual beads is in the range of several hundred nanometers, the interstices within the opal structures have pore dimensions of less than 100 nm, indicating confined diffusion of the reactant molecules having a mean free path of several micrometers into the macropores. Indeed, these researchers found that by using typical ALD conditions, the infiltration of ALD-TiO2 and WN was significantly limited despite the presence of drying-induced microcracks in opals and its help for supplying precursors into the deep pores.Reference Rugge, Park, Gordon and Tolbert46 The detailed mechanisms still remain unexplored.
Left panel: Template-patterned sacrificial-layer atomic layer deposition (ALD) applied to create a non-close-packed (NCP) inverse opal. The original opal template in (a) is coated with a conformal thin film, resulting in the new template shown in (b). (c) A second ALD infiltration is performed in the remaining air volume. For conformal deposition techniques, maximum opal infiltration is achieved at ca. 86%, leaving small air pockets at the centers of the voids. (d) Removal of the original template creates a lattice of close-packed interconnected air spheres in a multilayered dielectric matrix. (e) A lattice of overlapping air spheres forms by removing the sacrificial buffer layer. Large air channels now connect the air spheres. (f) Backfilling with additional dielectric forms an NCP lattice of separated air spheres, which are connected by small air tubes. Right panel: Scanning electron microscopy images of ion-milled cross-sections showing the three main stages of NCP inverse-opal fabrication. (g) Stage 1: A two-layer infiltrated 450 nm SiO2 opal with a 15 nm sacrificial ZnS layer and 20 nm TiO2 infiltration. (h) Stage 2: The SiO2 spheres and the ZnS layer have been removed from the sample shown in (g), leaving a lattice of overlapping air spheres in a TiO2 backbone. (i) Stage 3: The sample has been backfilled with 20 nm of TiO2, creating an NCP inverse opal. The dotted circles denote the removal of SiO2 spheres. Scale bars correspond to 200 nm. Adapted with permission from Reference Reference Graugnard, King, Gaillot and Summers43. ©2006, Wiley InterScience.

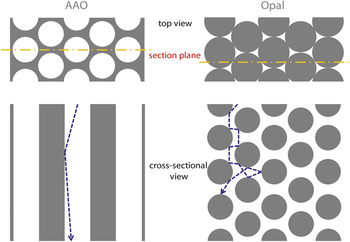
The conformability to the depth of porous materials can, of course, be improved by increasing the pulse time of the reactants. However, there is a practical limit for the deposition time because of the very nature of slow growth in ALD processes. Pioneering work by George and co-workers has proved that the exposure time of the reactants affects the coating depth through Monte Carlo simulations.Reference Elam, Routkevitch, Mardilovich and George18 A general understanding of ALD mechanisms for coating the inside of porous materials with complex diffusion paths is required. In principle, silica opals can be utilized in the formation of TiO2 inverse opals because of the chemical inertness of crystalline TiO2, such as the anatase polymorph, and thermally treated silica particles can form crack-free opal structures as a model template as well. By choosing two kinds of porous materials that have similar porosity but different pore connectivity, researchers observed that the dimensionality of pores is essential in determining the diffusion kinetics for the ALD coating, as schematically depicted in Figure 4. Indeed, they compared the infiltration behavior in (1) anodized aluminum oxides and (2) silica opals with the same porosity and found that the thickness profiles are different along the pore depth for the same ALD conditions. Three observations were made: (1) when 2D pore templates were employed, the uniformly coated zone from the sample surfaces was deeper than for 3D templates; (2) the thickness of the sample surfaces for 3D templates was much greater than that of the 2D templates; and (3) the overall thickness profiles were different from each other in depth. It is noteworthy that they used shower head-type reactors with a parallel relationship between the precursor injection angle and the pore axis (the exposure time of titanium tetraisopropoxide was 10 s for both templates). First, it should be pointed out that the dimensions of pores in the templates is in the regime much below the mean free path (λmfp) of the reactant molecules when considered simply from the ideal gas law.

Schematic illustration of top view and cross-sectional view of anodic aluminum oxide (AAO) and opal structures, showing similar porosity but different trajectories (dotted blue line) during diffusion. If we consider the mean free path (λmfp) of precursor molecules to be several micrometers, we can surmise the scattering events for both structures during diffusion in accordance with the geometry inside (see the text for more details). Gray areas indicate solid oxide for both structures; white represents empty spaces; and the dotted yellow line is the section plane for schematic depiction below.

R is the gas constant, T is the temperature, d is the molecular diameter, N A is Avogadro’s number, and P 0 is the pressure. Taking into account the diameter of commonly used precursors to be a few nanometers, λmfp was obtained to be around several microns.Reference Bae, Yoo, Kim, Lee, Kim, Sung and Shin15 A kinetic model was suggested for describing ALD into narrow holes, and the equations

for planar surfaces and

for a hole were obtained, where a is the area of the pore, P is the partial pressure of the precursor near the surface (Pascal = Nm‒2), t is the time (s), S is the saturation dose (J·t, J is the impingement flux), m is the molecular mass (kg), k is Boltzmann’s constant (1.38 × 10⁻²³ JK‒1), and T is the temperature (K).Reference Gordon, Hausmann, Kim and Shepard47 They estimated the dose values for complete coverage in Langmuir units and compared it to the experimental result for HfO2, resulting in good agreement. In order to get more generalized equations for describing ALD onto nanoporous materials, other parameters should additionally be considered. One of them should be the ballistic transport characteristic (see Figure 4) inside the pores, by which the monolayer coverage can be varied between 2D and 3D pore connectivities. In fact, the coverage is saturated as a function of the reaction probability of the reactants, varying with different moiety, delivery method, temperature, base pressure, and surface state/charge. Evidence of this effect is the increased thickness near the opal surfaces when compared to that in AAO, which was also observed previously in WN ALD into opal structures.Reference Rugge, Becker, Gordon and Tolbert40 Due to the improved back scattering near the surfaces of the opal scaffold, the near surface adsorption of the precursor per half-ALD cycle can be enhanced, in inverse proportion to  as in a typical random-walk diffusion model. (Data not shown, D is the distance from the surfaces.) In contrast, the uniform zone is preserved at a certain depth in the case of ALD in cylindrical pores as a result of the ballistic transport of precursors, as observed by the authors and by others.Reference Perez, Robertson, Banerjee, Henn-Lecordier, Son, Lee and Rubloff48 Random-walk-like diffusion was also observed for ALD coatings on nanoparticulate, random aggregates by analyzing the depth profile indirectly by Rutherford backscattering spectrometry; researchers at Lawrence Livermore National Laboratory and Harvard University found that the thickness of the deposited material rapidly decreased along the depth.Reference Kucheyev, Biener, Baumann, Wang, Hamza, Li, Lee and Gordon49
Structure of 3D ALD layers and implications for applications
Recent publications of ALD-nanomaterials such as on wide-gap oxide NTs highlight their advantage as efficient charge collectors (e.g., dye-sensitized solar cells and lithium-ion secondary battery applications), as mentioned earlier. While the specific surface area is equivalent to the nanoparticulate counterparts, the direct pathway for transporting electrical charges is thought to be beneficial with respect to the collection efficacy. Owing to the confined materials geometry at the nanoscale, however, the resulting material systems would be unique and different from (sintered) aggregates of nanoparticles with respect to the electrical resistivity. A paradox should arise from the presence of ALD-nanomaterials that are single crystal-like, yet macroporous. For example, researchers observed that thermally treated amorphous TiO2 NTs within physical confinement resulted in nearly single crystal-like anatase TiO2 NTs. It is noted that because of the use of porous templates, these materials are porous materials, but the electrical resistivity is quite far from that of nanoparticulate porous materials, approaching the single crystalline bulk values. Similar results of crystalline domains with significantly larger grains than the layer thickness were observed when convex templates were employed.Reference Bae, Yoo, Kim, Lee, Kim, Sung and Shin15, Reference Yang, Zakharov, Moutanabbir, Scheerschmidt, Wu, Gösele, Bachmann and Nielsch50
Such boosted crystal growth in confined geometry can lead to unexpected surface reconstruction of the resulting structures. The suppressed amount of defects is surely positive from the view of electrical conductivity, but other applications often require high-symmetry facets or rough surfaces of nanomaterials for improved surface reactions. It is noted that a surface reconstruction was difficult to detect in typical TEM observations of suspended NTs, since the surface reconstruction took place on the inner surfaces of the NTs.Reference Bae, Yoo, Kim, Lee, Kim, Sung and Shin15, Reference Shin, Jeong, Lee, Sung and Kim16 Therefore, we note that there is a tradeoff between electrical resistivity and surface roughness in the performance of ALD nanomaterials.Reference Könenkamp51, Reference Forro, Chauvet, Emin, Zuppiroli, Berger and Lévy91
Conformal coating of semiconductor nanowires and nanotubes
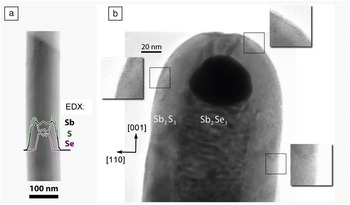
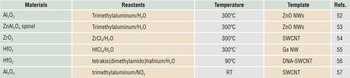
In addition to the aforementioned negative templating (based on the scaffold used, positive templating refers to the use of one-dimensional nanostructures such as NWs, and negative templating involves the use of porous membranes such as AAO),Reference Bae, Yoo, Kim, Lee, Kim, Sung and Shin15 the positive template approach is also fascinating, for the confined diffusion issues can be ruled out, and the functionality of the resulting structures can be maximized with existing 1D templates such as NWs and nanorods. For example, ALD can serve as a means of tailoring the surface electronic, mechanical, and photonic structures of 1D semiconductor devices with large surface area by coating their surfaces. Consequently, the desired electrical, phonon, and ionic transport properties of the devices could be controlled. With regard to the synthesis and characterization of nanowires themselves, readers can find a comprehensive review in the literature.Reference Xia, Yang, Sun, Wu, Mayers, Gates, Yin, Kim and Yan52 A research group demonstrated the formation of Al2O3 nanotubes by coating ALD Al2O3 on ZnO nanowires, followed by wet chemical etching of the core wires.Reference Hwang, Min, Lee, Keem, Cho, Sung, Lee and Kim53 Another group found that the ZnO–Al2O3 core–shell nanowires can be transformed into single crystalline ZnAl2O4 spinel NTs through the Kirkendall effect (due to the difference in diffusion rates between two components in a diffusion couple) at an elevated temperature.Reference Fan, Knez, Scholz, Nielsch, Pippel, Hesse, Zacharias and Gösele54 As will be discussed later, templating carbon nanotubes (CNTs) with high-κ dielectic materials, where κ is the dielectric constant, provides a promising route to high-performance electronic devices. The group of Dai at Stanford University has shown ALD of ZrO2 for fabricating single-wall CNT field-effect transistors (FETs) and ALD of HfO2 on Ge NW FETs.Reference Javey, Kim, Brink, Wang, Ural, Guo, McIntyre, McEuen, Lundstrom and Dai55, Reference Wang, Wang, Javey, Tu, Dai, Kim, McIntyre, Krishnamohan and Saraswat56 Due to the lack of functional groups on CNT surfaces, however, an ultrathin gate-oxide of HfO2 on CNTs was later realized by introducing covalent chemistry with DNA on CNTs.Reference Lu, Bangsaruntip, Wang, Zhang, Nishi and Dai57 It was shown that by noncovalent functionalization of CNTs with NO2, ALD Al2O3 can be deposited conformally on SWCNTs.Reference Farmer and Gordon58 In the ALD coating of Sb2S3 on the surfaces of single crystalline Sb2Se3 NWs, two groups found that the resulting conformal thin Sb2S3 layers, grown at a 65–90°C deposition temperature, have an epitaxial relationship with an Sb2Se3 wire presenting the high-energy c facet at its extremity, where c is the crystallographic axis parallel to the long axis of the wire (Figure 5).Reference Yang, Zakharov, Moutanabbir, Scheerschmidt, Wu, Gösele, Bachmann and Nielsch50 Selected examples of ALD on NWs and NTs are presented in Table III.
Conformal heteroepitaxial deposition of Sb2S3 at 90°C onto Sb2Se3 wires. (a) Energy dispersion x-ray (EDX) line scan across a core shell wire (pictured underneath the graph); the vertical axis displays the signal intensities recorded for the elements Se, Sb, and S in purple, black, and green, respectively. (b) High-resolution transmission electron microscopy image of the extremity of a wire, displaying a dark Au particle (a catalyst used for Sb2Se3 nanowalls) and identifying the crystallographic c-axis parallel to the long axis of the wire. Adapted with permission from Reference Reference Farmer and Gordon58. ©2010, American Chemical Society.

Selected examples of atomic layer deposition on nanowires/nanotubes.

Note: NW, nanowire; SWCNT, single-wall carbon nanotube.
Nanoscale site-selective ALD on patterned surfaces
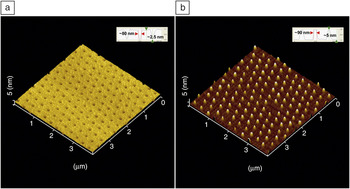
When the self-limiting ALD reaction meets the appropriate surface chemistry, ALD allows for the direct formation of surface patterns, minimizing additional lithographic process steps. On the nanometer scale, the cost-effective, unconventional, and direct patterning of metals, semiconductors, and insulating oxides is highly desirable in applications for nanoelectronics, nanophotonics, nanoplasmonics, and biomolecular recognition/detection. Combined with patterns of self-assembled organic monolayers (SAMs) having ALD-inert or -active functional groups, in particular, “site-selective” ALD has great potential for the facile, one-step fabrication of desired nanostructures. Despite this promising strategy, nanoscale selective ALD with sub-100 nm features is quite challenging, and only limited numbers of studies have successfully demonstrated this to date, indicative of many open opportunities in this research field. But (sub)micrometer patterns by selective ALD have been demonstrated on patterned organic layers, which were prepared by either conventional photolithography or microcontact printing or decal transfer microlithography.Reference Chen and Bent59–Reference Liu, Mao, Lan, Banatao, Forse, Lu, Blom, Yeates, Dunn and Chang62 Site-specific ALD of TiO2 was reported at the sub-100 nm length scale in the chemical patterns of octadecyltrichlorosilane (OTS)-SAMs on SiO2/Si substrates (Figure 6).Reference Bae, Shin, Moon and Sung63 The authors demonstrated a simple, yet robust method for nanopatterning of silane SAMs: The physical contact area as well as capillary menisci between 2D crystals of submicron colloids and planar substrates are patterned in the growth of OTS-SAMs, producing periodic hole patterns in OTS-SAMs (~50 nm in diameter) on SiO2 surfaces surrounded by hydrophobic OTS-SAMs; upon ALD of TiO2, nanoscale dot arrays were successfully obtained.Reference Bae, Shin, Moon and Sung63 SAMs prepared at two-phase contact lines would be an ideal choice when making nanometric, high-resolution surface patterns by ALD due to the high edge resolution.Reference Bae, Kim and Shin64 Note that Li et al. argued the possibility of easy detachment of silica colloids during chemical reactions in solution.Reference Li and Garno65 However, the solid bridges that formed between the two oxides are strong enough to hold them to each other in the range of hundreds of MPa up to ~GPa per colloid. Such strong interactions were later further proved and employed in the fabrication of colloidal superstructures using a sol-gel reaction and in the direct transfer of nanoscale Al stripes on other substrates.Reference Bae, Moon, Shin, Kim and Sung66
Three-dimensional reconstruction of atomic force microscopy (AFM) topographical images of (a) patterns in octadecyltrichlorosilane self-assembled monolayers 79 ± 7 nm in diameter, and (b) TiO2 nanodots of 85 ± 16 nm in diameter by atomic layer deposition, using the surface patterns as shown in panel (a), when 350 nm diameter silica particles were used. The insets show the corresponding AFM line profiles. Adapted with permission from Reference Reference Liu, Mao, Lan, Banatao, Forse, Lu, Blom, Yeates, Dunn and Chang62. ©2006, American Chemical Society.

As the resulting structures by selective ALD are smaller, the pattern edges of SAMs (i.e., patterned/unpatterned interfaces) are crucial for the nanoscale selectivity of desired ALD reactions. Ras et al. pointed out that the resulting nanoscale features might not be confined during ALD growth within the original chemical patterns.Reference Ras, Sahramo, Malm, Raula and Karppinen67 Analyzing the data from Reference Reference Bae, Shin, Moon and Sung63, they judged that site-specific ALD does not operate above certain thicknesses, and alternatively demonstrated area-selective growth by ALD on physically blocked templates (i.e., cicada wings having hydrophobic pores inside). However, the argument that the lateral growth (10–20 nm) could be larger than the total ALD thickness (~5 nm) does not make sense. From a simple consideration on equilibrium surface energy of the system, the lateral growth should at least be comparable to the growth thickness.Reference Bae, Moon, Shin, Kim and Sung66 Therefore, other mechanisms would be involved in the resulted lateral expansion, and studies on the structures of SAMs at high-resolution pattern edges are needed.
The other interesting approach is selective ALD on surfaces of nano-objects and has never been explored before, to the best of our knowledge. An example of this would be to construct colloidal molecules. Due to the thickness of SAMs with a few nanometers, in principle, the surfaces of nanoscale objects such as colloidal particles could be patterned with a desired combination of SAMs, and the selective decoration could be achieved by selective ALD. OTS-SAMs can be coated on submicron silica beads with exception at the coordination surfaces of spheres, and by site-selective sol-gel growth, the idea was proven in the preparation of silica/titania colloidal superlatticesReference Bae, Moon, Shin, Kim and Sung66 and later silica/silica molecules by others.Reference Wang, Xia, Li, Ravaine and Zhao68 While the number of sol-gel chemistries is limited to the synthesis of monodisperse colloids, a number of ALD chemistries should be powerful means in designing and realizing colloidal molecules.Reference Glotzer and Solomon69–Reference Li, Josephson and Stein71 The authors have tried selective ALD onto silica spheres possessing OTS-SAMs patterns on their surfaces and have shown that this strategy can be applied for the synthesis of colloidal molecules with an arbitrary combination of sub-micron atoms possessing the desired coordination.
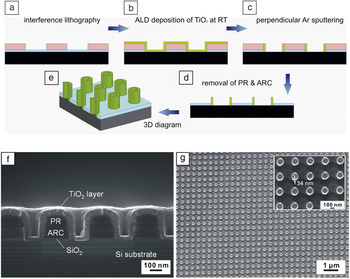
Ji et al. demonstrated a promising method for the parallel fabrication of ideally ordered nano-ring arrays with different ring shapes and ALD-controlled thickness on large areas, as shown in Figure 7.Reference Ji72 The approach is based on templates with periodic polymer structures generated by laser interference lithography. By depositing TiO2 layers on the relief of the substrate with ALD at room temperature, and by subsequently removing the unwanted parts of the TiO2 layer by anisotropic plasma etching, ordered ring arrays were obtained. In this method, the physical dimensions of the resulting features could be tailored with the precision of the unit cell thickness down to sub-5 nm feature size beyond the optical diffraction limit from lithographic techniques themselves.
Schematic illustration of the fabrication of nano-ring arrays by templated atomic layer deposition (ALD) and Ar+ bombardment: (a) the photoresist (PR) and anti-reflection coating (ARC) layers by laser interference lithography; (b) etching of the underlined SiO2 layer by reactive ion etching with CHF3 gas, and deposition of a conformal TiO2 layer on the substrate relief by ALD; (c) removal of the unwanted parts of the TiO2 layer by Ar+ bombardment; (d) removal of the PR and ARC residuals by O2 plasma; and (e) 3D display of panel (d). Scanning electron microscopy images of (f) the cross-section view of the TiO2 layer coated substrate relief and (g) top view of the freestanding TiO2 nano-ring arrays; the enlarged view is shown as an inset. The inner diameter of the rings is ~119 nm, and the thickness is 34 nm. Black, desired substrates; blue, SiO2 layer; green, TiO2 by ALD; pink, PR/ARC stack in panels (a–e).

Device development
In micro/nanoelectronics, ALD has received a great deal of attention for scaling of high-performance transistors, due to the capability of conformal coating of high-κ dielectrics. See Reference Reference Ribes, Mitard, Denais, Bruyere, Monsieur, Parthasarathy, Vincent and Ghibaudo73 for a review dealing with conventional Hf-based high-κ dielectrics. In particular, ALD applications in Si-based as well as CNT FETs are described in recent reviews.Reference Kim and McIntyre74–Reference Kim, Lee and Maeng76 Historically, the conventional gate oxide (i.e., SiO2) is already at the thickness limit of two unit cells because of the non-scalabilities of the interface, trap capture cross-section, and leakage current in scaling complementary metal-oxide semiconductor devices. Therefore, introducing high-κ dielectric thin films has been suggested to solve this issue, and ALD is the perfect choice for fabricating these.
Combining bottom-up fabrication of high-performance nanowire channels, ALD of ZrO2 and HfO2, has provided exceptional characteristics in the resulting device performance. In p-type CNT transistors, small subthreshold swings of SS ~70 mV per decade (defined as the voltage required to increase or reduce the drain current by one decade and indicative of the corresponding small gate swing) were demonstrated.Reference Javey, Kim, Brink, Wang, Ural, Guo, McIntyre, McEuen, Lundstrom and Dai55SS ~300 mV per decade using ALD of HfO2 as a gate oxide in Ge nanowire transistors was obtained, indicating that the surface states of nano building blocks themselves are of importance in addition to the quality of ALD oxides.Reference Wang, Wang, Javey, Tu, Dai, Kim, McIntyre, Krishnamohan and Saraswat56 By DNA-assisted covalent functionalization of HfO2 by ALD on single wall CNTs, they also achieved a record SS ~60 mV per decade, approaching the room-temperature theoretical limit for FETs.Reference Lu, Bangsaruntip, Wang, Zhang, Nishi and Dai57
The capability of low-temperature deposition by ALD also opens a new venue for high-performance organic-semiconductor thin-film transistor (TFT) devices, as well as flexible devices on polymeric substrates. ZnO active layers deposited by ALD at 120ºC can be applied for transparent, flexible TFT devices when combined with a cross-linked poly-vinyl-alcohol (c-PVA) as a polymer gate insulator on poly-ethylene (PET) substrates.Reference Kim, Fuentes-Hernandez, Hwang, Potscavage, Cheun and Kippelen77 By using low-temperature ALD of Al2O3 as a gate oxide, organic–inorganic hybrid complementary inverters were demonstrated on vertically stacked p-channel pentacene and n-channel amorphous indium gallium zinc oxide (a-IGZO TFT).Reference Choi, Hyung, Yang, Koo, Kim, Kwon and Cho78 Amorphous oxide semiconductors (AOSs) are one of the promising active materials for low-temperature processable flexible devices in that their electron mobility is comparable with those of covalent semiconductors.Reference Nomura, Ohta, Takagi, Kamiya, Hirano and Hosono79 While this a-IGZO AOS suffers from intrinsic instabilities under exposure to ambient atmosphere, it was demonstrated that low-temperature ALD of Al2O3 can be used in a-IGZO AOS TFTs as a passivation layer.Reference Cho, Yang, Shin, Byun, Ryu, Lee, Hwang and Chu80
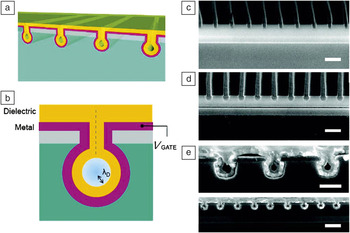
Another interesting approach is to fine-tune the diameter of nanofluidic channels for application in ionic diodes or ionic field-effect transistors (IFETs). A research group showed that using lithographically patterned trench arrays, ALD can be applied for tuning the diameter of nanofluidic channels in the regime of sub-10 nm by so-called self-healing deposition.Reference Nam, Lee, Lee, Lee, Rossnagel and Kim81 Moreover, they demonstrated operation of IFETs by depositing metallic and subsequent oxide ALD layers such as Ru/TiN and TiO2/Al2O3 (Figure 8).
The concept of all around gating (AAG) ionic field-effect transistor (IFET) (gray, amorphous silicon; cyan, SiO2; yellow, atomic layer deposition [ALD] dielectric film; purple, ALD metal film). (a) Schematic of nanochannel AAG-IFET. (b) The ionic strength within the nanochannel can be controlled by an electric gate bias (V GATE), when the channel size becomes as small as the Debye screening length (λD). Cross-sectional scanning electron microscopy images of (c) trench, (d) pipe, and (e) core-shell nanochannels. The nanochannels are surrounded by Al2O3 dielectric/Ru metal. Scale bars are (c, d) 250 nm, (e) 100 nm (top), and 250 nm (bottom). Adapted with permission from Reference Reference Cho, Yang, Shin, Byun, Ryu, Lee, Hwang and Chu80. ©2010, American Chemical Society.

The ability of uniform coating transparent oxides by ALD is also promising for photonic applications by mixing the appropriate optical materials with air at the nanoscale grating interfaces. By depositing conformal ALD AlSiOx layers onto Al optical gratings with a 150 nm period, half-pitch gratings of ~38 nm can be demonstrated to double the spatial frequency, as a means to cost-effective, large-area fabrication of optical grids.Reference Liu, Deng, Sciortino, Buonanno, Walters, Varghese, Bacon, Chen, O’Brien and Wang82 Sensitive 2D subwavelength nanostructures in polymeric materials can be successfully coated with inorganic materials by ALD to improve their optical functionality. The ALD coating proved to be essential to produce high-quality guided mode resonance filters, showing narrow transmittance/reflectance peaks and high sideband transmittance (~92%) in the UV–vis range. They also observed that the reflectance peak position can be easily tuned in a broad wavelength range (>150 nm) through rotation of the sample, meeting the demand for ultra-compact, portable, miniaturized optical equipment.Reference Szeghalmi, Helgert, Brunner, Heyroth, Gösele and Knez83
ALD is being used in many industrial applications, and we believe that ALD has huge potential in the near future as a result of the current efforts in developing rapid and massively parallel production techniques. For example, ALD passivation coating of optically transparent oxides can enhance the efficiency of solid-state solar cells such as crystalline Si cells by decreasing the surface recombination so that they prolong the charge-carrier lifetime; surface protection by ALD also provides silver jewelry with anti-tarnish coatings by depositing Al2O3 or TiO2 on the silver-based jewelry products and by avoiding sulfide formation on their surfaces (i.e., color changes losing the reflectivity of the surface).84
Concluding remarks and future directions
Porous template-assisted atomic layer deposition (ALD) is useful for many energy applications because of the diversity of ALD chemistry and the porous but continuous structure, facilitating surface-limited reactions and efficient charge collection. For example, the use of inverse opal structures as lithium-ion secondary batteries with high-rate capability (90% charged in 2 min) was recently demonstrated.Reference Zhang, Yu and Braun85 ALD nanomaterials are being applied for this line of research and application, maximizing the rate capability and areal density for portable, ultrafast chargeable electronic devices.
Another emerging area is ALD coatings onto 3D device architectures involving nanowire/tube arrays. Although high-performance individual devices from single nanowires have been achieved, they are subjected to high-density integration, thus yielding to new types of vertically aligned device structures.Reference Schmidt, Riel, Senz, Karg, Riess and Gösele86–Reference Ng, Han, Yamada, Nguyen, Chen and Meyyappan88 ALD should provide a solution for the fabrication of devices having complex, high-aspect-ratio surfaces by coating active and/or passive materials such as semiconducting, insulating, and metallic layers. Finally, site-selective ALD could be a direct means for preparing field-effect transistors and molecular transistors when combined with other patterning methods of self-assembled organic monolayers.Reference Park, Doub, Gougousi and Parsons89, Reference Seo, Lee, Sung-Suh and Sung90
Acknowledgments
C.B. acknowledges the Alexander von Humboldt Foundation for a postdoctoral fellowship (3.2-KOR/1138516 STP) and would like to thank William Töllner for helpful discussions. H.S. acknowledges financial support from the NRL program (2007–0057024), the Nano R&D program (2009–0082717), and CMPS (R11–2005–048–00000–0) of Korean NRF.