
I. INTRODUCTION
Simultaneous ultrasonic vibration can lead to a significant reduction in forming stress during metal plastic deformation. Reference Brehl and Dow1,Reference Han2 Over the past 60 years, considerable research has been devoted in investigating this phenomenon in micro-forming, which includes extrusion, drawing, and casting. Reference Wang, Liu, Guo, Shan and Zhang3–Reference Bagherzadeh, Abrinia, Liu and Han5 Numerous researchers observed that acoustic softening occurs over a wide frequency range, Reference Kirchner, Kromp, Prinz and Trimmel6,Reference Rusinko7 and the softening effect becomes more effective with increase in the ultrasonic power density. Reference Hung and Lin8–Reference Liu, Suslov, Han, Hua and Xu11 Although the ultrasonic frequency can reach 45 kHz or higher, it still difficult to be applied in the practical industrial field due to its poor exciting force. In recent years, with the development of servo presses Reference Osakada, Mori, Altan and Groche12,Reference Matsumoto, Sawa, Utsunomiya and Osakada13 and hydraulic vibration technology, Reference Li and Tso14,Reference Meng, Zhao, Li and Liu15 low-frequency vibration can now be superimposed during plastic forming, thereby markedly benefiting force reduction and surface quality improvement. Compared with ultrasonic vibration, low-frequency vibration can generate a higher exciting force, which is more appropriate to be used in industrial fields, where we need a large forming force.
During low-frequency vibration-assisted forming, oscillation is applied to the upper or bottom die. Thus, the workpiece and dies can contact and separate multiple times during a single forming procedure. Numerous researchers reported their findings in this new research field. Maeno et al. Reference Maeno, Osakada and Mori16 developed a pulsated compression process by using a servo press. Owing to pulsation, the lubrication condition of the contact area between the plate and dies improved and the compressive load markedly decreased. Matsumoto et al. Reference Matsumoto, Jeon and Utsunomiya17 proposed a method for forming deep holes with a retreat and an advance pulse ram motion on a servo press. Owing to oscillation, sufficient lubricant was supplied to the deformed zone and high shape-accuracy holes were produced. Groche et al. Reference Groche and Heß18 presented an oscillating ram movement to reduce friction during cold forging of spline gears, and attributed rebuilding of lubrication during back stroke was the main cause of forging force decrease. Wang et al. Reference Wang, Zhan, Hong, Bao and Yang19 introduced an electric-hydraulic chattering experimental setup for cold extrusion. Results showed that with chattering in the bottom die, the deformation resistance decreased, and the material flow easily proceeded. Several similar studies on the sheet metal drawing were reported. Kriechenbauer et al. Reference Kriechenbauer, Mauermann and Muller20 described cushion-ram pulsation, a new technology for deep drawing. Low-frequency vibrations were superimposed between 10 and 50 Hz at the servo press ram and cushion. This method increased the drawing ratio and prevented winking. The above studies showed that similar to ultrasonic-assisted micro-forming, superimposition of low-frequency vibration in the shaping process can reduce the forming force and improve the drawing ratio. However, all the above work concentrated on forming methods and seldom investigated the mechanism behind low-frequency-assisted forming techniques. Most scholars assume that load reduction in vibration-assisted deformation is due to changes in the friction condition in the deformation zone. Reference Maeno, Osakada and Mori16,Reference Maeno, Mori and Hori21,Reference Kumar and Hutchings22 However, the influence of vibration on the material structure is ignored. Effects of ultrasound on grain size, dislocation density, and flow stress are evident in ultrasound-assisted micro-forming. Therefore, new studies should investigate the mechanisms of low-frequency vibration, affecting the forming stress and microstructure.
In this study, a specialized device for vibration-assisted tensile deformation was developed to investigate the effects of vibration on material properties. Both vibration softening and residual softening effects were obtained in vibration-assisted tension tests with low-carbon steel. According to the dislocation dynamic theory, probable movement of dislocations under a vibration field was provided to explain this phenomenon. Electron backscatter diffraction (EBSD) results showed that the presented explanation coincided with the actual findings. The effect of amplitude of vibration on the material property was also discussed in detail.
II. MATERIALS AND EXPERIMENTAL METHODS
Low-carbon steel, one of the most common metals, is widely used in automobile manufacturing because of its good formability and economy. The material used in this investigation is a commercial steel plate DC04 with a nominal composition of 0.08C–0.4Mn–0.02Al (wt%) and 2 mm thickness. According to the tension testing standard GBT228-2002, the plate was machined into four tensile samples in the rolling direction (RD) of the steel plate. The original gauge length and width of sample measured 25 and 10 mm, respectively. Cut surfaces were then polished by SiC paper to a 2000 grit finish to remove burrs and scratches.
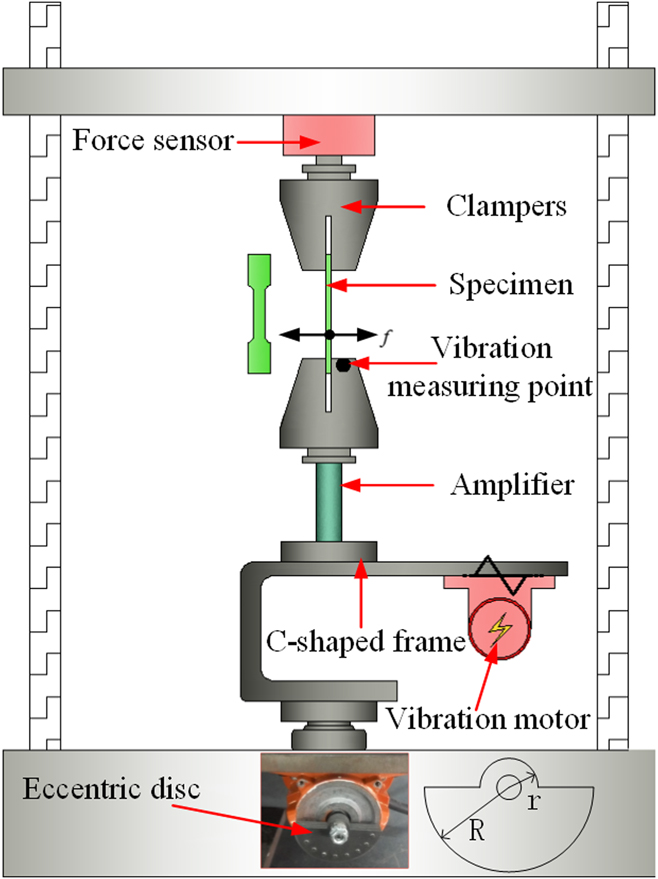
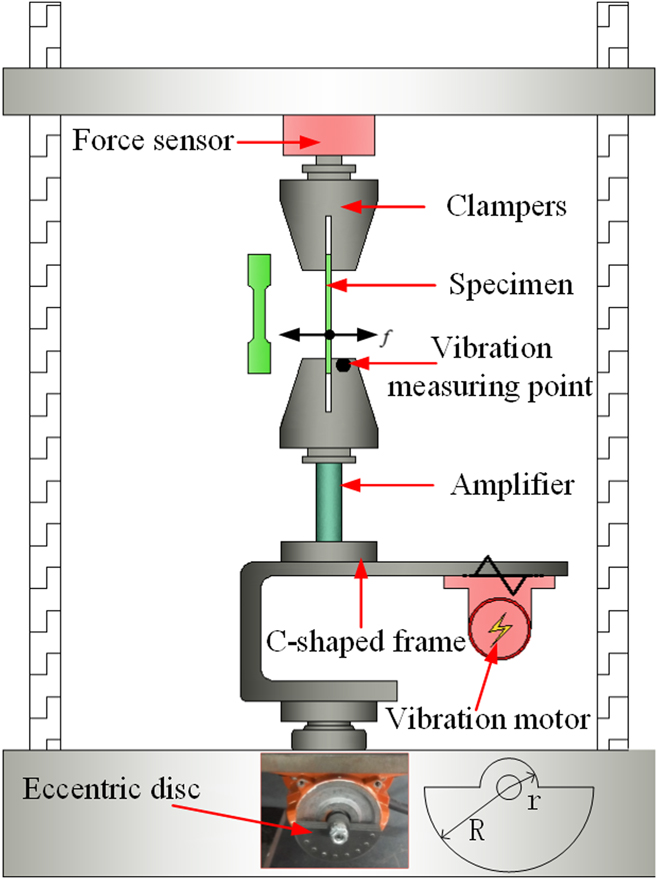
Figure 1 shows the experimental setup used for low-frequency vibration-assisted tensile deformation. The setup consisted of three components: a vibration motor, an amplifier, and a C-shaped frame made of 60Si2Mn. A mechanical vibration unit was assembled on a universal testing machine (Instron 5960, Instron Corporation, Norwood, Massachusetts). The vibration motor was attached on the C-shape frame and equipped with several eccentric discs. With the vibration motor operating at different speeds, the C-shaped frame can vibrate with different amplitudes. The Instron test machine supplied a tensile force at the top of specimen, whereas the C-shaped frame provided a low-frequency vibration to the bottom. The amplifier amplified the vibration amplitude in the transversal direction (TD). All specific dimensions of the vibration device were acquired from the finite element modal analysis. A force sensor cell connecting the Instron actuator and specimen was used to record the vertical loading profile. Apart from the testing system, a contact vibrometer (UT315, minimum 1 μm, Uni-Trend Technology Limited, Dongguan, China) was used to measure the steady-state vibration amplitude in TD and longitudinal directions at the top of the clamper. The sampling frequency of the vibrometer reached 1000 Hz, which was substantially higher than the system vibration frequency, which is 50 Hz.
Experimental setup for low-frequency vibraiton assisted tensile test.
Vibration amplitude is related to the centrifugal force, which is affected by motor speed and eccentric mass. Centrifugal force can be expressed as follows:
 $$F = {2 \over 3}\left( {{R^3} - {r^3}} \right)m{\omega ^2}n\left[ {\cos \omega t\quad \sin \omega t} \right]\left[ {\matrix{ i \cr j \cr} } \right]\quad ,$$
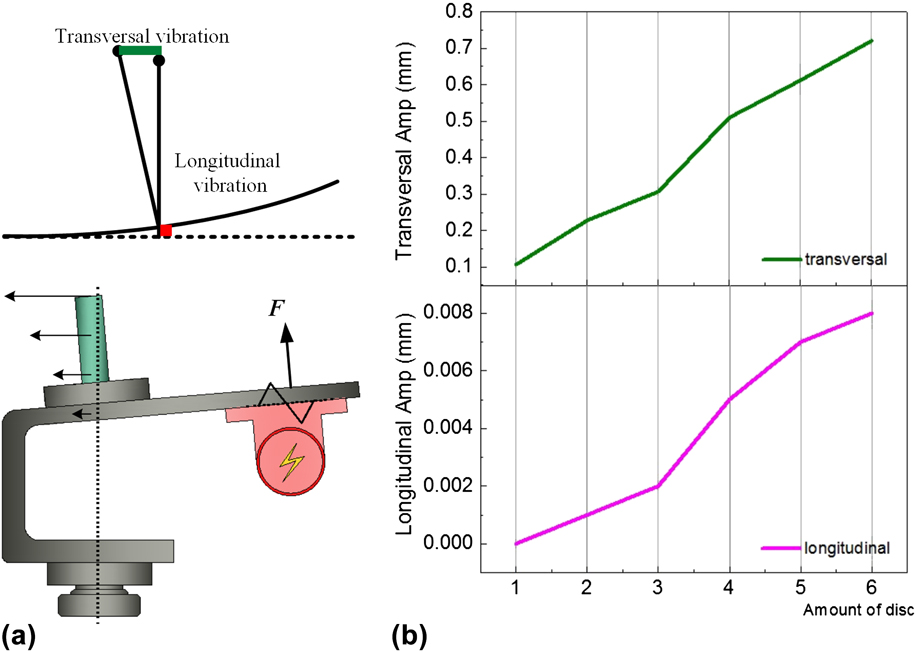
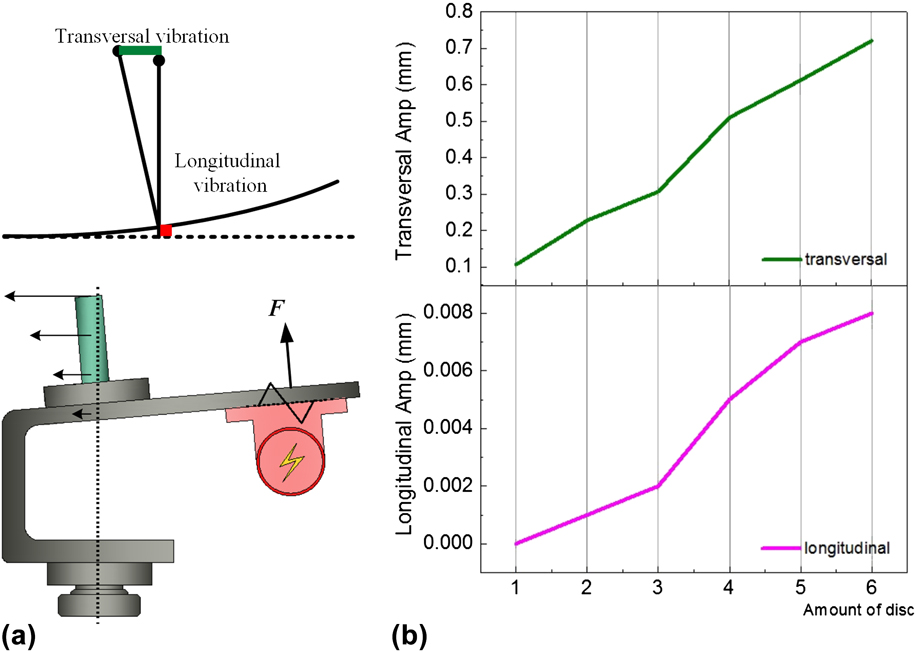
where m corresponds to the mass of each disc, n represents the disc amount, ω refers to rotation speed of vibration motor, t indicates time, and R, r denote radii of the disc. i and j determine the exciting force directions. Equation (1) shows that the excitation force is proportional to the vibration frequency. To obtain a large exciting force, a vibration motor was operated at a top speed of 3000 r/min. Therefore, system vibration frequency was fixed at 50 Hz. Figure 2(b) presents results of the no-load vibration test. Both transversal and longitudinal vibration amplitudes were proportional to the disc amount. Figure 2(a) illustrates the role of the amplifier: when the exciting force reaches its maximum in the vertical direction, the vibration amplitude in TD reaches the maximum. The transversal vibration amplitude was markedly higher than the longitudinal value because of the amplifier. Given the large variation in between transversal and longitudinal amplitude, longitudinal vibration was ignored in this study. To investigate effects of different vibration amplitudes on material properties, two different amplitudes, 0.107 and 0.310 mm, generated by one disc and three discs, respectively, were applied on the tension test.
(a) Illustration for amplitude in transversal and longitudianal direction and (b) Amplitude response in transversal and longitudinal direction.
As shown in Fig. 1, vibration-assisted tensile deformation was carried out in the experimental setup. Stain rate totaled 0.005 s−1. When strain reached 0.05, the vibration motor started and operated for 2 s. Four experimental conditions were considered: (1) no deformation, (2) deformed without vibration (0.06 strain), (3) deformed with mild vibration (0.06 strain, 0.107 mm amplitude), and (4) deformed with violent vibration (0.06 strain, 0.310 mm amplitude) (samples 1, 2, 3, and 4, respectively). Each case was tested twice. The first experiment recorded the stress–strain curve; the second experiment stopped at a strain of 0.06, and samples were prepared for internal structure observation.
After the tensile test, transverse cross sections of samples were prepared for optical microscopy and EBSD observations. First, sections were polished with sand paper to 2000 grit finish and etched with a 4% nitric acid alcohol solution to reveal their microstructure. Then, a metallographical observation was conducted using a Nikon LV150 microscope (Nikon Corporation, Tokyo, Japan). For the EBSD observation, sections were subjected to vibratory polishing for 6 h to remove strained layers. Sections were examined using a tungsten scanning electron microscope equipped with the EBSD system. EBSD scans were obtained with 70° samples by applying an accelerating voltage of 20 kV and a working distance of 13 mm. All samples were scanned in a square grid measuring 175 × 175 µm with a step size of 0.45 µm. Orientation maps and statistical information were postprocessed using AZtecHKL software (Oxford Instruments, Abingdon, United Kingdom).
III. RESULTS AND DISCUSSION
A. Microstructure characterization
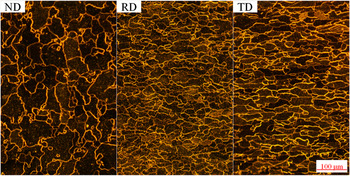
Figure 3 shows the initial microstructure of DC04 steel. It is a typical rolling metal structure. Grains were flattened into strips during the rolling process. Grains in the normal direction (ND) and TD are bigger than those in the RD. Although the steel sheet was annealed during rolling for several times, a large number of small grains still existed. Small grains were generated during the final rolling and shaping procedure. The tension test showed that the average yield stress at 0.2% offset was 220 MPa, and the ultimate strength was 298 MPa. The Young’s modulus was 210 GPa, and the elongation was 45%.
Original microstructure of DC04 in ND, RD, and TD.

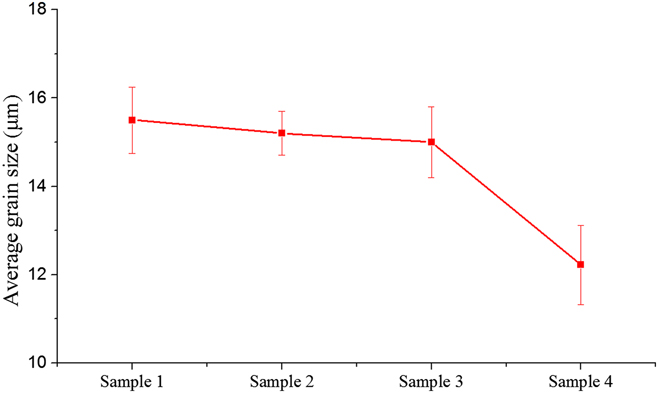
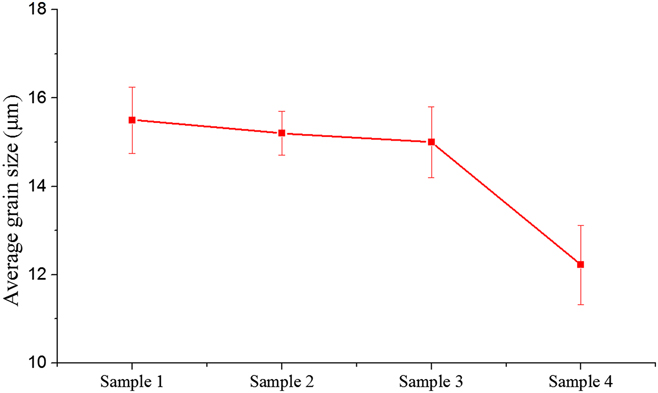
The average grain size was calculated from the EBSD data by software AZtecHKL. Figure 4 shows equivalent diameters of grains for samples 1–4. The nondeformed material sample 1 possessed the largest grain size. After uniaxial tension, a grain size of samples 2–4 both presented a downward trend. Compared with sample 2, sample 3 was subjected to mild vibration treatment, and the grain size did not markedly change. Under violent vibration treatment, sample 4 exhibited apparent grain refinement. The grain equivalent diameter decreased by 21%, indicating that a larger vibration can affect the internal grain size of the material.
Average grain size for sample 1–4.
B. Effects of low-frequency vibration on strain and stress
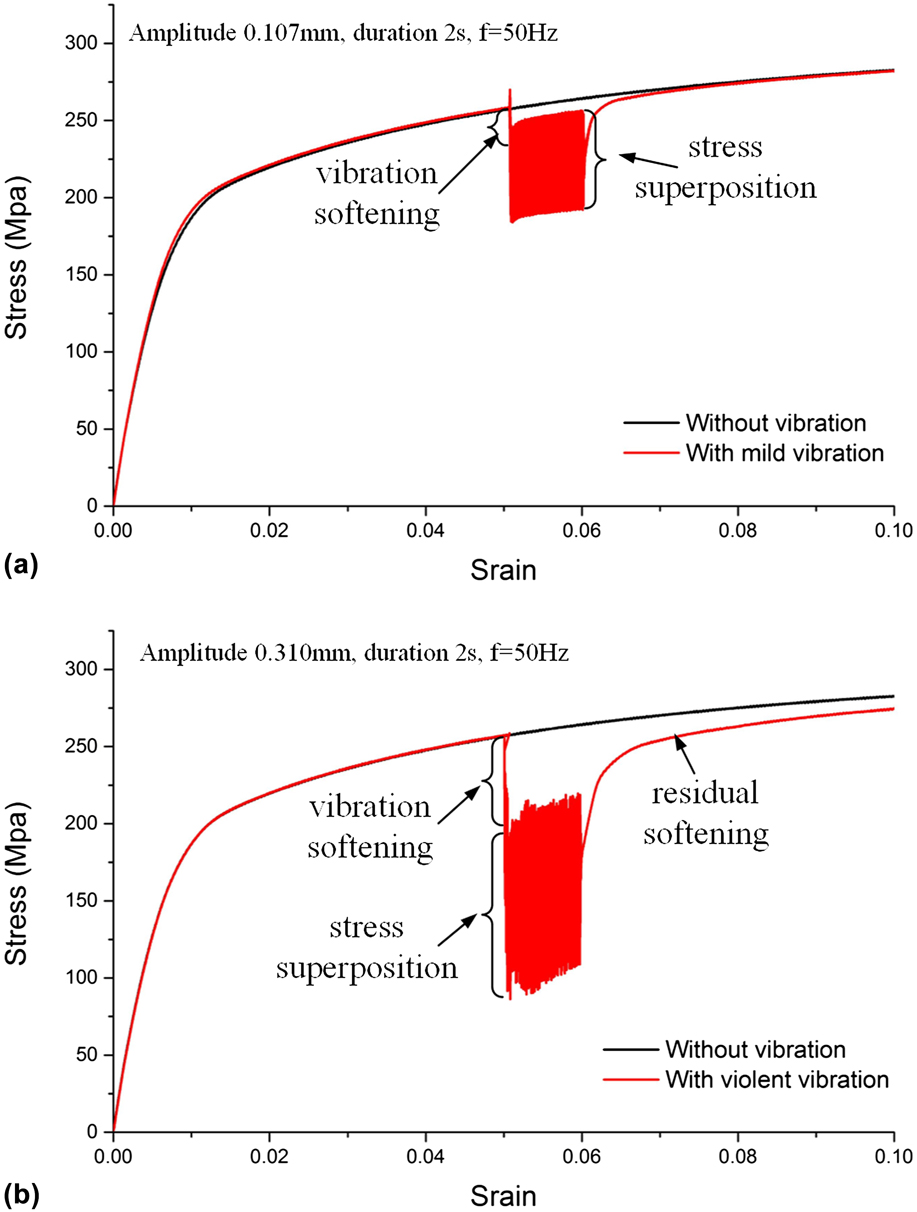
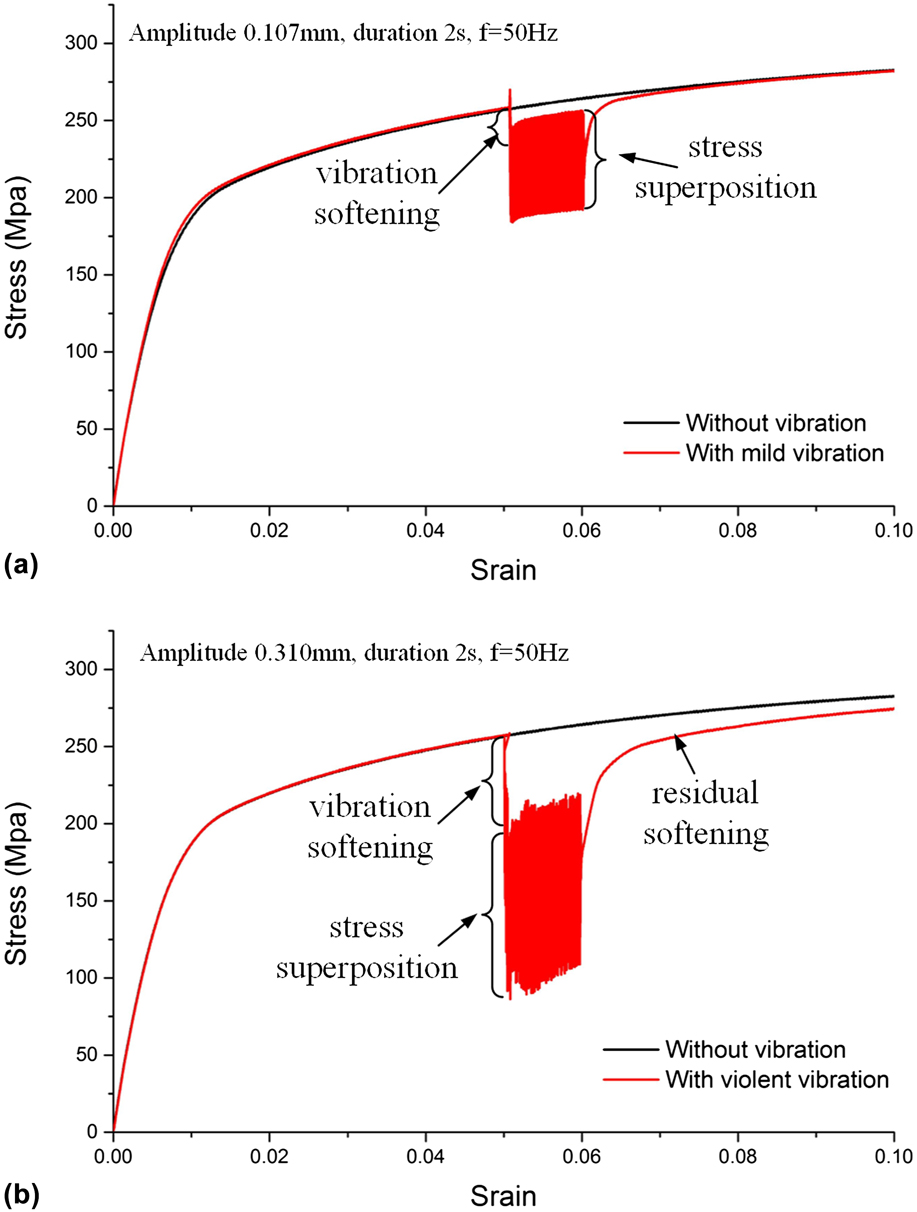
A tensile test was conducted in the setup shown in Fig. 2. Samples 2, 3, and 4 were first elongated to a strain of 5%. Afterward, low-frequency vibrations of different magnitudes, 0.107 and 0.310 mm, were applied to samples 3 and 4, respectively. The vibration frequency was fixed at a constant value of 50 Hz. Low-frequency vibration was superimposed for 2 s, starting at a strain of 5% and stopping at a strain of 6%. Then, the vibration was removed, and the tensile test continued until samples reached the limit.
The effect of vibration on flow stress was observed from a typical true stress–strain curve, as depicted in Fig. 5. Both maximum stress and average stress markedly decreased immediately after initiation of vibration. The maximum stress decreased by 4.5% and 21% when mild (amplitude, 0.107 mm) and violent (amplitude, 0.310 mm) vibrations were applied, respectively. Stress reduction during vibration-assisted tensile deformation was named vibration softening. When decreased to the lowest point, the stress fluctuated with strain increase. Stress reduction and stress oscillation were coexistent. Vibration with a large amplitude showed a more pronounced stress reduction and stress oscillation. When the vibration was halted and tension was continued, the stress returned to a normal value after elastic recovery. When deformation approached the yield point, material reyield occurred. This finding deviated from the ordinary loading and unloading curve, and effect of strain hardening disappeared briefly during vibration. With continuing deformation, a residual softening effect occurred. In the case of superimposing small vibration, stress can be restored to the normal value. However, in the case of superimposing larger vibration, the material showed a permanent softening. The stress cannot return to the normal value.
Stress–strain curves of typical test with and without low-frequency vibration.
C. Effects of mechanical vibration on microstructure
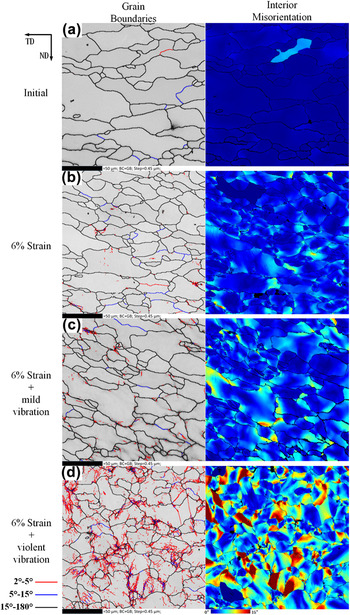
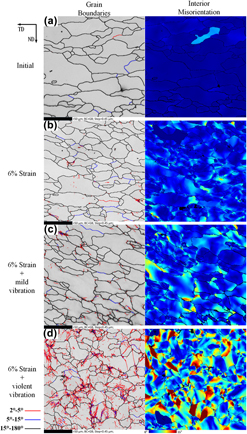
EBSD can obtain information on grain orientation in a representative region. Numerous useful results, including grain boundaries, material texture, and orientation distribution, can be obtained from orientation information. In grain detection, 15° was considered as the demarcation line, and grain boundaries were divided into high-angle and low-angle grain boundaries. To analyze the low-angle grain boundary distribution, low-angle grain boundaries were subdivided between 5°–15° and 2°–5°.
Figure 6 shows EBSD maps of grain boundaries and interior misorientation. Figures 6(a)–6(d) display microstructures of initial DC04 steel (sample 1), 6% deformation DC04 steel (sample 2), 6% deformation with mild vibration (amplitude, 0.107 mm, sample 3), and 6% deformation with violent vibration (amplitude, 0.310 mm, sample 4), respectively. As shown in Fig. 6(a), the initial structure contained small subgrains. As deformation reached 6% strain, a small number of subgrain boundaries appeared [see Fig. 6(b), red lines indicate orientation angles between 2° and 5°, and blue lines indicate orientation angles between 5° and 15°]. When vibration was applied to tensile deformation, large numbers of subgrains formed and stacked near the grain boundaries [Figs. 6(c) and 6(d)]. This phenomenon became more apparent with increasing the amplitude. Interior misorientation maps reflect the deformation within grains. Misorientation inside undeformed material grains is substantially close to 0°. When the strain reached 6% after uniaxial tensile deformation, the misorientation increased slightly. However, once vibration was superimposed to a tension test, misorientation within grains substantially increased. Especially in cases with a sufficiently large vibration amplitude, significant subgrains formed. These misorientation maps explain well the grain size reduction during violent vibration-assisted deformation, as shown in Fig. 4.
Grain boundaries and interior misorientation maps.

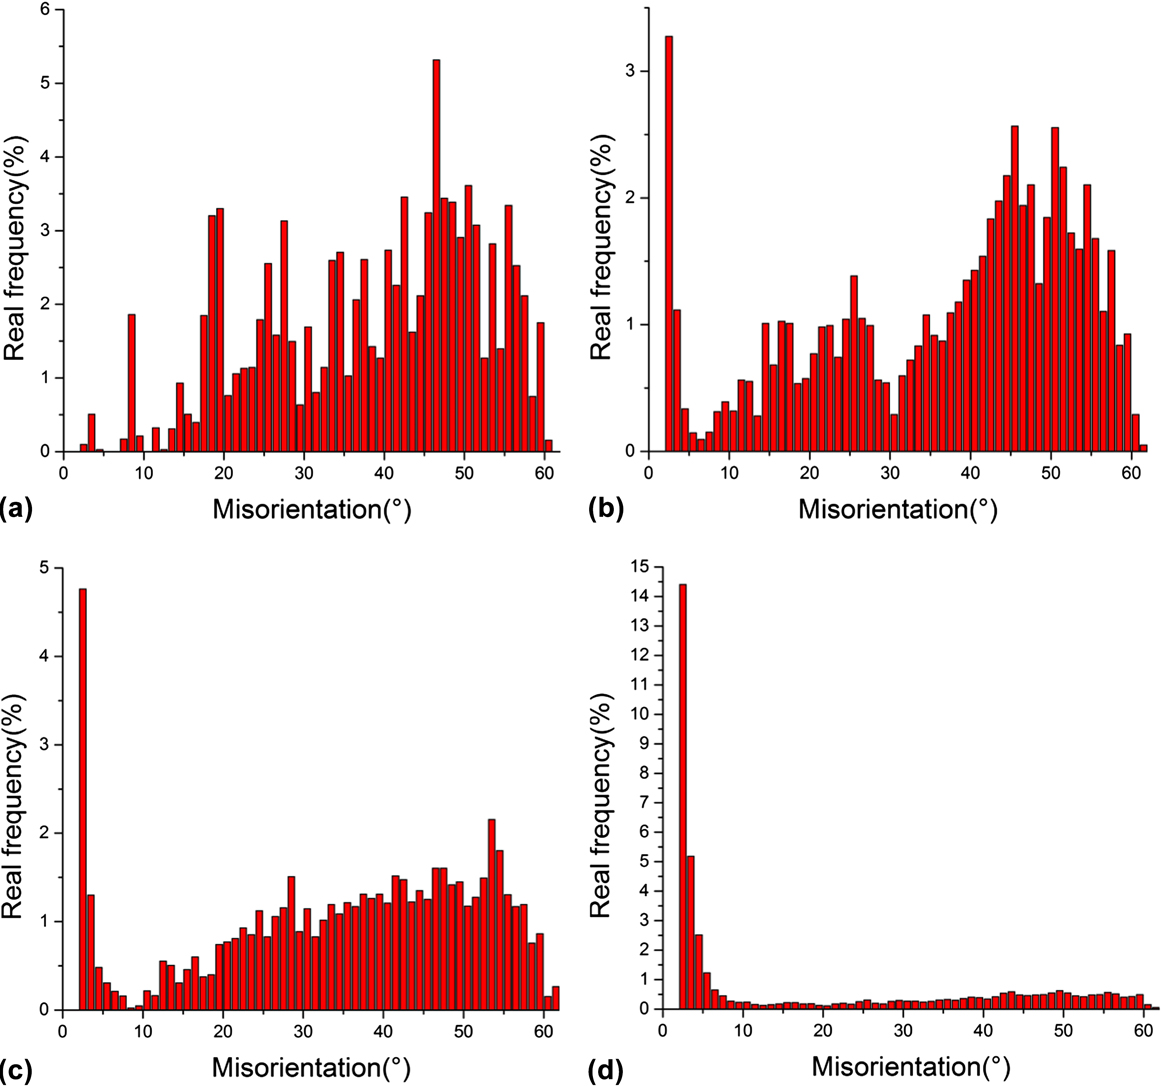
Figure 7 presents statistical information on misorientations presented in Fig. 6. With increase in material deformation, the real frequency of low-angle grain boundaries substantially increased (in comparison between samples 2 and 1) because the plastic deformation can increase the proportion of low-angle grain boundaries. When a low-frequency vibration was applied on tensile deformation, the real frequency of low-angle boundaries markedly increased (samples 3 and 4 compared with sample 1). This finding indicates that low-frequency vibration can enhance plastic deformation.
Real frequency maps for misorientation.
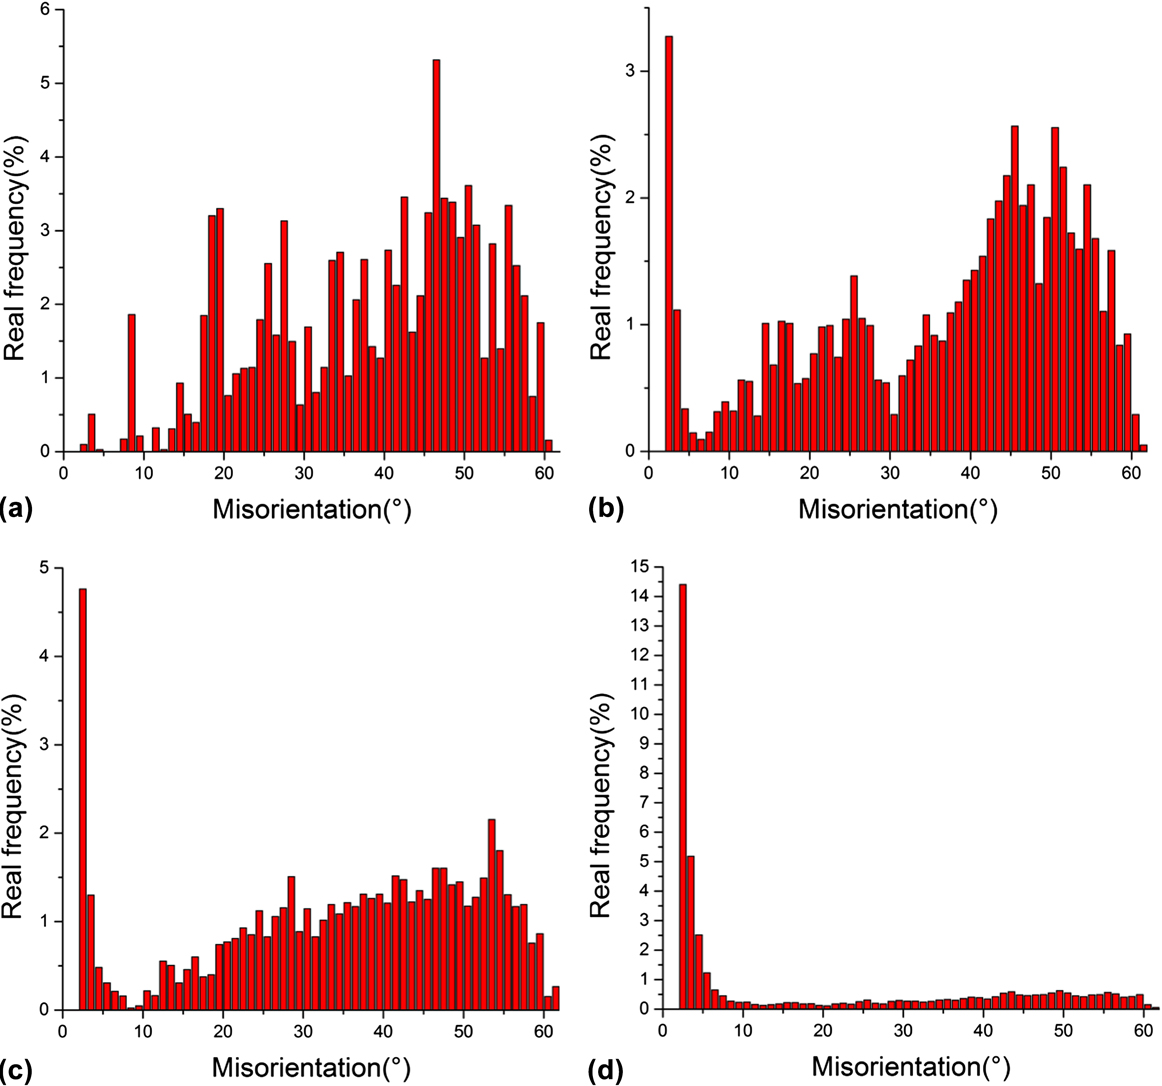
Figure 5 shows stress superposition, vibration softening, and residual softening effects, which simultaneously occurred during low-frequency vibration-assisted tensile deformation. The stress superposition effect usually occurs in metal plastic deformation, where the dynamic load is applied. Owing to elasticity of the metal, the material is subjected to loading and unloading conditions. Stress superposition can explain the average stress drop and stress oscillation. Reference Kirchner, Kromp, Prinz and Trimmel6 However, the maximum stress value under vibration should not substantially decrease when only stress superposition is considered. Hence, vibration softening cannot be explained by stress superposition. The vibration softening effect occurred instantaneously during the start of vibration. The temperature cannot change within short periods, and the material temperature did not markedly change throughout the experiment. This finding indicates that the low-frequency vibration softening is not attributed to the thermal effect of vibration. As observed from the experimental setup shown in Fig. 1, low-frequency vibration was perpendicular to the tensile axis, and a pulsated shear stress wave was generated. With an identical intrinsic deformation resistance, a smaller axis force can deform metals with the assistance of a low-frequency vibration. Reference Meng, Zhao, Zhu, Vogiatzis, Kouroussis, Crocker and Pawelczyk23 However, as depicted in Figs. 6(c) and 6(d), the material structure was affected by the low-frequency vibration treatment. Therefore, the assumption that intrinsic deformation resistance with and without vibration is the same is false. The explanation based on stress combination is not comprehensive enough to interpret the vibration softening effect.
From several previous studies on ultrasound-assisted compression and tension, both dislocation densities change Reference Yao, Kim, Faidley, Zou, Mei and Chen24,Reference Siu, Ngan and Jones25 and the activation energy increase Reference Wang, Liu, Guo, Shan and Zhang3,Reference Yao, Kim, Wang, Faidley, Zou, Mei and Chen26 are used to explain the vibration softening effect. The observed vibration softening is a transient effect that occurs only during the application of low-frequency vibrations. When the vibration was removed, the softening effect immediately disappeared. Dislocation density cannot change in short periods. Therefore, the vibration softening effect cannot be simply explained by dislocation density change. During vibration application, the value of stress reduction is positive to the vibration amplitude, and this relationship can be illustrated by the following equation:
 $$\Delta \delta \propto {A^m}\quad ,$$
whereas, Δδ represents stress reduction, A indicates vibration amplitude, and m refers to a factor related to material property. Equation (2) is similar with constitutive models proposed in the ultrasonic-assisted compression and tensile stress based on the thermal activation theory. Reference Wang, Liu, Guo, Shan and Zhang3,Reference Yao, Kim, Wang, Faidley, Zou, Mei and Chen26 Therefore, we can use the concept of ultrasonic softening to interpret the mechanism of the low-frequency vibration softening effect. As it is well known, dislocations are defects in metals. The dislocation density and movement affect plastic properties greatly. In general, the higher the dislocation density, the greater deformation resistance does the material have. During low-frequency vibration-assisted tensile deformation, an oscillatory pressure is applied to the deformation region. Oscillatory pressure can be considered a form of energy similar to thermal energy and can lower the barrier energy for the dislocation movement. Vibration simultaneously increases attempt frequency for dislocation movement. Dislocations in the case of vibration exhibit more opportunities to move longer distances in a jerky manner. Thus, resistance to deformation declines markedly, and tensile deformation occurs more easily.
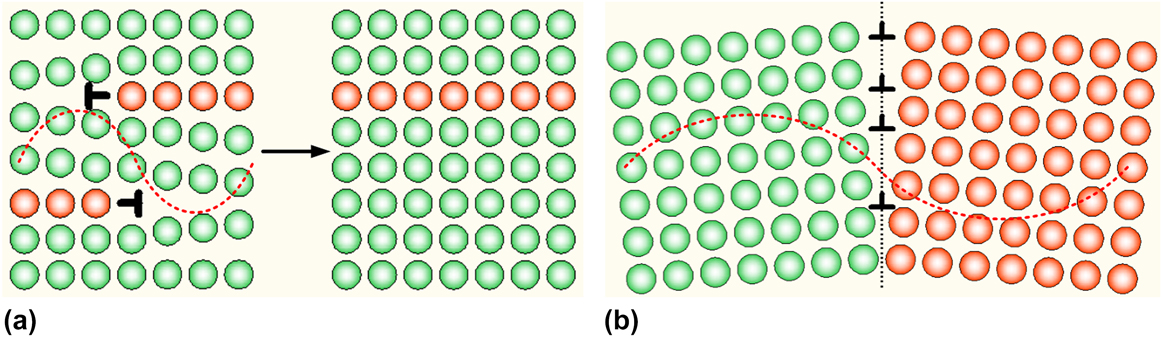
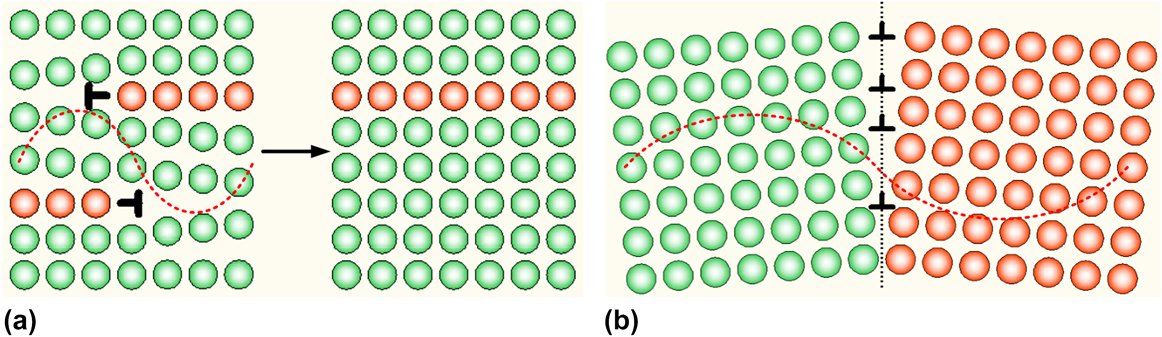
Occurrence of residual softening after the removal of low-frequency vibration can be interpreted by the theory of dislocations. Dislocation annihilation and multiplication constantly coexist in metal plastic deformation. During quasi-static deformation, multiplication is generally more active than annihilation, typically leading to strain hardening. However, when an oscillatory stress is superimposed on tensile and compression deformation, speed of the dislocation movement increases notably, and the unidirectional movement of dislocations becomes reciprocal. This occurrence will increase the ability of dislocations to travel long distances to explore different environments and come in contact with surrounding neighbor dislocations. When dislocations with opposite polarity are close enough, annihilation will occur. Meanwhile, close location of dislocations with the same polarity will lead to dislocation stacking and formation of low-angle grain boundaries. This procedure can be illustrated in Fig. 8. Owing to dislocation annihilation and subgrain formation, the number of dislocations participating in plastic deformation decreases. According to the relationship between flow stress and dislocation density, Reference Mecking and Kocks27 the decrease in dislocation density will alleviate the interaction between dislocations, which will result in flow stress reduction. Decrease in dislocation density mainly explains the residual softening effect of low-frequency vibration. Both probabilities of annihilation and subgrain formation are proportional to the vibration energy. Vibration with a larger amplitude will further induce dislocations to travel longer distances, markedly improving the opportunity for dislocations to meet each other for annihilation and stacking. This phenomenon can explain the more pronounced residual softening at a larger amplitude vibration excitation. Dislocation annihilation and subgrain formation under ultrasonic excitation were also confirmed by dislocation dynamic simulations. Reference Siu, Ngan and Jones25,Reference Siu and Ngan28 Simulation results in previous works coincided with findings in the low-frequency vibration-assisted tensile deformation.
Dislocations annihilation and low-angle grain boundary formation under a vibratory load. (a) Dislocations annihilation and (b) Low-angle grain boundary formation.
The present work is the first to investigate vibration softening and residual softening effects involved in low-frequency vibration (50 Hz). We observed that similar to ultrasonic softening, low-frequency vibration can soften the metal with appropriate excitation force and vibration direction. However, compared with ultrasonic vibration, low-frequency vibration offers a higher potential for industrial use because of the large excitation force. Vibration softening and residual softening effects discovered in this article are explained by the dislocation theory at the macro level. A more accurate constitutive model should be established in the future work.
IV. CONCLUSIONS
Tensile deformation assisted by simultaneous transversal low-frequency vibration was conducted on low-carbon DC04 steel samples. We noted in the experiment that simultaneous applications of low-frequency oscillations can cause significant stress reduction and residual softening. Softening effects become more prominent at higher vibrational intensities. EBSD observations of the cross sections of samples showed a highly notable formation of subgrains during low-frequency vibration-assisted tensile deformation. Instantaneous stress reduction in superimposed low frequency is attributed to the additional energy applied in the form of vibrations, which assisted in increasing the attempt frequency and/or lowering the energy barrier for dislocation motion. A residual softening effect can be interpreted via dislocation density decrease as a result of vibration markedly improving the opportunity for dislocations to explore suitable environments for annihilation and stacking. Together with a similar phenomena observed in ultrasound-assisted tension and compression tests, vibration softening effect obtained in our experiments confirmed that vibration softening effects can occur within a large frequency range. Results presented in this study aid in understanding the mechanism of low-frequency vibration influence on material properties and microstructures during plastic deformation.
ACKNOWLEDGMENTS
The authors gratefully acknowledge the financial support provided by the National Natural Science Foundation of China for Key Program (Grant No. 51335009), as well as the Natural Science Foundation of Jiangsu Province, China (Grant No. BK20140407). The authors also thank to the Xi’an Jiaotong University Instrument Analysis Center for their help and support in EBSD images.