1. Introduction
1.1 Circular dichroism spectroscopy
For nearly 50 years, circular dichroism (CD) spectroscopy has been used as a tool for the study of protein structures. This is because proteins are chiral structures and the electronic transitions arising from their peptide backbones and aromatic side chains give rise to different absorption spectra when they interact with left- and right-circularly polarised light. Circular dichroism is a measure of the difference between those absorptions. CD spectroscopy produces valuable information on protein conformations because different types of secondary structure produce different spectra. This information has been used to characterise the structure and function of many proteins in solution. Recent developments in instrumentation, sample preparation methods and bioinformatics have seen a renaissance of this classical technique. In the past 3 years, for instance, more than 4000 papers have included the use of CD for the characterisation of proteins. This leap in popularity has arisen due to the new applications that are possible as a result of all of these advances. One of these developments has been the use of synchrotron radiation (SR) as an intense light source for the measurements. Just as the use of SR as an intense X-ray source in protein crystallography has enabled new developments and studies that had not been possible with conventional laboratory-based X-ray sources, the use of SR for CD has improved the measurements, expanded the types of samples that could be examined and led to new applications in structural and functional genomics.
This review discusses the technique of synchrotron radiation circular dichroism (SRCD) spectroscopy, including new instrumentation, sample preparations, types of samples that can be examined, methods of analyses and novel applications for the study of proteins now enabled by this method. Practical aspects of the use of SRCD for studying proteins have been reviewed by Miles & Wallace (Reference Miles and Wallace2006) and are discussed in detail in a recent monograph on SRCD spectroscopy (Wallace & Janes, Reference Wallace and Janes2009).
1.2 Synchrotron radiation circular dichroism spectroscopy
Whilst CD spectroscopy has been very useful for many types of studies of protein structure, a major practical limitation has been the low intensity of the light source used in conventional laboratory-based CD instruments; in most cases this has been a Xenon arc lamp, which produces high flux (>1010 photons/sec) in the wavelength region from above 300 nm down to ~220 nm, but decreasing significantly below 220 nm (Fig. 1) (Clarke et al. Reference Clarke, Bowler, Fell, Flaherty, Grant, Jones, Martin-Fernandez, Shaw, Todd, Wallace and Towns-Andrews2000; Clarke & Jones, Reference Clarke and Jones2004). The light from a Xenon lamp drops off precipitously below ~200 nm, effectively limiting measurements to ~185 nm at best (more often 190 or 200 nm). Hence, CD studies of proteins have generally concentrated on the ultraviolet (UV) region of the absorbance spectrum, specifically in the wavelength region known as the far-UV (~190–250 nm), where the n→π* and π→π* transitions of the peptide backbone amide groups occur, and in the near-UV region (~250–300 nm), where transitions arising from aromatic side chains are found. These spectral regions are useful for secondary and tertiary structural studies, respectively. However, there are additional transitions from the peptide backbone and other side chain effects in the lower vacuum ultraviolet (VUV) wavelength region below 190 nm. Until the development of SRCD spectroscopy, these transitions were generally undetectable by commercial CD instruments.
Comparison of the light flux of a conventional CD instrument (dashed line) with that of two different SRCD beamlines: 3·1, an early low-flux beamline at the SRS (dotted-dashed line), and CD12, a later high-flux beamline at the SRS (solid line). (Adapted from Clarke & Jones, Reference Clarke and Jones2004.)

Higher light fluxes in both the UV and VUV regions are attainable from SR sources. At 200 nm, they can range from ~1010 at low-flux beamlines to >1013 photons/sec at high-flux beamlines (Miles et al. Reference Miles, Janes, Brown, Clarke, Sutherland, Tao, Wallace and Hoffmann2008a), but most importantly, the flux levels in SRCD beamlines remain relatively constant down to ~140 nm. The consequences of these enhanced fluxes are several important improvements for experimental studies on proteins, including the following: (1) The spectra can be extended into the low-wavelength VUV regime, thus enabling the measurement of additional transitions (Fig. 2) (Wallace, Reference Wallace2000a). This means there is additional information content in the SRCD spectra, which can provide more information on the protein structure (Wallace & Janes, Reference Wallace and Janes2001). This information is present in the additional transitions, due to charge transfer interactions between peptide backbone groups (Serrano-Andres & Fulscher, Reference Serrano-Andres and Fulscher2003; Gilbert & Hirst, Reference Gilbert and Hirst2004). (2) The signal-to-noise level is greatly improved (Fig. 3) (or the corollary of this, the amount of protein used can be much lower to obtain the same signal-to-noise levels). The improvement in signal-to-noise levels also means that SRCD will be able to detect more subtle conformational changes that result in smaller spectra changes (Miles & Wallace, Reference Miles and Wallace2006). Alternatively, the improved signal-to-noise means that faster measurements (shorter averaging times) can be made, thus enabling fast dynamics studies. (3) The samples can be measured in the presence of absorbing components such as salts, thus enabling the maintenance of a protein in conditions that more realistically reflect physiological conditions or alternatively represent the sorts of conditions present in crystallisation buffers or NMR solutions, thereby permitting more facile comparisons between results obtained with different biophysical techniques. These improvements thus enable the new applications for the study of protein samples which are described in this review.
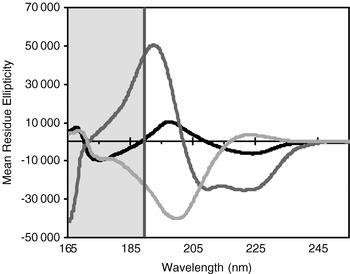
Comparison of the wavelength ranges of CD and SRCD spectra of proteins. CD spectra generally cover only the wavelength range to the right of the green line (i.e. the unshaded area), whereas SRCD spectra include the whole wavelength range. The spectra shown are of three proteins with structures representative of the main classes of secondary structures: mostly helical (myoglobin – red), mostly sheet (concanavalin A, blue) and mostly PPII structure (collagen, yellow). (After Miles & Wallace, Reference Miles and Wallace2006.)

Comparison of signal-to-noise levels for a sample (horse myoglobin) examined on a conventional JASCO CD instrument (red) and on the SRCD beamline CD12 (blue). Both curves represent a raw (not smoothed) scan of the same protein. The conventional CD spectrum was from 8 summed accumulations using a 1-sec response time with a protein concentration of 0·06 mg/ml in a 0·1-cm pathlength cell; the SRCD spectrum is a single accumulation (one scan) using a 1 sec dwell time with a protein concentration of 11 mg/ml in a 0.0006 cm pathlength cell, so the total amount of protein used in each experiment was approximately the same. (After Miles & Wallace, Reference Miles and Wallace2006.)

1.3 The development of synchrotron radiation circular dichroism spectroscopy for the study of proteins
Although the designs and creation of SRCD instruments were first reported in 1980 (Sutherland et al. Reference Sutherland, Desmond and Takacs1980; Snyder & Rowe, Reference Snyder and Rowe1980), there were few examples of the use of SRCD spectroscopy to examine biological systems before 2000. This was in part because the instrumentation, sample chambers and sample cells were not fully optimised for conditions compatible with biological investigations and essential proof-of-principle studies showing the utility of SRCD in the life science had not yet been done.
In the early 1990s, it was shown that SRCD spectra could be measured down to wavelengths of ~178 nm for aqueous samples (France et al. Reference France, Kieleczawa, Dunn, Hind and Sutherland1992; Garone et al. Reference Garone, Albaugh and Steiner1990; Sutherland et al. Reference Sutherland, Emrick, France, Monteleone and Trunk1992), significantly lower than obtainable on conventional CD (cCD) instruments at the time. By early 2000, data below 170 nm had been obtained (Wallace, Reference Wallace2000a). It was demonstrated that the additional information included in these data could be very useful for the analyses of secondary structure (Wallace & Janes, Reference Wallace and Janes2001). This turns out to be especially valuable for proteins with significant beta sheet contents (Clarke & Jones, Reference Clarke and Jones1999; France et al. Reference France, Kieleczawa, Dunn, Hind and Sutherland1992; Lees et al. Reference Lees, Miles, Wien and Wallace2006a, Reference Lees, Miles, Janes and Wallace2006b; Qi et al. Reference Qi, Holt, McNulty, Clarke, Brownlow and Jones1997; Symmons et al. Reference Symmons, Buchanan, Clarke, Jones and Gay1997), as such samples usually are less accurately analysed by cCD. Initial studies using stopped-flow methods also showed the potential value of SRCD for kinetic studies of protein folding (Clarke et al. Reference Clarke, Doig, Stapeley and Jones1999). Unfortunately follow-up dynamics studies since then have been limited due to the lack of suitable instrumentation on existing beamlines, but this is an area that may in the future prove to be amongst the best applications for SRCD (see Section 6.1.3).
Before 1997, the only SRCD studies on biological samples were undertaken at the National Synchrotron Light Source (NSLS) in the United States; the next beamline (designated 3·1) used for biological studies was developed at the Synchrotron Radiation Source (SRS) Daresbury in the United Kingdom. Then, in 2001, an SRCD beamline at the Institute for Storage Ring Facilities (ISA) in Denmark and one at the Hiroshima Synchrotron Radiation Center (HiSoR) in Japan joined the cadre of active beamlines.
In the early 2000s, a number of proof-of-principle studies were done and efforts were made to publicise the improved quality of the data and the wide range of advantages of the method relative to conventional CD spectroscopy (Wallace, Reference Wallace2000b; Wallace & Janes, Reference Wallace and Janes2001) for the study of proteins. A critical study was also done to address the issue of the possible effects of the intense light flux on the sample integrity (Orry et al. Reference Orry, Janes, Sarra, Hanlon and Wallace2001). It was at about that time that the method came to be known as ‘SRCD’ spectroscopy (Wallace, Reference Wallace2000b) (as opposed to the previous mixed nomenclatures of ‘extended circular dichroism’ (Clarke & Jones, Reference Clarke and Jones1999), ‘vacuum ultraviolet CD’ (Johnson et al. Reference Johnson, Gray and Sutherland1991; Ojima et al. Reference Ojima, Sakai, Fukazawa and Gekko2000; Snyder & Rowe, Reference Snyder and Rowe1980) or ‘UV CD using synchrotron radiation’ (Sutherland, Reference Sutherland and Fasman1996). SRCD is the term that is now in common use worldwide (Tao & Wallace, Reference Tao and Wallace2009).
Other essential tools that made the quantitative use of SRCD viable, such as the creation of reference data sets for secondary structure analyses that included SRCD data (Lees et al. Reference Lees, Miles, Wien and Wallace2006a; Matsuo et al. Reference Matsuo, Yonehara and Gekko2004), the development of cross-calibration procedures standardising methods amongst SRCD beamlines and between SRCD beamlines and conventional CD instruments (Miles et al. Reference Miles, Wien, Lees, Rodger, Janes and Wallace2003, Reference Miles, Wien, Lees and Wallace2005a) and the design of appropriate sample cells and cell holders (Matsuo et al. 2002; Wien & Wallace, Reference Wien and Wallace2005) were in place by the mid-2000s and led to a rapid growth in the number of new SRCD beamlines built (currently a total of 14) and the development of new applications for its use. So far, SRCD spectroscopy has been used in >100 publications.
2. Synchrotron radiation circular dichroism measurements
2.1 Instrumentation
2.1.1 Synchrotron light sources
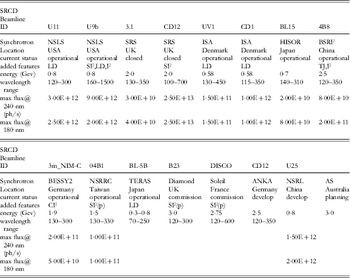
SRCD stations use SR light in the UV and VUV regions; to date nearly all SRCD beamlines (Table 1) are installed on bending magnets. The flux off of bending magnets in this wavelength range is more than sufficient for the requirements of CD experiments (indeed higher flux densities are contraindicated for protein studies due to radiation heating effects (see Section 2.4). Using bending magnets instead of insertion devices has been a major advantage in obtaining approval for inclusion of SRCD beamlines as part of the portfolio of beamlines at many synchrotrons: bending magnets are not only less costly, but such ports tend to be in considerably less demand for physics, materials and crystallography beamlines than are ones on insertion devices such as undulators and wigglers.
Characteristics of SRCD Beamlines

Key:
SF=Stopped Flow
TJ=Temperature Jump
CF=Continuous Flow
LD=Linear Dichroism
F=Fluorescence
(p)=planned
Websites:
U11: http://www.nsls.bnl.gov/beamlines/beamline.asp?blid=U11
U9b: http://www.nsls.bnl.gov/beamlines/beamline.asp?blid=U9b
UV1: http://www.isa.au.dk/facilities/astrid/beamlines/uv1/uv1OpticalSpecs.asp
CD1: http://www.isa.au.dk/facilities/astrid/beamlines/cd1/CD1OpticalSpecs.asp
4B8: http://www.ihep.ac.cn/bsrf/english/facility/html/VUV.htm
3m_NIM-C: http://www.bessy.de/bit/bit_show_object.html.php?i_bit_id_object=168
04B1: http://140.110.203.42/manage/fck_fileimage/file/bldoc/04BSNM.htm
DISCO: http://www.synchrotron-soleil.fr/Recherche/LignesLumiere/DISCO/DescriptionLigne#equipe
CD12: http://ankaweb.fzk.de/website.php?page=instrumentation_beam&id=21&field=1
Because of the wavelength ranges covered and the lower flux requirements, many very successful SRCD beamlines have been installed on low energy synchrotrons such as ISA (0·58 GeV) and HiSOR (0·7 GeV). Indeed, SRCD beamlines that are being developed on higher-energy third-generation synchrotron sources such as Soleil (in France – 2·75 GeV) and Diamond Light Source (in the United Kingdom – 3 GeV) have encountered additional design issues due to the high flux of photons produced. These include the materials used for the windows (they can rapidly develop colour centres), the requirement for a cold finger on the first mirror to dissipate the heat generated by the white light (including hard X-rays) impinging on the mirror, the requirement to spread the beam on the sample thereby reducing the flux density and, potentially, the need to include filters or baffles or additional reflecting surfaces to decrease the total flux onto the sample.
2.1.2 Synchrotron radiation circular dichroism beamlines
The designs of most beamlines have been generally modelled on conventional CD instruments, with a light source, a series of optical elements including reflecting surfaces, a monochrometer, a photoelectric modulator (PEM) to create the left- and right-circularly polarised light, a sample chamber that eliminates atmospheric oxygen (i.e. either nitrogen-flushed or under vacuum) and a fast detector sensitive over the UV wavelength range (Clarke et al. Reference Clarke, Bowler, Fell, Flaherty, Grant, Jones, Martin-Fernandez, Shaw, Todd, Wallace and Towns-Andrews2000; Ojima et al. Reference Ojima, Sakai, Fukazawa and Gekko2000; Qian et al. Reference Qian, Yan and Tao2003; Sutherland et al. Reference Sutherland, Desmond and Takacs1980; Snyder & Rowe, Reference Snyder and Rowe1980; Wallace, Reference Wallace2000b). An important difference, however, is the material used for the optical windows, including those of the PEM; because silica is relatively opaque to photons of <200 nm, the window materials used in SRCDs tend to be either magnesium, calcium or lithium fluoride (which are much more transparent to light in the wavelength region below 190 nm). In addition to the standard instrument elements, a linear polariser is often included to ensure none of the circularly polarised light inherently produced by synchrotrons is included in the light entering the sample (or else it could distort the ratio of input left- and right-handed light). The construction and designs of SRCD beamlines have been discussed in detail by Sutherland (Reference Sutherland, Wallace and Janes2009).
2.1.3 Synchrotron radiation circular dichroism sample cells
The sample cells ordinarily used for cCD spectroscopy are made from Suprasil quartz, a material that has good transparency properties in the near- and far-UV wavelength range. Due to the limited light flux in cCD instruments, the optical properties of the material used in the sample cell windows are generally not the factors that limit the lowest wavelength achievable. However, when using SR as the light source, the light flux is not the limiting factor; instead the absorbance properties of the materials that lie in the beam limit the transmission of the low-wavelength light. These can include the material used for windows in the beamline itself, but also include the materials used in the manufacture of the sample cells, as well as the contents of those cells, especially the solvent present. In the case of water, used for most biological experiments, the molar excess of water to protein and the absorbance of the water (peak ~168 nm) means that if there is a large amount of water in the beam (i.e. the sample cell has a long pathlength) this will be an important factor limiting the minimum wavelength measurable. The material used to make the sample cells is also critical, since even very thin quartz cells tend to result in wavelength cut-offs in the range of 190 nm (the exact value depending on the thickness and composition of the quartz). Because of these two factors, several attempts have been made to produce new sample cells for use in SRCD measurements that employ either different materials that are more optically transparent or have shorter pathlengths so there is less solvent in the beam or both.
The first such cell specifically designed for SRCD measurements, designated the Gray cell, was developed at the NSLS (Gray et al. Reference Gray, Lang, Kuner, Vaughan and Sutherland1984). It was constructed from thin quartz plates that were demountable (which also aided in cleaning) and could be made to have different pathlengths depending on the thickness of Teflon spacer used between the windows. They had the advantages of ease of use, very thin pathlengths, and compatibility with existing circular cell holders. They permitted measurements down to ~185 nm, a significant achievement at the time. A disadvantage was the physical properties of the Telfon spacers when they became wet and stretched, which made manipulation and reproducible loading of the cells challenging.
The second type of cell produced some years later (Matsuo et al. Reference Matsuo, Sakai, Matsushima, Fukuyama and Gekko2003) extended the idea of short pathlengths, but made the cells out of magnesium fluoride. The design made them suitable for use in a vacuum sample chamber, such as is present at the HiSOR beamline. They used adjustable spacers in the range from 1·3 to 50 μm to achieve the different pathlengths, which reportedly enabled measurements down to 160 nm in aqueous solutions (although the data realistically seemed to cut-off at around 170 nm) and showed good thermal stability over a wide temperature range from −30 to 70°C. Disadvantages include the fragility of the material and the time required for their loading and assembly and the issue of calibration and reproducibility after adjustment of the pathlength.
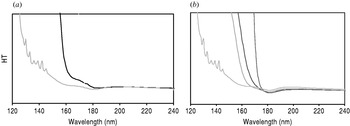
The third type of cell specially designed for SRCD measurements (the ‘Birkbeck’ cell) was one made from calcium fluoride (Wien & Wallace, Reference Wien and Wallace2005). These cells, with fixed pathlengths ranging from ~4 to ~20 μm, had the advantages of being made from an optically transparent material enabling data collection to low wavelengths (Fig. 4a), plus the short pathlengths needed to limit the amount of solvent present. In addition, when placed in their specially designed cell holder, they could be loaded quickly and reproducibly and could be unloaded and cleaned easily, even allowing recovery of some of the solution afterwards. Measurements in aqueous solution were possible to ~167 nm. Disadvantages included the birefringence present in the calcium fluoride crystals, which meant that the two plates had to have very consistent alignments relative to each other for the corresponding sample and baseline loading. This was overcome by the design of a cell holder that produced not only reproducible pressure, resulting in identical pathlengths on each loading, but also reproducible orientations of the plates (Wien & Wallace, Reference Wien and Wallace2005). An additional advantage of the custom-made cell holder was that it could be used on both conventional CD instruments and at all existing SRCD beamlines, thereby enabling strictly comparable measurements and cross calibration studies. A commercial version of these cells is now available (F. Wien, personal communication; Tao & Wallace, Reference Tao and Wallace2009).
High-tension plots of different sample cells with and without different solvents, showing their relative absorbance characteristics and their low-wavelength cut-off limits. (a) Comparison of empty calcium fluoride ‘Birkbeck’ cells (purple) and empty quartz Suprasil cells (black). The peaks between ~130 and 140 nm that can be seen in the empty calcium fluoride cells are due to the nitrogen used to flush the sample chamber and can be used for wavelength calibrations of the beamline. (b) Calcium fluoride cells without solvent (purple), with trifluorethanol (green), acetonitrile (red) and water (blue).

An added benefit of all of the custom-made short pathlength cells, in addition to the lower wavelength achievable, is that they tend to have a much smaller volume and therefore require proportionately less material than do the longer pathlength standard CD cells. For example, the Birkbeck cells require only ~2 μl of solution, as opposed to ~50–200 μl for standard demountable cells. A disadvantage of all short pathlength cells, however, is that usually they require reasonably high protein concentrations (~1–10 mg/ml); however, conditions of pathlength and buffers can be chosen which require concentrations of only ~0·1 mg/ml solutions (1 μm for a protein of MW 100 000), which can usually be attainable. Conversely, the requirement for higher protein concentrations means that samples can be examined under conditions that more closely approximate the conditions used for crystallisation of proteins (~5–20 mg/ml) or the protein concentrations present in ‘crowded’ cells.
In general, sample cells used in SRCD instruments tend to be circular rather than the more common rectangular cells used in many cCD instruments. This is because circular cells are isotropic in shape and thus tend to be more compatible with the more isotropic beam shapes produced by beamlines; they further have the advantage that for scattering samples such as membranes, the light is symmetrically transmitted in all directions before impinging on the detector face, thereby giving rise to less apparent differential light scattering artefacts for these type of samples (see Section 4.1.2). In addition, circular cells exhibit less strain-induced dichroism.
Hence, the developments of new sample cells have also greatly aided the quality of the data obtainable by SRCD.
2.2 Cross-calibrations
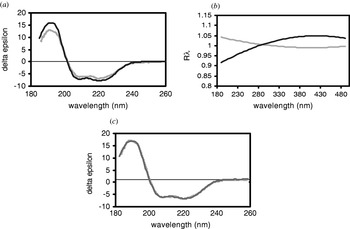
An essential consideration if protein spectra are to be compared from different beamlines and cCD instruments is that all are properly calibrated and cross-calibrated so that the same spectrum is obtained for each protein no matter where it is measured. This is especially important if standard reference data sets are to be used in empirical analyses of the data (see Section 3.2). The need for cross-calibration may seem fairly obvious, however, several years ago, two independent studies (Jones et al. Reference Jones, Schiffmann, Knight and Windsor2004; Miles et al. Reference Miles, Wien, Lees, Rodger, Janes and Wallace2003) examining the comparabilities of spectra collected both on different types of conventional CD instruments and on different instruments of the same type in different labs, showed that there was a massive variation between the spectra obtained, even though all examined the exact same protein sample provided by a single laboratory (Fig. 5a). This may have been because, in general, most laboratory-based CD instruments rarely tend to have calibration checks done on them, and even when they do, the calibration tests tend to use a single peak (290·5 nm) in the spectrum of one standard material, usually camphor sulphonic acid (CSA) or the related compound ammonium camphorsulphonate (ACS). Single calibration points, however, are not sufficient to ensure proper calibration across the entire UV region used in CD studies. As a result, a series of standards and protocols (Miles et al. Reference Miles, Wien, Lees, Rodger, Janes and Wallace2003, Reference Miles, Wien, Lees and Wallace2005a; Miles & Wallace, Reference Miles, Wallace, Wallace and Janes2009a; Ravi et al. Reference Ravi, Hills, Knight, Wallace and Janes2009) were established to cover the magnitudes, optical rotations and peak positions across the spectral ranges of interest for both cCD and SRCD instruments. In addition, software was produced to facilitate such cross-calibrations (Lees et al. Reference Lees, Smith, Wien, Miles and Wallace2004) (Fig. 5b) and the molar elliptical extinction coefficient of CSA was accurately re-determined (Miles et al. Reference Miles, Wien and Wallace2004). These standards and procedures have since been used to test and cross-calibrate many SRCD beamlines (Miles et al. Reference Miles, Wien, Lees, Rodger, Janes and Wallace2003, Reference Miles, Wien, Lees and Wallace2005a, Reference Miles and Wallace2007; Janes & Wallace, unpublished). The results obtained for all the SRCDs were remarkably consistent, and the spectra of a number of test proteins such as myoglobin, lysozyme, concanavalin A and collagen showed excellent agreement between the beamlines at SRS, NSLS, the National Synchrotron Radiation Research Centre (NSRRC), ISA, Soleil, and the Beijing Synchrotron Research Facility (BSRF). This is likely because SRCD beamlines are regularly (sometimes as often as every beam fill) calibrated. As a result the data they produce are in general much better cross-correlated than conventional CD spectra. Furthermore, at a recent international SRCD meeting (Tao & Wallace, Reference Tao and Wallace2009), beamline scientists of both new and old beamlines agreed on standards and values for calibration of their SRCD beamlines, which should maintain this high correspondence between data obtained at SRCD beamlines in the future. This will be very important for empirical analyses using the new reference data sets collected on such well-calibrated beamlines (Lees et al. Reference Lees, Miles, Wien and Wallace2006a).
Cross-calibration: (a) Comparison of CD spectra of myoglobin obtained on two different instruments that have not been cross-calibrated. (b) Cross-calibration correction curves produced using CDtool software (Lees et al. Reference Lees, Smith, Wien, Miles and Wallace2004). (c) CD spectra (from a) after application of the cross-calibration procedure. (Adapted from Miles et al. Reference Miles, Wien, Lees, Rodger, Janes and Wallace2003.)

2.3 Practical considerations
Although CD is an apparently simple technique suitable for employment by non-expert users, its apparent simplicity means it is also simple for errors to be introduced by the way data are collected, resulting in problems in the final spectra produced. An excellent review of good practice procedures for CD by Kelly et al. (Reference Kelly, Jess and Price2005) includes a discussion of common errors and their solutions. These issues are all also relevant to SRCD, but in addition there also are a number of further considerations for good practice for SRCD data collection that are discussed by Miles & Wallace (Reference Miles, Wallace, Wallace and Janes2009b) and reviewed by Miles & Wallace (Reference Miles and Wallace2006).
The most common problem in CD and SRCD is caused by using samples that have too high an absorbance, out of the range of the detection limits. This can be monitored by simultaneously recording the dynode voltage or detector high-tension (HT) or high-voltage readings, all of which are effectively pseudoabsorbance measurements. This problem can also be detected by comparisons of spectra of the same sample obtained in different pathlengths or at different concentrations (Miles & Wallace, Reference Miles and Wallace2006). In many cases, the high absorbance is not the result of the protein component but may arise due other components included in protein samples to maintain their structural integrity (such as buffers, salts and other additives) that have significant absorbance in the UV wavelength range. Although such components tend to be non-chiral and thus do not produce a CD signal, they do absorb each of the left- and right-circularly polarised light beams, resulting in a greatly diminished transmission of light through the sample and impinging on the detector. A commonly-used example of a component producing high absorbance is high concentrations of sodium chloride, as the chloride absorbs significantly in the far-UV and VUV regions. Replacement of sodium chloride with sodium fluoride can often improve the ability to measure the protein components, as can the replacement of certain amide-based buffers with other non-absorbing buffers (Kelly & Price, Reference Kelly, Price, Wallace and Janes2009; Miles & Wallace, Reference Miles and Wallace2006).
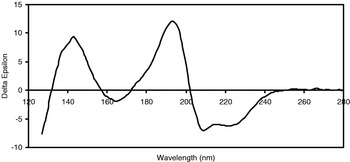
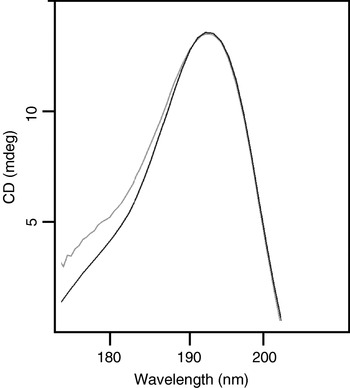
The limitation to the wavelength limit achievable also arises in biological solutions due to the solvent water, which is present in vast molar abundance relative to the protein and which also absorbs in the VUV region (with a peak at ~168 nm and significant absorbance as high as 190–200 nm). Indeed, in the absence of water, spectra can be measured down to at least 130 nm (Fig. 6), revealing even more peptide transitions in the wavelength range between 130 and 170 nm. By using short pathlength cells, the water absorbance can be minimised, but not eliminated. All of these factors together conspire to limit the light flux into and out of a protein sample, in many cases making measurements below even 200 nm difficult in a conventional CD instrument and practically limiting SRCD measurements to above ~170 nm. Although some conventional CD instruments attempt to overcome the limited light flux by opening their slits at low wavelengths, but changes in the spectral bandwidth effectively distorts the low-wavelength data (Lees & Wallace, Reference Lees and Wallace2002) producing low-wavelength peaks that appear broader than they actually are (Fig. 7). However, because of the high light penetration of SR, even if absorbing salts and/or buffers are present, it may be possible to measure SRCD spectra for samples which are not possible to examine by CD spectroscopy.
SRCD spectrum of a dry horse myoglobin film showing that additional transitions are detectable in the wavelength region between 120 and 170 nm, when measurements are made in the absence of water (Wallace & Janes, unpublished results).

Comparisons of the low-wavelength regions of SRCD (blue) and CD (green) spectra of myoglobin. Whilst the CD instrument software permitted collection of data down to around ~170 nm, it is distorted in the low-wavelength region below 190 nm, because in order to have sufficient light flux on the sample, the slits are wide open. The resulting spectrum appears to have a broader peak but this is an artefact of the bandwidth which results in a range of wavelengths input onto the sample (Miles & Wallace, unpublished results).

A second good practice issue is the ability to obtain accurate determinations of the spectral magnitude, which requires knowledge of the correct protein concentration and the sample cell pathlength. Both the reviews by Kelly et al. (Reference Kelly, Jess and Price2005) and by Miles & Wallace (Reference Miles and Wallace2006), discuss good and bad methods for precise protein concentration determination (for instance, quantitative amino acids and denatured extinction coefficients can be sufficiently accurate, but colorimetric assays or gravimetric determinations generally are not). The short pathlength cells used in SRCD are particularly susceptible to erroneous pathlength values (varying by as much as 50% from the values reported by manufacturers) and for SRCD measurements especially, users need to independently determine their cell pathlengths. Methods for determining pathlengths using interferometry or dilution methods are discussed by Miles et al. (Reference Miles, Wien, Lees and Wallace2005a). The consequence of using inaccurate spectral magnitude is that the resulting protein secondary structure determinations can be very wrong (Miles et al. Reference Miles, Whitmore and Wallace2005b). Although correct spectral magnitudes are important in all cases, a significant advantage of SRCD is that if the very-low-wavelength data down to 170 nm is included in the analyses, knowledge of the correct magnitude is not nearly as critical for obtaining a correct analysis (Lees et al. Reference Lees, Miles, Janes and Wallace2006b).
2.4 Thermal radiation effects
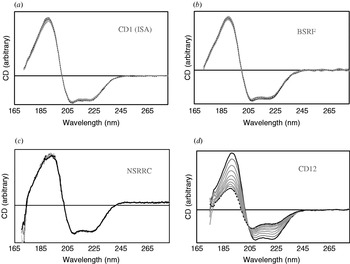
Because of the high light flux on the samples in an SRCD cell, one early concern was whether this would cause any damage to the protein during the time of data collection (Orry et al. Reference Orry, Janes, Sarra, Hanlon and Wallace2001). Although the energy of the VUV light is much less than that of X-rays and so was not expected to break covalent bonds, one suggestion (Clarke & Jones, Reference Clarke and Jones2004) had been that it might produce free radicals that would damage the chemical integrity of protein samples. Thus, to test this was an essential proof-of-principle study needed before the SRCD method could find wide acceptance and use. The first such study was conducted on two of the low-flux beamlines (SRS 3.1 and ISA UV1). Using mass spectrometry and gel electrophoresis it was shown that neither chemical fragmentation nor modification, nor any kind of cross-linking occurred after many hours of irradiation in the beam (Orry et al. Reference Orry, Janes, Sarra, Hanlon and Wallace2001). Furthermore, no change in the protein conformation could be detected after this treatment, as evidenced from the SRCD spectra which were not altered after 20 or more repeat scans (Fig. 8). However, the situation changed when high-flux beamlines such as SRS CD12 were developed. In this case, the flux on the sample was several orders of magnitude higher (Clarke & Jones, Reference Clarke and Jones2004) than on the two beamlines originally tested, and the initial observations were that, for most proteins, the SRCD signal changed dramatically in the course of collecting even one or two repeated scans (Fig. 8). Using the highly-sensitive protein human serum albumin for testing, it became clear that the protein was not chemically modified, but did undergo a substantial conformational change (as reflected in sequential SRCD spectra) as it was irradiated in the beam (Wien et al. Reference Wien, Miles, Lees, Hoffmann and Wallace2005). For some of the proteins tested, after the sample was removed from the beam and allowed to re-equilibrate and then re-examined, the protein was able to refold to its native conformation. Hence, the suggestion was made that the irradiation was heating the sample, causing the protein to unfold or denature. Although there was no detectable change in the macroscopic temperature of the protein solution, it was postulated that the high flux of the beam, especially at low wavelengths near the water absorption peak, was causing the heating of internal water molecules in the proteins, waters that were integral to the proteins maintaining their native structures (Wien et al. Reference Wien, Miles, Lees, Hoffmann and Wallace2005). Comparison of the behaviour of a number of other proteins indicated that the denaturation was not limited to a particular type of protein (i.e. with/without disulphides, with high or low aromatic amino acid contents, specific types of secondary structures or folds, single or multiple domain or single or multiple subunit proteins). The only class of protein that appeared to be less sensitive was that of membrane proteins. This, too, would be consistent with the idea of heating bound waters as membrane protein structures tend to have fewer internal water molecules. One study (Janes & Cuff, Reference Janes and Cuff2005) showed that if the total flux onto the sample was physically decreased by inserting baffles upstream in the beam, the denaturation could be diminished or even eliminated.
Comparisons of the radiation induced thermal denaturation of a sensitive protein (human serum albumin) in lower flux density beamlines at (a) ISA (CD1), (b) BSRF and (c) NSRRC, versus (d) the CD12 high-flux-density beamline at the SRS. Each plot represents 20 raw consecutive scans on the protein, collected at a set temperature of 4°C. The solid black lines indicate the first scan and the dashed black lines the last scan. The intermediate scans are plotted in grey. (Adapted and augmented from Miles et al. Reference Miles, Hoffmann, Tao, Janes and Wallace2007.)

Subsequently, tests on a number of other beamlines (CD1, 04B1, U11 and 4B8 – see Table 1) were undertaken (Miles et al. Reference Miles, Hoffmann, Tao, Janes and Wallace2007, Reference Miles, Janes, Brown, Clarke, Sutherland, Tao, Wallace and Hoffmann2008a; Wallace & Janes, unpublished results) (Fig. 8). They showed that the critical parameter was flux density and that at beamlines where the total flux was low or spread across a large spot size (usually by moving the sample relative to the focal point of the beam), no such degradation occurred. At very-high-flux beamlines, especially on third-generation sources, such as B23 at Diamond, initially measurements showed degradation was very rapid and significant and design modifications were needed in order to allow multiple scans on the same protein sample. Using comparisons from several beamlines with several different flux levels and spot sizes, the approximate flux density threshhold for denaturation was determined to be ~0·4×1011 photons/sec-mm2, which now is a guideline for future beamline designs (Miles et al. Reference Miles, Janes, Brown, Clarke, Sutherland, Tao, Wallace and Hoffmann2008a). Hence, unlike many other SR beamlines, such as those for macromolecular crystallography, where higher flux is usually desirable, for SRCD beamlines high flux is not necessarily optimal, and new beamlines are now being designed in ways to attenuate the flux and thereby minimise the denaturation effects.
These thermal radiation effects have important implications for different types of beamline usages: For standard spectral measurements, obtaining more than one repetitive scan is important for good practice, in order to be able to determine the reproducibility (error bar) levels; this is essential for studies comparing samples that, for example, have been modified or for which ligands have been bound. So these need to be done under conditions where the flux density does not produce differences between repeated scans. Thermal melt experiments (see Section 4.2.3) cannot be done in existing high-flux density beamlines because there will be competing/augmenting denaturation effects from the beam-induced local heating and the external macroscopic heating of the whole sample, although future development plans for many beamlines include providing means for attenuating the flux to enable such experiments. On the other hand, high-flux density will be important for stopped flow experiments (see Section 6.1.3); in those cases the dwell time within the beam will be so short that irradiation effects should be negligible during the course of the measurements.
3. Synchrotron radiation circular dichroism data analyses
3.1 Algorithms
Empirical analyses of protein secondary structures from CD and SRCD data are based on the premise that the n→π* and π→π* transitions arising from different types of secondary structures (i.e. different peptide backbone φ, φ angles) produce spectral peaks of different magnitudes and centred at different wavelengths. These techniques use CD or SRCD spectra derived from proteins with known (crystal) structures in reference data sets. Most methods are based on using proportional combinations of the component spectra in the reference data sets to reconstruct the spectrum of an unknown (query) protein; the calculated secondary structure is then derived from the secondary structure of the components used to reconstruct the unknown spectrum in the relative proportions that they contributed to the reconstructed spectra. All empirical analyses assume that the reference data sets include representative structures of the type found in the query (unknown) protein (Janes, Reference Janes2005). If that is not the case, then the analyses will fail. As an example, if there is no polyproline II (PPII)-type structure in the reference data set, and an attempt is made to analyse a collagen-type protein, then the results will be meaningless. Hence, the breadth of coverage of the reference data sets will often be more critical than the choice of algorithm in the ability to produce a correct analysis.
Over the years, a number of algorithms have been developed to undertake secondary structure calculations based on CD data. These include SELCON3 (Sreerama & Woody, Reference Sreerama and Woody2000), a self-consistent method combined with a singular value deconvolution procedure, CONTINLL, a modified version of the original ridge regression algorithm of Provencher & Glockner (1982) that incorporates the locally linearised model of Van Stokkum et al. (Reference Van Stokkum, Spoelder, Bloemendal, Van Grondelle and Groen1990), and CDSSTR, which uses a variable selection procedure and is a modified version of the original VARSLC method (Compton & Johnson, Reference Compton and Johnson1986). In addition, a number of types of neural network procedures have been developed (Andrade et al. Reference Andrade, Chacón, Merelo and Morán1993; Lees et al. Reference Lees, Miles, Wien and Wallace2006a), which are based on training derived from protein reference data sets. All of the empirical methods have been shown to produce reasonably good estimates of secondary structure composition for proteins containing standard types of secondary structures. In general, when using CD data they produce much more accurate secondary structure calculations for proteins with high helical contents. When SRCD data are included (Lees et al. Reference Lees, Miles, Wien and Wallace2006a), there is a significant improvement in the analyses of beta sheet and other types of secondary structure. A number of new algorithms (Lees et al. Reference Lees, Miles, Janes and Wallace2006b) have been developed to optimally use or be trained on SRCD data. These have been shown to produce more accurate analyses for all types of secondary structures. Besides the improved accuracy in the analyses, an additional advantage of using SRCD data in the analyses is that although knowledge of the correct spectral magnitudes has been shown to be very important for obtaining correct secondary structure analyses using any of the algorithms (Miles et al. 2005) if the very-low-wavelength data down to 170 nm is included in the analyses, knowledge of the correct magnitude is not nearly as critical for obtaining a correct result (Lees et al. Reference Lees, Miles, Janes and Wallace2006b).
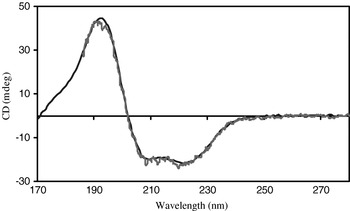
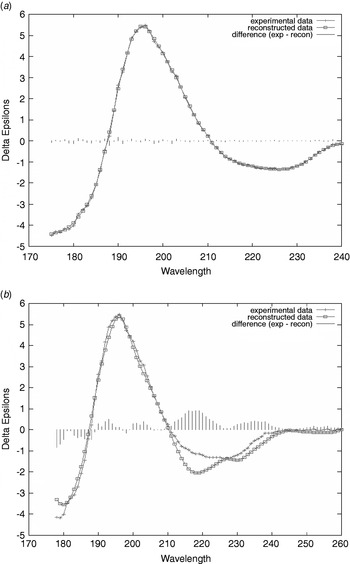
To assess how successful an analysis has been, several goodness-of-fit parameters have been introduced, the most common of these being the normalised root mean square deviation (NRMSD), which is the spectroscopic equivalent of a crystallographic R-factor (Mao et al. Reference Mao, Wachter and Wallace1982). It is defined as the square root of (the squared sum of the differences between the experimental values and the back-calculated values for the best solution at all wavelengths divided by the squared sum of the experimental values). The smaller the NRMSD value, the closer the calculated spectrum is to the experimental data; generally values less that 0·100 are considered good fits (Fig. 9). However, whilst a small NRMSD is a necessary condition for a correct solution, a low value does not necessarily mean the analysis is accurate, because multiple types of structures could produce similar solutions. Large values of NRMSD suggest that the reference data set used in the analysis may not contain the same sort of structures present in the protein under study.
Comparisons of the SRCD spectrum and spectral fits of lentil lectin analysed using the CONTINLL (Van Stokkum et al. Reference Van Stokkum, Spoelder, Bloemendal, Van Grondelle and Groen1990) algorithm at the DichroWeb server (Whitmore & Wallace, Reference Whitmore and Wallace2008) analysed with (a) the new broad-based SP175 reference data set (Lees et al. Reference Lees, Miles, Wien and Wallace2006a) designed for SRCD data and (b) reference set 1 from Sreerama & Woody (Reference Sreerama and Woody2000) originally developed for CD studies. In each case, the plot compares the experimental spectrum (solid line with crosses) with the back-calculated spectrum from the best fit analysis (solid line with squares) and includes the difference spectrum (vertical lines) to emphasize where the experimental and calculated spectra do not correspond well. The calculated values for the NRMSD parameters for (a) and (b) were 0·024 and 0·163, respectively.

3.2 Reference data sets
Until recently, the only reference data sets for empirical analyses of secondary structure were compiled (Sreerama & Woody, Reference Sreerama and Woody2000) from data collected many years ago on cCD instruments in a number of different laboratories. In general, they do not include data that extend to low wavelengths. With the advent of SRCD, it was clear that the increased information in low-wavelength data could enhance the accuracy of secondary structure determinations (Wallace & Janes, Reference Wallace and Janes2001), so new reference data sets were created independently at several beamlines to take advantage of the newly available data. At the SRS, a reference data set containing an unspecified number of proteins (their identities were also not stated) was created and used locally with the programme SELCON (Sreerama & Woody, Reference Sreerama and Woody2000) to analyse clathrin and its component proteins (Clarke & Jones, Reference Clarke and Jones1999). The improvement in the analyses reported was dramatic, but the reference data set was not made publicly available. At HiSOR, a new reference data set with first 15 proteins (Matsuo et al. Reference Matsuo, Yonehara and Gekko2004), and later with 31 proteins (Matsuo et al. Reference Matsuo, Yonehara and Gekko2005), was produced for use with SRCD measurements at that beamline. For the most part, the HiSOR data set included spectra of proteins that had also been part of the existing cCD data sets. Thus, it significantly improved their wavelength range and extended their information content, but did not greatly expand their breath of coverage of protein components. This data set was used in early ab initio calculations (Oakley & Hirst, Reference Oakley and Hirst2006). It was clear that a publicly-accessible reference data set that was applicable for data produced on all beamlines was needed to generally benefit this emerging technique. Hence, a new reference data set, which included spectral data on 71 proteins with high quality protein crystal structures and which was cross-calibrated at several SRCD beamlines (SRS, ISA, NSLS and BESSYII) was produced (Lees et al. Reference Lees, Miles, Wien and Wallace2006a). It had the specific aim of not only including high-quality low-wavelength data, but was also based on bioinformatics analyses of protein structures (Janes, Reference Janes2005) to broadly cover secondary structure and fold space. It included representatives of the types of structures seen in most proteins and included at least one member of each of the CATH-defined (Orengo et al. Reference Orengo, Michie, Jones, Jones, Swindells and Thornton1997) protein superfamilies. That data set is now available publicly on the DichroWeb calculation website (Whitmore & Wallace, Reference Whitmore and Wallace2008) (see Appendix 8.2) for use with five different analysis algorithms and has been the basis of new ab initio calculations (Bulheller et al. Reference Bulheller, Miles, Wallace and Hirst2008). Other specialist reference data sets, for denatured proteins (Sreerama et al. Reference Sreerama, Venyaminov and Woody2000), membrane proteins (Wallace et al. Reference Wallace, Lees, Orry, Lobley and Janes2003, in preparation) and proteins with crystallin-type folds (Evans et al. Reference Evans, Bateman, Slingsby and Wallace2007) have been created in recent years; the crystallins reference data set is also available on the DichroWeb site, and the membrane protein data set will be made publicly available there soon. As these SRCD-defined reference data sets are augmented in the future, they should enable increasingly more accurate secondary structure analyses and include an even wider range of protein architectures and folds.
3.3 Cluster analyses
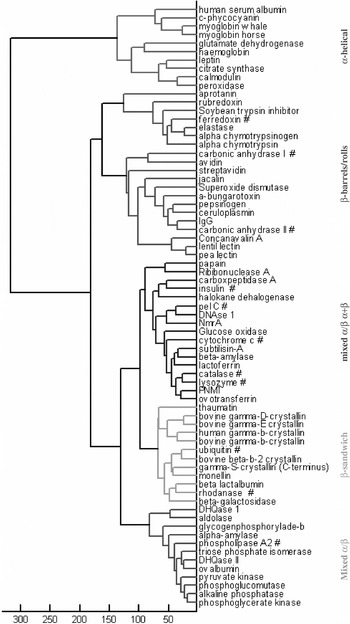
Other important developments in bioinformatics are driving new and extended analyses of SRCD data. The additional data available in the low VUV wavelength region have been shown to contain additional information, based on principal component analyses (Lees et al. Reference Lees, Miles, Janes and Wallace2006b; Toumadje et al. Reference Toumadje, Alcorn and Johnson1992). This additional information has been proposed to include information regarding the intramolecular interactions within a protein arising specifically from aspects of their supersecondary structures and their different types of folds due to the summed charge transfer transitions arising between different adjacent peptide bonds (Wallace & Janes, Reference Wallace and Janes2001). Preliminary studies using cluster analyses have identified spectral neighbours and compared them with proteins with related folds; these studies have shown that if the low-wavelength SRCD spectra are used (data down to 170 nm has been shown to be required), they cluster proteins effectively not only into groupings similar to the architecture level of CATH fold classifications (Lees et al. Reference Lees, Miles, Wien and Wallace2006a; Miles & Wallace, in preparation) (Fig. 10) but also can further discriminate between topological classes in some cases. This classification is a type of fold recognition based on spectral properties alone (no information input about sequence or crystal structure). Information on spectral nearest neighbours could have applications in molecular modelling and even might be able to help identify related structures that could be used for molecular replacement in protein crystallographic studies.
Cluster analysis showing proteins can be grouped into similar CATH classes/architectures based on their SRCD spectra alone (without inclusion of any sequence or crystal structure data). (After Lees et al. Reference Lees, Miles, Wien and Wallace2006a.)

3.4 Ab initio calculations
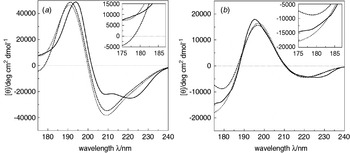
To date, most calculations of secondary structure based on CD spectra have used empirical methods based on reference data sets derived from spectra of proteins of known structures. However, a number of studies have undertaken theoretical calculations based on first principles in attempts to produce CD, and now SRCD, spectra for proteins of known structure (see a review by Woody, Reference Woody and Fasman1996). Over the years, a number of ab initio methods have been developed to compute the far-UV CD spectra of proteins for the peptide n→π* and π→π* transitions. Experimental helical spectra are particularly well reproduced based on such methods. Other ab initio calculations aimed to match only the magnitude at 220 nm (Besley & Hirst, Reference Besley and Hirst1999). However, such single point fits can be misleading given that the magnitude at a single point is one of the least well determined aspects of a spectrum (because of errors in protein concentrations and pathlengths). More recently, the contribution of charge-transfer transitions to the calculated VUV spectra have been explored (Bulheller et al. Reference Bulheller, Miles, Wallace and Hirst2008; Bulheller & Hirst, Reference Bulheller, Hirst, Wallace and Janes2009; Oakley & Hirst, Reference Oakley and Hirst2006). The full SRCD spectra of first 31 (Oakley & Hirst, Reference Oakley and Hirst2006) and then 71 proteins (Bulheller et al. Reference Bulheller, Miles, Wallace and Hirst2008) were calculated based on their atomic coordinates and compared with the corresponding experimental spectra (Lees et al. Reference Lees, Miles, Wien and Wallace2006a; Matsuo et al. Reference Matsuo, Yonehara and Gekko2005). The inclusion of inter-peptide charge transfer information appears to improve the correlation with experimental data at 175 nm, although there are still significant differences both at high and low (~160 nm) wavelengths for many of the proteins (Fig. 11). A webserver, DichroCalc, based on these methods is available at http://comp.chem.nottingham.ac.uk/dichrocalc/ for the back-calculation of CD spectra derived from ab initio calculations.
Comparisons of experimental spectra (solid) and ab initio-calculated SRCD spectra for (a) haemoglobin and (b) lentil lectin, showing the effects at low wavelengths when charge transfer contributions are included (dotted) and not included (dashed). (Reprinted from Bulheller et al. Reference Bulheller, Miles, Wallace and Hirst2008.)

4. Synchrotron radiation circular dichroism applications for the study of proteins
The high flux and low wavelengths achievable using synchrotron radiation as the light source for SRCD and the flexible sample geometry at SRCD beamlines enable a number of new types of applications for the characterisation of protein structure and function. These features also enable SRCD to extend the types of protein samples that can feasibly be examined. In this section, the different types of samples that can be characterised will be discussed first; this will then be followed by descriptions and examples of the new and improved types of studies that are enabled by SRCD.
4.1 Sample types
4.1.1 Soluble proteins
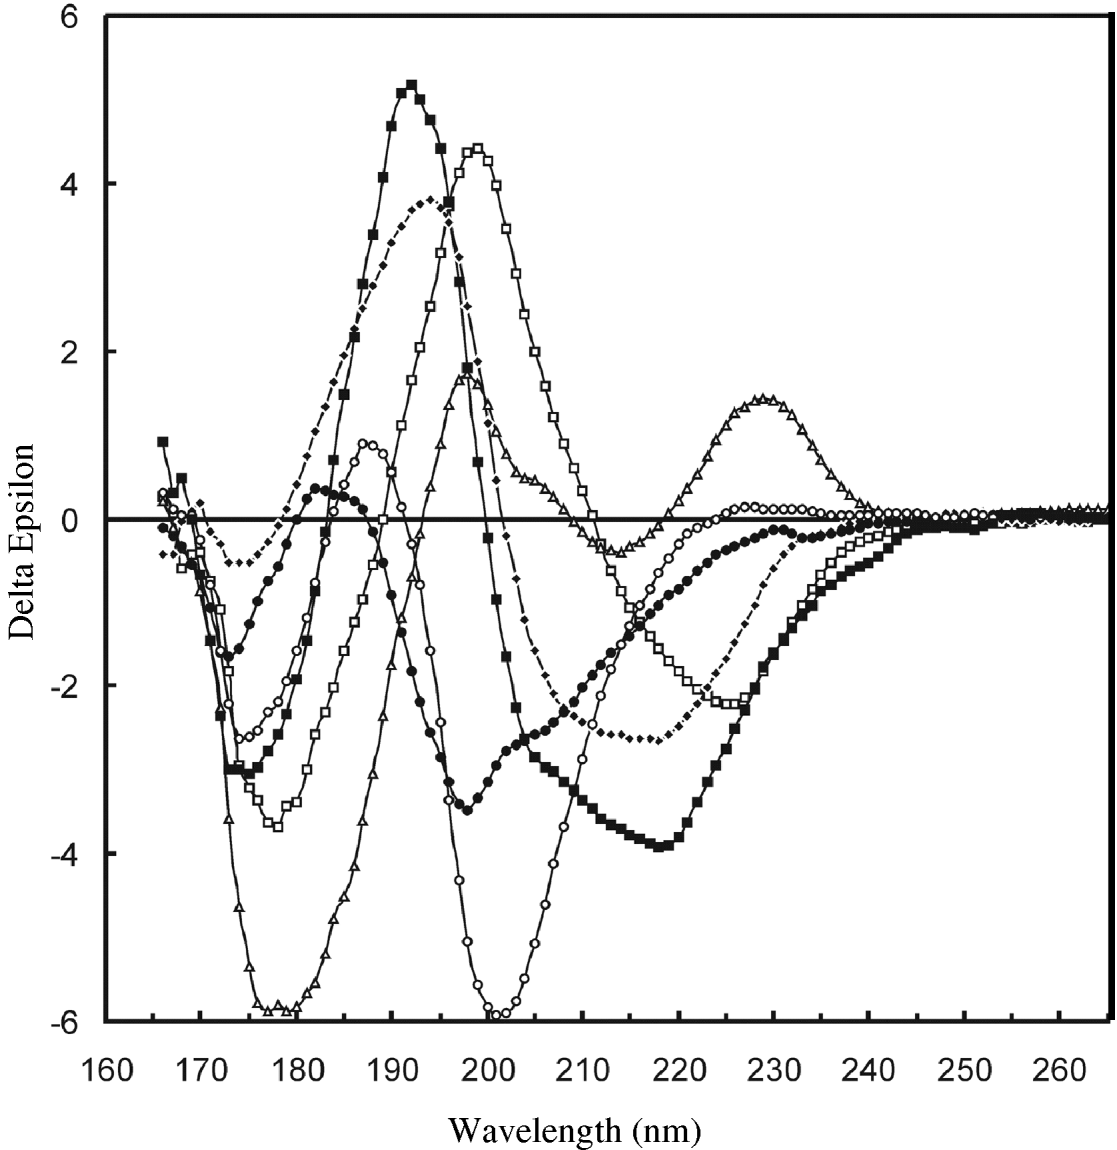
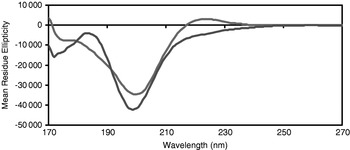
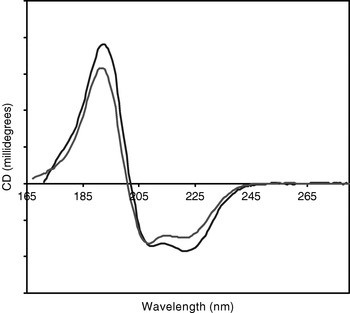
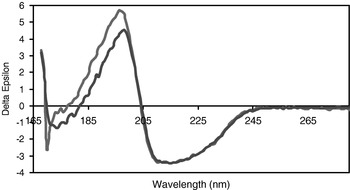
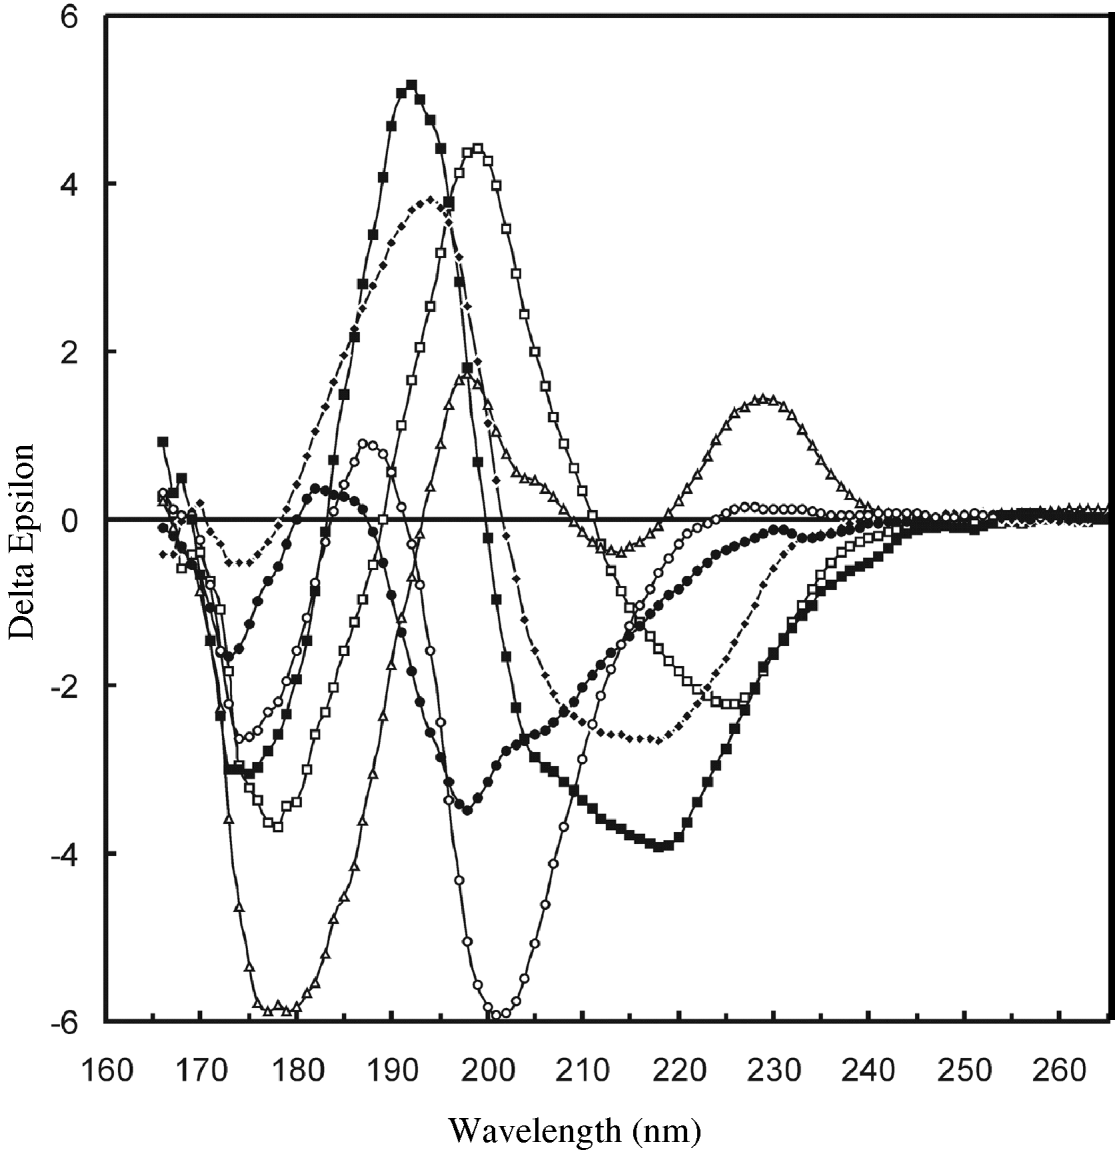
CD spectra of soluble proteins exhibit well-known characteristics associated with the principal types of secondary structure present (Fig. 2). In the far-UV wavelength range, mostly helical proteins produce spectra with two negative peaks around 208 and 222 nm and a large positive peak around 190 nm. The spectra for mostly beta sheet proteins are much more diverse (Sreerama & Woody, Reference Sreerama and Woody2003; Wallace et al. Reference Wallace, Wien, Miles, Lees, Hoffmann, Evans, Wistow and Slingsby2004) (Fig. 12), but generally exhibit a single negative peak around 215 nm and a positive peak around 195 nm that is roughly of the same magnitude as the negative peak. The peaks arising from beta sheet structures are much less intense than those from helical structures, and this is one of the reasons that analyses of protein sheet content is generally less accurate than analyses of their helical contents (especially if there is a small sheet content in the presence of helix, which results in the sheet signals being ‘swamped’). The spectra of PPII-rich proteins are generally relatively featureless in the far-UV region above 210 nm (although they often have a small positive peak around 220 nm); they do, however, have a large negative peak around 200 nm (Miles & Wallace, Reference Miles and Wallace2006; Sreerama & Woody, Reference Sreerama and Woody1994). Spectra of proteins without large amounts of ordered structure (often called natively disordered or unfolded proteins or previously referred to as being ‘random coils’) tend to have no positive peaks and a single broad negative peak at around 195–198 nm and often with a small positive peak (or negative minimum) at around 180–185 nm. They can have a somewhat similar appearance to a PPII spectrum except the negative peak may be slightly blue-shifted (Fig. 13). Because the peaks due to PPII and disordered or ‘other’ structures are similar and have minima at wavelengths near the low-wavelength data collection limit for CD spectra, they too are often more poorly defined by secondary structure calculations than are helical structures.
SRCD spectra of beta sheet-rich proteins showing the diversity of spectral characteristics associated with different folds. The proteins shown are: concanavalin A (open squares), avidin (open triangles), elastase (filled circles), beta-galactosidase (filled diamonds), soybean trypsin inhibitor (open circles) and βB2-crystallin (filled squares). (Adapted from Wallace et al. Reference Wallace, Wien, Miles, Lees, Hoffmann, Evans, Wistow and Slingsby2004.)
Comparison of the SRCD spectra of a disordered protein (red) with that of a PPII-rich protein (blue). (Miles, Richards & Wallace, unpublished data). It should be noted that the spectra of unfolded disordered proteins vary significantly depending on the conditions used for unfolding, and the reader is refereed to Matsuo et al. (Reference Matsuo, Sakurada, Yonehara, Kataoka and Gekko2007) for examples of different unfolded proteins.

Because there is no such single entity as a ‘random coil’ type of secondary structure, it is unlikely that there will be a single exemplar of a disordered spectrum that can be used in reference data sets employed in empirical analyses. Using SRCD, Matsuo et al. (Reference Matsuo, Sakurada, Yonehara, Kataoka and Gekko2007) examined the different types of structures and spectra produced under different types of denaturation conditions (acid, cold, chaotropic agents and heat). The spectra produced under these conditions were distinctly different, confirming that there are different end points in the processes of unfolding resulting in different ‘denatured’ structures, depending on the conditions used for denaturation. Indeed, when the SELCON3 analysis algorithm was applied to the different spectra, it identified that in a number of cases there was still a significant amount of helix or sheet present. For this study, SRCD was particularly valuable for two reasons: (1) the low-wavelength peaks around 190–200 nm were easily detectable and distinguishable and (2) even in the highly absorbing chaotropic agent guanidine hydrochloride, measurements were possible to wavelengths below 200 nm. At present several reference data sets (Sreerama et al. Reference Sreerama, Venyaminov and Woody2000) include ‘denatured’ protein spectra, although inclusion of proteins treated in only one of the above manners to represent ‘unordered’ or ‘other’ types of secondary structure may not be sufficiently complete for reference data sets used in secondary structure analyses.
SRCD extends the spectral wavelength range to VUV wavelengths where not only are the existing transitions more complete, but also additional transitions can be detected (Fig. 2). This enables an improved distinction of beta sheet contributions from helical ones, since at low wavelengths the sheet and helix signals have opposite signs (Miles & Wallace, Reference Miles and Wallace2006). The low-wavelength peaks also show a rich diversity between proteins with different types of beta sheet structures, including parallel and antiparallel sheets, sheets with different twists, strands with different sheer, and barrels with different staggers (Wallace et al. Reference Wallace, Wien, Miles, Lees, Hoffmann, Evans, Wistow and Slingsby2004) (Fig. 12). In addition, SRCD spectra are also particularly good for discriminating between examining natively disordered proteins (Guerra-Giraldez et al. Reference Guerra-Giraldez, Moore, Neves, Wallace, Svergun, Brown and Smith2005) and ones with significant amounts of PPII, such as collagen (Miles & Wallace, Reference Miles and Wallace2006). Not only can this be useful for qualitative visual assessments of the spectra for secondary structure, the additional data result in a higher information content (Lees et al. Reference Lees, Miles, Wien and Wallace2006a; Toumadje et al. Reference Toumadje, Alcorn and Johnson1992; Wallace & Janes, Reference Wallace and Janes2001) than present in conventional CD spectra, which in turn means that additional types of protein secondary structural components (such as 310 helices and turns) can be computationally-derived from the data (Lees et al. 2006b). Hence, SRCD can enhance the utility and accuracy of secondary structure determinations of soluble proteins, especially those with beta sheet and PPII compositions.
4.1.2 Membrane proteins
Membrane proteins are notoriously difficult to examine by CD spectroscopy due to artefacts arising from absorption flattening (Wallace & Teeters, Reference Wallace and Teeters1987), differential scattering (Wallace & Mao, Reference Wallace and Mao1984) and wavelength shifts (Cascio & Wallace, Reference Cascio and Wallace1995; Wallace et al. Reference Wallace, Lees, Orry, Lobley and Janes2003). These effects result because membrane proteins are not surrounded by a uniform and isotropic aqueous solution, but are rather embedded in hydrophobic and anisotropic phospholipid bilayers or detergent micelles. SRCD has proven to be particularly useful in obviating each of these potential issues for several reasons.
4.1.2.1 Absorption flattening
Absorption flattening arises from the non-uniform distribution of chromophores in a membrane sample. This distribution is because although the proteins may (or may not) be randomly distributed within the membrane particles (vesicles, liposomes or bicelles) and the membrane particles may be randomly distributed throughout the sample volume, the proteins are not uniformly distributed throughout the sample, being sequestered into areas occupied by the particles. This means that the major tenet of Beer's law which requires the random distribution of absorbers throughout the sample is not met. The consequence is that each of the absorbance peaks will be depressed with respect to what it would have been for the equivalent protein in an isotropic solution. Furthermore, the more intense the absorbance, the more depressed in magnitude is the peak (Teeters et al. Reference Teeters, Eccles and Wallace1987).
This effect can be eliminated in principle if the lipid-to-protein molar ratio is sufficiently high such that there is only a single protein present in each particle. To achieve this, lipid-to-protein molar ratios of ~2000 or more may be needed, depending on the size of the particle. However, such samples are normally difficult to measure by cCD because whilst lipids generally do not produce significant CD signals, they do absorb to a major extent at wavelengths in the far-UV due to the electronic transitions of the carbonyl groups linking their fatty acid chains and head groups. As a result, the total amount of light that penetrates a liposome sample containing high concentrations of lipids will be very small, so the signal-to-noise levels in both the left- and right-handed circularly polarised signals will be very low, producing a very noisy net CD spectrum. When coupled with a need to keep the protein concentration low (again to maintain the high lipid-to-protein ratio), the polypeptide CD signal tends to be unmeasureable. However, because the absolute amount of penetration of light is higher when using a SRCD beamline, membrane protein samples can often be measured with good fidelity and signal-to-noise levels. A demonstration of this was the study of opsin in bicelles (McKibbin et al. Reference Mckibbin, Farmer, Jeans, Reeves, Khorana, Wallace, Edwards, Villa and Booth2007) where SRCD permitted such measurements and samples with lipid-to-protein molar ratios of ⩾1000. Indeed such studies enabled detection of subtle differences in protein structure associated with the reconsititution of the protein in different lipids. Such a study would not have been viable using cCD.
4.1.2.2 Differential scattering
Differential scattering is an artefact that arises when the size of the object under examination is large (>1/20) relative to the wavelength of light being used for the observation (Gitter-Amir et al. Reference Gitter-Amir, Rosenheck and Schneider1976; Wallace & Mao, Reference Wallace and Mao1984). As a result, the particles (in the case of membrane proteins these are usually vesicles or liposomes) tend to scatter light other than in the forward direction, which then falls outside the acceptance angle of the detector. Because the standard geometry of most cCD instruments places the sample relatively far from the detector and the detector face is relatively small, this can result in an acceptance angle as small as 6°, which, even for small lipid vesicles means that much of the light never reaches the detector. If the scattering is from a chiral object (i.e. the vesicle includes a protein), then the scattering will be different for the left- and right-handed circularly polarised light because the refractive indices for the two light hands are different, giving rise to a distorted CD spectrum. This can have severe consequences for the spectral shape and the subsequent analyses (Wallace & Mao, Reference Wallace and Mao1984). Non-chiral objects in the solution (i.e. vesicles not containing protein) will also scatter light, but in this case equally for both handed types. Although this does not change the spectral shape it will also produce a lower signal-to-noise level. To overcome the scattering effects, either samples with smaller particle sizes (i.e. in detergent micelles instead of lipid bilayers) or changes to the instrument geometry are required. The former solution can be problematic if the protein does not have the same conformation in lipids as it does in detergents (quite often the case). However, the latter solution to the problem can be attained by changing the instrument geometry by modification of the sample chamber and detector; this is possible in some commercial instruments (i.e. those made by Aviv Biomedical). However, as most SRCDs already have a large detection angle automatically incorporated into their designs and tend to have larger detector faces, SRCD beamlines greatly reduce the differential scattering problem for membrane protein samples.
4.1.2.3 Wavelength shifts
Because the dielectric constants of the hydrophobic fatty acid chains of lipids or the hydrophobic tails of amphipathic detergent molecules in which membrane protein transmembrane segments are embedded, are very different than the dielectric constant of the aqueous milleux of soluble proteins, the energy difference between the ground and excited states of the transitions, and therefore the peak positions in the spectra, of membrane proteins and soluble proteins can differ considerably (Cascio & Wallace, Reference Cascio and Wallace1995; Chen & Wallace, Reference Chen and Wallace1997; Park et al. Reference Park, Perczel and Fasman1992). This can result in significant differences in the spectra of membrane proteins and soluble proteins, even when they have arisen from proteins with the same secondary structure content (Fig. 14). Furthermore, when membrane protein spectra are analysed using reference data sets derived from soluble proteins (Wallace et al. Reference Wallace, Lees, Orry, Lobley and Janes2003), the results are often incorrect. Because the peak shifts for the different transitions are of different magnitudes and signs, the problem cannot simply be alleviated by shifting the whole spectrum by the same amount in nm. Neither can it be reduced by converting the spectra to energy units and shifting all transitions by the same amount in energy terms (Cascio & Wallace, Reference Cascio and Wallace1995).
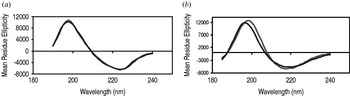
Comparisons of the calculated fits (blue) of (a) a soluble protein (concanavalin A) and (b) a membrane protein (FepA), with their experimental SRCD spectra (red), both analysed using a reference data set derived from soluble proteins. These two proteins were chosen for comparison because they had very similar net secondary structures. (After Wallace et al. Reference Wallace, Lees, Orry, Lobley and Janes2003.)

SRCD has been advantageous with respect to studies assessing the extent of the wavelength shift for several reasons: (1) The SRCD spectra can be measured in the detergents and lipids that membrane proteins require for solubility, (2) the spectra have higher signal-to-noise levels so subtle shifts can be more easily detected, and (3) the lower wavelength data in the VUV region enables the observation of the complete peaks for all three n→π* and π→π* peptide transitions.
This has led not only to the creation of a new membrane protein reference data set using SRCD data, with significant improvements for the analysis of membrane protein spectra, but also to the development of methods for the separate identification of transmembrane and extramembrane secondary structural elements (Abdul-Gader, Miles & Wallace, unpublished results). The latter significantly increases the information content derivable from a spectrum as it, for instance, could identify that of the 50% helix content of a protein, the transmembrane region may be nearly 100% helical whilst the extramembranous region may be only 30% helical. This can also enable identification of whether conformational changes occur in the transmembrane or extramembrane domains, again an increase in information with respect to that obtainable by CD spectroscopy.
4.1.2.4 Lipid/protein ratios
In order to detect the signals due to the polypeptide, in cCD, the lipid-to-protein molar ratios are normally maintained at reasonably low levels (i.e. 50:1 – or in some cases even less). This can however, be problematic (in addition to the absorption flattening effect described above), since proteins and peptides at such high levels can either tend to lyse the membranes or form aggregates within the bilayers. SRCD can mitigate against these problems by enabling the use of much higher (up to 102 times as high) lipid ratios. This is because of the high flux, which even when the transmission is attenuated by the absorbance of the lipid component, enables sufficient light to reach the detector to result in a reasonable signal-to-noise ratio. Hence, SRCD spectra can readily be measured down to wavelengths of 180 nm in small unilamellar lipid vesicles with lipid-to-protein mole ratios even as high as 2000:1 (Miles & Wallace, unpublished).
As an example of how this has been useful, it was possible to examine the eukaryotic cytolysin equinatoxin II in liposomes of various compositions, enabling the identification of the lipid features essential for binding interactions (Miles et al. Reference Cowieson, Miles, Robin, Forwood, Kobe, Martin and Wallace2008). This protein lyses membranes when present at high concentrations. However, the high lipid-to-polypeptide ratios achievable for SRCD measurements (250:1) enabled the examination the protein in intact (not lysed) liposomes. These studies were all only possible using SRCD instrumentation (indeed the study had been attempted unsuccessfully in advance using conventional CD, in case it would not have been necessary to use valuable SRCD beamtime for the experiment, but the signal was too small and noisy to permit any conclusions). However, the SRCD study produced high quality data that enabled the comparison of membrane-bound and soluble forms of the polypeptide and the identification of the importance of sphingomyelin in the lipid mixture to enable the toxin to adopt a folded, active conformation.
4.1.3 Fibres
Proteins that are associated as ordered aggregates in the form of fibres have been the subject of CD studies over many years. At issue for this type of sample, as for membrane proteins, are artefacts of absorption flattening and differential scattering. Both phenomena are highly dependent on the geometry of the fibres (the axial ratios and the dimensions relative to the wavelength of the probing light). Naturally occurring wildtype fibrous proteins range from collagen (Miles & Wallace, Reference Miles and Wallace2006) (where the dimensions of the three-stranded PPII helices are relatively small and in this regard are non-problematic with respect to scattering) to large aggregates such as the beta-sheet forming spider silk fibroin proteins (Dicko et al. Reference Dicko, Knight, Kenney and Vollrath2004) (which have macroscopic dimensions) so SRCD has been important because of both light penetration and the large angle detection geometry.
A potential concern for CD studies of fibres is that they can orient with respect to each other and the incoming light, thereby producing a linear dichroism (LD) signal that will underlie the observed CD signal. For those reasons, simultaneous or sequential measurement of CD and LD is important and can be most facilely done on an SRCD beamline with a simple electronic switch (see Section 6.1.2). The ability to orient can, however, be exploited using the method of SRLD, in which elongated samples are purposely oriented in a flow couette. This potentially very useful method for studying fibrous as well as membrane proteins in vesicles has been described in detail by Rodgers (Reference Rodger, Wallace and Janes2009). Such technology is currently operational as an option at the ISA CD1 and UV1 beamlines and has already been used in studies of spider silk fibres (Dicko et al. Reference Dicko, Hicks, Dafforn, Vollrath, Rodger and Hoffmann2008).
In recent years, a major area of protein research has been the study of peptides and proteins that form aggregate or ordered super-structures, including prions, amyloids or certain other misfolded proteins. A large number of neurodegenerative diseases (such as the transmissible spongiform encephalopathies and Alzheimer's disease) have been associated with misfolding, association and aggregation of proteins and peptides. In many of these cases, the proteins are not ‘unfolded’, but have regular secondary structures, mostly beta sheet in the aggregate forms, and may undergo conformational changes from helical structures to beta sheets, which then form insoluble fibrils with crossed-beta supersecondary structures. In some cases, mutant versions of proteins (such as lysozyme) can cause non-neuropathic amyloidosis. SRCD studies on dried fibrillar aggregates of wildtype lysozyme (Nesgaard et al. Reference Nesgaard, Hoffmann, Andersen, Malmendal and Otzen2008) have been used to suggest these fibres may differ from classical amyloid fibrils formed from mutant proteins.
Other forms of fibrils and prion peptides are obvious candidates for future SRCD studies that should benefit from both the SRCD detector geometry and the capabilities for linear dichroism detection.
4.1.4 Natively disordered/unfolded proteins
An area currently of substantial interest in biology is that of ‘natively disordered’ or ‘intrinsically unfolded’ proteins. Such proteins, which are composed of regions (or in some cases almost entire proteins) where there is no regular secondary structure, have been proposed to play important roles in signalling, intermolecular interactions and molecular recognition processes. Whilst proteins with significant amounts of disorder can be refractory to crystallisation or NMR characterisation, they are entirely suitable for CD analyses. In one proteomics study using CD to examine proteins with unknown function from the small genome of Mycoplasma genitalium (Balasubramanian et al. Reference Balasubramanian, Schneider, Gerstein and Regan2000), a number of the proteins expressed were found to be partially or completely unstructured. With SRCD, this sort of study could be extended to larger genomes and less readily expressed proteins.
SRCDs could be particularly useful for studies of intrinsically unfolded proteins because the signature spectrum of an ‘unfolded’ or ‘random coil’ structure is best identified in the low-wavelength region below 200 nm. As a result, SRCD spectroscopy can quantify the amount of disordered structure present because the low-wavelength ‘unordered’ peaks can be more accurately deconvoluted from the higher wavelength peaks primarily associated with ordered secondary structures such as helices, sheets and turns.
4.1.5 Glycoproteins
Glycosylation is an important feature of proteins for their function, localisation and folding. However, there currently is a paucity of detailed information on the carbohydrate components of glycoproteins because many X-ray and NMR studies of glycoproteins tend to remove the carbohydrate components (either by chemical/enzymatic treatment or by producing constructs that do not glycosylate) before characterisation. In the few cases where the carbohydrates are retained and attached to the proteins, they are most often found to be disordered or not well defined in the crystal structures. However, SRCD provides a very simple way of examining sugar structures present when they are attached to glycoproteins (Cronin et al. Reference Cronin, O'Reilly, Duclohier and Wallace2005).
Until recently, the carbohydrate components of glycoproteins have been ignored in circular dichroism spectroscopic studies because their spectral transitions tend to begin at wavelengths below 190 nm, a region where conventional laboratory-based CD instruments have generally been unable to measure data accurately. In addition, the molar elliptical extinction coefficients of sugars are small, so their detection depends on having a highly sensitive spectroscopic method, such as SRCD. In one sense, this has been fortunate, as the carbohydrate contributions have not actually interfered with analyses of protein CD spectra in the far-UV region; however, it does means that the information present at lower wavelengths is only just now starting to be exploited for studying the nature and roles of the carbohydrate components of macromolecules.
Ironically, although not pursued in a glycoprotein context, sugars were amongst the first biomolecules investigated by SRCD (Arndt & Stevens, Reference Arndt and Stevens1993). Unfortunately the quality of the early data was not very good, resulting in noisy spectra that were difficult to interpret. However, more recent studies on monosaccharides and disaccharides (Matsuo & Gekko, Reference Matsuo and Gekko2004) and amino sugars (Cronin et al. Reference Cronin, O'Reilly, Duclohier and Wallace2005) have shown they have distinct and measurable spectra in the VUV region.
An example of how SRCD can be useful in examining the structure/function relationships of a glycoprotein comes from studies on native and deglycosylated voltage-gated sodium channels isolated from the electric eel (Cronin et al. Reference Cronin, O'Reilly, Duclohier and Wallace2005). As the sugar components and their relative compositions were known, and the exemplar spectra of each component could be obtained, the isolated sugar spectra were summed in the correct proportions to determine their contribution to the glycoprotein spectrum. This contribution was then subtracted from the glycoprotein spectrum and the resulting spectrum compared with the experimental spectrum of the deglycosylated (enzymatically removed) form of the channel. This study showed that the protein secondary structure was unaltered upon removal of the carbohydrate component (even though it contributed more than 30% of the mass of the native protein). Parallel functional studies showed that the deglycosylated channels were still active. Hence, this SRCD study led to the important conclusion that the deglycosylated form of this membrane protein was a viable substitute for the native form and could be used in other structure/function studies. Similar studies should be possible on both soluble and other membrane proteins.
4.1.6 Non-aqueous solutions
A major limitation on the ability to obtain data in the very low VUV wavelength range when using SRCD spectroscopy is due to the presence of water, which has a strong absorption peak near 168 nm. Even though the water absorption is not chiral, it does severely limit both the left- and right-circularly polarised light being transmitted because of the relatively large molar excesses of water relative to protein in any aqueous solution. To circumvent this, several methods have been employed to prepare samples for SRCD studies with reduced or no water content. They include decreasing the pathlength of the sample cell whilst increasing the protein concentration (see Section 2.1.3) or the use of dehydrated or partially hydrated films (described in the next section). An alternative has been to use organic solvents that do not absorb strongly in this wavelength range instead of water. Solvents such as acetonitrile and 2,2,2-trifluoroethanol (TFE) have been shown to have improved absorbance profiles in the VUV range relative to water (Wien & Wallace, Reference Wien and Wallace2005) (Fig. 4b) and permit data collection to lower wavelengths. However, the principal issue with the use of non-aqueous solvents to examine proteins and peptides is whether or not they cause the protein to adopt a non-native conformation because of their different solvation properties and dielectric constants. SRCD spectra of myoglobin in both TFE (Thulstrup et al. Reference Thulstrup, Brask, Jensen and Larsen2005) and hexafluoroisopropanol (Clarke & Jones, Reference Clarke and Jones2004) have been collected to wavelengths below 169 nm. However, whilst the protein retains a significant alpha-helical content in these media, the spectra clearly differ significantly from that of native myoglobin in water (Wallace & Janes, unpublished results) (Fig. 15), with changes to both peak positions and peak magnitudes suggesting that the protein is at least partially unfolded in these solvents. This suggests an important caution: it is tempting to look at the spectrum of a protein or peptide in a non-aqueous helix-inducing solvent such as TFE and see that the polypeptide is helical and therefore assume it is folded. However, as the authors in the two studies cited above did, before deriving any conclusions from SRCD spectra in non-aqueous media it is important to apply the critical test of comparison of the protein in water and the other solvent in the far-UV (or other spectral) regions where measurements in both solvent can be undertaken, to ascertain if there are any significant differences.
Comparison of SRCD spectra of myoglobin in aqueous solution (blue) and in 2,2,2,-trifluorethanol (red).

Hence, the use of organic solvents enables VUV data collection, but often at the price of altering the protein conformation. So unless there is a specific question about the conformation of a protein in a particular solvent, even though enabling for data collection, the biological relevance of such SRCD studies need to be interpreted with caution.
4.1.7 Films
As an alternative to non-aqueous solvents, in order to access the very-low-wavelength data, some studies have examined dehydrated proteins in thin films. These have permitted data collection to wavelengths below 160 nm and are complementary to aqueous studies, but as the sample no longer contains water, this type of preparation may also lead to concerns about its biological relevance. Nevertheless, these studies have been useful in defining the extent of additional information present in the very-low-wavelength transitions.
The most frequently examined system has been of the two enantiomers of an amino acid (alanine is the most commonly examined) to show that the expected mirror-image spectra can be obtained (Fukayma et al. Reference Fukuyama, Matsuo and Gekko2005; Tanaka et al. Reference Tanaka, Yagi-Watanabe, Yamada, Kaneko and Nakagawa2006; Yamada et al. Reference Yagi-Watanabe, Tanaka, Yamada, Kaneko, Nakagawa and Yuri2005). Spectra superimposed on the equivalent spectra obtained on cCD instruments in the high-wavelength (far-UV) region, confirming the identities of the compounds and the calibrations of the SRCD beamlines. In addition, measurements to wavelengths as low as 120 nm were achievable in the SRCDs, although a number of the spectra were noisy in the region below 160 nm. However, often no accompanying HT or absorbance spectrum was published that would enable evaluation of whether there was sufficient light throughput for the measurements to be meaningful.
More recently, films of dried protein samples have been examined (Fig. 6) (Nesgaard et al. Reference Nesgaard, Hoffmann, Andersen, Malmendal and Otzen2008; Wallace & Janes, unpublished). Without the water solvent present, protein spectra can be measured to wavelengths below 130 nm, enabling the detection of several additional transitions. Whilst for some proteins, the spectrum of the dried sample is very similar to the hydrated protein (in the regions above 170 nm, where both are measureable), in other cases, they deviate significantly, signifying that the process of dehydration is having a (denaturing) effect on the protein integrity, and so any structural conclusions based on the films must bear this in mind.
The spectra of films are very rich in information and, for simple small molecules, can be directly interpreted based on time-dependent density functional theory calculations (Fukuyama et al. Reference Fukuyama, Matsuo and Gekko2005). However, for dried films of macromolecules, in addition to the above noted concerns about the protein's integrity, spectroscopic considerations resulting from the effects of orientation and interaction of the sample with the substrate become significant. As a result, analyses of proteins either in films or oriented on surfaces such as phospholipid bilayers become complex due to the anisotropic nature of the transition vector orientations. In addition, significant linear dichroism signals may underlie the CD signals, so separation of the phenomena may be problematic. To date there has been little work done on ab initio calculations of macromolecular spectra at these wavelengths, but this is a potentially-important future opportunity and challenge for the field.
4.2 Examples of SRCD-enabled applications
4.2.1 Detecting macromolecular complex formation
One contribution SRCD can make in Systems Biology is the investigation of interactions that occur between macromolecules. How proteins interact and form complexes with other proteins, nucleic acids and carbohydrates provide important clues as to their roles in the cascade of functional and developmental events in the cell. Several studies have indicated new ways in which SRCD can add to the cadre of methods which detect complex formation and the definition of the structural consequences that occur upon binding their macromolecular partners.
4.2.1.1 Complex formation involving natively disordered structures
Bioinformatics analyses on the human genome (Edwards et al. Reference Edwards, Lobley, Pentony and Jones2009) suggest there is a significant population of proteins that contain disordered regions. These elements may be critical to some types of complex formation, and that when they interact with binding partners (either macromolecules or smaller biological partner molecules such as lipids or carbohydrates), they will partially or completely refold to form a stable complex. Sometimes the changes involve relatively small regions of their structures. Often, the changes are subtle, and because they involve comparisons of differences of differences [i.e. the difference between the spectrum of protein A plus the spectrum of protein B (scaled by the appropriate proportions due to their relative molecular weights) and the spectrum of the protein A plus protein B complex (in stoichometric ratios)], their accurate detection requires a good signal-to-noise ratio, as well as a reasonably high binding constant. Hence, SRCD can be particularly valuable due to its high sensitivity.
One example of such an interaction detected by SRCD is the structural consequences of binding the C-terminal unordered peptide of rhodopsin to its binding partner arrestin (Wallace & Hargraves, unpublished data; Wallace & Janes, Reference Wallace and Janes2010). The difference of the difference in this case shows that upon complex formation, there is a large gain in helical content. Because the arrestin component is already folded before the interaction, the result obtained could be interpreted as corresponding to the equivalent of nearly 100% of the peptide component changing from disordered to helical structure. A complication can sometimes come in interpreting the results if both partners are proteins; then the mutual changes that occur are overlapping, resulting in a net change, so it is often difficult or impossible to ascribe which partner underwent the change. If, however, one partner starts as completely unordered and the other is substantially ordered and the spectrum of the complex is more ordered than the other partner is originally, as in the arrestin/rhodopsin case, assumptions can be made about the changes to the individual partners. In cases where the binding partner is non-peptidyl, the interpretation is much simpler (assuming there is no induced CD in the partner, a relatively rare occurrence) because all changes seen at these wavelengths will be due to the protein component. Another example of detecting such a complex formation by SRCD is the SHERP protein, a cell-surface protein involved in the disease leishmaniasis (Guerra-Giraldez et al. Reference Guerra-Giraldez, Moore, Neves, Wallace, Svergun, Brown and Smith2005). In this case, the protein is completely unfolded, but in the presence certain lipid partners folds to an almost entirely helical structure. Because the lipids and detergents do not produce any chiral absorbance in the UV wavelength range, all the change is attributable to the protein.
These examples suggest that SRCD can be a valuable technique for monitoring disorder-to-ordered transitions, and the enhanced speed of data collection means that reasonably high-throughput screening of potential binding partners may be possible.
4.2.1.2 Complex formation involving tertiary changes
Traditionally, far-UV CD spectroscopy has only been useful for detecting conformational changes involving net changes in secondary structures, as the wavelengths monitored tend to be dominated by peptide backbone transitions. Sometimes tertiary interactions can be detected in the near-UV region when they involve changing the environment of aromatic amino acids, but these measurements are difficult due to the very low extinction coefficients of the aromatic absorbances and the small number of aromatic residues in proteins, which mean that the spectral magnitudes tend to be two or more orders of magnitude lower than the backbone transitions. Measurements can be made in this wavelength region using either cCD or SRCD; however, they require the use of long pathlength cells and large volumes and amounts of protein and they are often difficult to interpret in terms of structural changes. Recently, however, it has been shown that SRCD can be used to detect complex formations involving only tertiary interactions without changes in secondary structures, due to changes detectable in the VUV range (Cowieson et al. Reference Cowieson, Miles, Robin, Forwood, Kobe, Martin and Wallace2008). In this study, the two proteins examined had known crystal structures as separate proteins and as components of a crystal structure of the binary complex. They were chosen because the proteins in isolation and in the complex had the same secondary structures, so complex formation involved rigid-body interactions. It was observed that although there were no differences detectable in the far-UV region of the spectrum of the complex relative to the spectrum derived from summed spectra of the individual proteins, in the VUV region below 190 nm, distinct and significant changes could be measured by SRCD (Fig. 16) but not by cCD.
Detection of rigid-body complex formation by SRCD spectroscopy. Experimental spectrum (red) of the complex of latexin and carboxypeptidase compared with the summed spectra (blue) of the individual proteins. (Data from Cowieson et al. Reference Cowieson, Miles, Robin, Forwood, Kobe, Martin and Wallace2008.)

From the above examples it can be seen that SRCD can enhance the ability to detect complex formation not only by detecting smaller conformational changes as a result of its enhanced sensitivity, but also because the additional information at lower wavelengths can be accessed and provide novel information on intermolecular interactions. It thus enables the detection of complex formation involving both induced fit mechanisms (involving secondary structural changes of one or more of the components), plus rigid body complex formation (involving tertiary changes and intermolecular interactions such as aromatic associations and in some cases hydrogen bond formation), thereby extending the types of complex formation that can be monitored by CD spectroscopy.
4.2.2 Identifying ligand binding
One of the most common uses of CD is the examination of conformational changes in a protein as a function of ligand and drug binding (Wallace & Janes, Reference Wallace and Janes2003). SRCD is advantageous for such studies due to the high signal-to-noise levels which enable the detection of smaller more subtle changes, the use of absorbing (non-chiral) additives or ligands to achieve the changes and the detection of conformational differences involving spectral changes at lower wavelengths.
If ligand binding causes a conformational change involving alterations to the protein secondary structure (for instance, by ordering the structure of a flexible loop), differences can be detected in the CD spectrum. The minimum size of the conformational change that can be detected depends on the signal-to-noise levels and reproducibility (standard deviations) in repeated measurements. Generally, for cCD measurements this means changes need to be ⩾5% of the signal at one of the peaks. Even for a small protein of 20,000 da, this would mean that ~10 or more amino acids would have to change to enable detection with surety. This would be quite a substantial structural difference, involving a significant portion of the protein. On the other hand, for SRCD, the noise levels can be as low as 1%, meaning that for the same protein, the change would only need to involve 2 to 4 amino acids. Such a change could occur simply if unordered residues at the end of a helix fold to form one more helical turn or if a single loop changes conformation, which is a more realistic expectation. Alternatively, if the changes are large, titration techniques can be used to determine ligand binding constants.
A significant advantage of using SRCD (or cCD) to detect binding, is the increased functional information content, if different conformational states bind different ligands. An example of this is the voltage-gated sodium channel, which exists in open, closed and inactivated forms (Cronin et al. Reference Cronin, O'Reilly, Duclohier and Wallace2003); the inactivated form binds the anti-epileptic drug- lamotrigine, whereas the closed form binds batrachotoxin. The spectra of the drug- and toxin-bound forms are distinctly different, so CD can be used as a potential screening method for different types of ligands (i.e. anti-epileptic and analgesic drugs). Although the original experiment was done using cCD, these types of differences can be detected much more readily now using SRCD spectroscopy (Wallace & O'Reilly, unpublished results).
Finally, the detection of ligand binding can be enhanced by using thermal denaturation studies. In general, the binding of a ligand to a protein will increase the thermal stability of the protein, which can be detected in thermal ‘melt’ experiments, where the change in ellipticity (often at one wavelength such as 224 nm) is monitored as a function of temperature (O'Reilly et al. Reference O'Reilly, Charalambous, Nurani, Powl and Wallace2008). In some cases, the ligand binding can enhance the stability significantly, shifting the TM by 10°C or more. This method can be a more sensitive assay than simple spectral differences, especially if no spectral differences are observed at low temperature upon binding of the ligand. This can also be used as an assay to determine whether a mutant or modified protein is still capable of binding agonists and antagonists.
4.2.3 Monitoring protein unfolding and folding
Understanding the processes of unfolding/refolding of proteins in vitro is important not only for discerning their thermodynamic properties, but also has important applications for the small and large scale production of correctly folded proteins. On a secondary structure level, unfolding generally involves changes from helical or sheet structures to random coil or disordered structures. SRCD can be particularly valuable for examining disorder-to-order transitions because disordered structures have as their largest spectral feature a negative peak at low wavelengths (~190 nm), a region easily detected with SRCD. This peak is often very noisy in cCD due to the components present in the solution necessary for either keeping the protein in an unfolded state or for mimicking physiological conditions; this has meant that, in general, refolding studies that aim to examine the transition between folded and unfolded states (in either direction) at a single wavelength as a function of time often must concentrate only on the high-wavelength peak associated with helix formation. SRCD expands the information obtainable by enabling the monitoring of both the disappearance/appearance of the disordered peak and the appearance of the ordered peaks for helix and sheet. This permits detection of whether or not the folding of different elements occurs in a concerted manner and whether they appear/disappear in parallel or not.
4.2.3.1 Chemical stability
Chemically-induced unfolding studies usually employ chaotropic agents, such as urea or guanidinium HCl, or hydrophobic additives, such as the detergent sodium dodecyl sulphate (SDS), to interrupt hydrogen bonds and hydrophobic interactions in the interior of proteins. The usefulness of SRCD in folding studies was exemplified in a study of the alpha/beta protein shikimate kinase (Cerasoli et al. Reference Cerasoli, Kelly, Coggins, Boam, Clarke and Price2002). This study used a combination of stopped flow studies on a cCD instrument (at the time there were no working SRCD stopped flow setups, see Section 6.1.3) to follow the refolding process, but also used SRCD scans to examine the whole spectrum of the protein in its unfolded state. SRCD proved of benefit because of the high concentrations of urea used to produce the unfolded state, which absorbs strongly in the far-UV region. The refolding was monitored at 225 nm, but as the authors noted, in the future it should be possible to monitor the refolding of the lower wavelength peaks when a stopped flow SRCD becomes available. An advantage in this case could arise because that the protein contains a considerable amount of beta sheet structure, which is not monitored by the 225 peak changes.
With the recent development of a continuous flow facility using microfluidic mixer on an SRCD beamline (see Section 6.1.3), it has been possible to temporally monitor the rapid time course of the refolding (Hoffmann et al. Reference Hoffmann, Kane, Nettels, Hertzog, Baumgärtel, Lengefeld, Reichardt, Horsley, Seckler, Bakajin and Schuler2007) of a small cold shock protein from 4 M guanidinium hydrochloride at 205 nm, where the change in beta sheet content can be monitored. The high flux of the SRCD beam was critical for being able to do these measurements.
4.2.3.2 Thermal stability
The thermal stability of a protein may be monitored by either following the change in magnitude of a single peak or the change in the whole spectrum as a function of temperature. In this way, the melting temperature (TM) of the unfolding transition can be determined. However, to accurately determine this value it is essential that for each temperature increment, the sample has come to equilibrium (i.e. multiple scans exhibit no systematic change with time). As a result measurements of whole spectra have an advantage of being able to confirm if the sample has equilibrated. However, in cCD, often only high wavelengths can be monitored with accuracy because of the noise levels in measurements at lower wavelengths. The ability to measure the thermal characteristics at many wavelengths using SRCD provides the additional advantage that the different types of secondary structures can be separately monitored during unfolding or refolding to ascertain if the process is concerted and cooperative or sequential (Fig. 17). The 222-nm peak is a good indication of the helix content and the 215- and 208-nm peaks are due to a mixture of the sheet and helix content, whilst the 190-nm peak represents a mixture of helix, sheet and unfolded conformations and the 170-nm peak is a different mixture of helix, sheet and unfolded. By monitoring all of these peaks (Lees et al. Reference Lees, Smith, Wien, Miles and Wallace2004), it is possible to deconvolute the changes due to each type of secondary structure and separately define the differential stabilities of each of the secondary structural components. In addition, folding intermediates can be identified from difference spectra. Thus, SRCD has the potential for defining the full of path of an unfolding process.
Plot of a three-dimensional stack of SRCD thermal melt spectra for lysozyme, a protein which contains both helix and sheet elements. This is plotted using CDtool software (Lees et al. Reference Lees, Smith, Wien, Miles and Wallace2004) with the z axis being the temperature and the projection contours on the xz plane highlighting changes at each wavelength with temperature.

As an early example, SRCD was used to follow the unfolding of the protein lactoglobulin. Because the helical content of this protein is very small, rather than monitoring the changes at a single wavelength, Qi et al. (Reference Qi, Holt, McNulty, Clarke, Brownlow and Jones1997) obtained full SRCD spectra (down to 170 nm) at 12 temperatures between 20 and 80°C, and then calculated the secondary structure content present at each temperature and found a trend associated with the thermal denaturation. The use of SRCD was essential because the changes directly observable in the spectra at ~222 nm were effectively undetectable. In addition, secondary structure differences calculated from using the spectra only down to 200 nm did not show differences that were significant; however, when the whole spectrum was analysed using data down to 170 nm, changes in the helical content were apparent. This illustrates the power of including information from the lower wavelengths in such analyses.
More recently (Maytum & Janes, Reference Maytum and Janes2007), SRCD was used to identify a new intermediate in the folding pathway for tropomyosin. Although cCD had been used for many years to study this protein, because spectra were only measured to ~200 nm, the transition had not been previously seen. The new thermal transition, which was detectable by SRCD in the spectra region between 170 and 190 nm, and at a physiologically relevant temperature (30–37°C) was capable of distinguishing between wildtype and mutant protein.
Hence, SRCD provides added value to unfolding/refolding studies by enabling the examination of additional peaks, which in turn provide insight into the types of secondary structures involved in thermal transitions, the presence of intermediates and the cooperative nature of the processes.
5. Complementarity of SRCD and other techniques
A characteristic of many of the studies done using SRCD has been its complementarity with other techniques and the number of studies reporting the use of multiple techniques to characterise macromolecules.
5.1 Synchrotron radiation circular dichroism and infrared spectroscopy
The ability to combine two spectroscopic techniques for examining a single protein has a number of advantages. The pairing of SRCD and Fourier transform infrared spectroscopy (FTIR) is a particularly good example of this synergy, as the methods measure different wavelength ranges which provide information on different features of a protein and have different sample requirements. CD detects electronic transitions due to the peptide backbone, whereas FTIR measures vibrational transitions due to stretching and bending of, for instance, NH, CO and CN bonds. In both types of spectra, distinct features arise depending on what type of secondary structure is present, but the two methods have different accuracies in their ability to quantify different types of structures and different potential limitations. For example, scattering can be problematic for membrane proteins in CD measurements, but not so for FTIR (due to the longer wavelengths used); however, aqueous solvent peaks can interfere with the protein peaks in FTIR, making quantitation, especially for helical structures difficult; however water does not produce a CD signal and therefore does not interfere with protein spectra. CD generally requires less material than FTIR, and in this regard, SRCD provides an even greater advantage with respect to the amount of material and time needed for measurements.
Beyond just providing different separate measurements that can be compared, recent studies (Lees & Janes, Reference Lees and Janes2008; Oberg et al. Reference Oberg, Ruysschaert and Goormaghtigh2004) have shown that CD and FTIR data can actually be combined in secondary structure analytical procedures to produce more accurate determinations than either method alone. This combination may be successful in part because CD is particularly good for helical structure determinations whilst FTIR is especially good for defining beta sheet structures. Lees & Janes (Reference Lees and Janes2008) have further shown that if SRCD data rather than conventional CD is used, the improvement is even more notable.
Future developments in beamline designs could exploit this synergy if IR and CD endstations could be juxtaposed on the same beamline to enable measurement on the same sample. Alternatively, simple coordination of beamtime on two different beamlines could enable both measurements during the same synchrotron visit, especially if sample cells are made mutually compatable. The later will be more facile now that a number of synchrotrons are developing ‘life science villages’ where beamlines (and their associated laboratory spaces) used for biological samples are located in close proximity around the synchrotron ring.
5.2 Synchrotron radiation circular dichroism and sequence-based secondary structure predictions
Combinations of SRCD measurements and sequence-based neural network modelling methods have been used to improve the empirical predictions of protein secondary structures (Lees & Janes, Reference Lees and Janes2008; Matsuo et al. Reference Matsuo, Watanabe and Gekko2008). By providing accurate information on the net amounts of each type of secondary structures as calculated from SRCD spectra to augment the training of a standard neural network for the position-specific prediction of the secondary structure type of each amino acid in a protein, Matsuo et al. (Reference Matsuo, Watanabe and Gekko2008) found a significant improvement in the prediction of the individual amino acids' secondary structures, when compared the known crystal structure. A similar approach was taken by Lees & Janes (Reference Lees and Janes2008), except in the latter case experimental information from both SRCD and FTIR measurements were used to enhance the predictions. In both studies, SRCD-derived net secondary structures rather than CD-derived values were used because they produced more accurate experimental values. SRCD had another distinct advantage: measurements could be made when only small amounts of the protein of interest were available. These studies suggest that combining the methods of SRCD and bioinformatics can have useful applications in homology modelling using sequence-based structure predictions to produce improved modelled structures.
Conversely, SRCD experimental data have been used to test the accuracy of modelled structures, either by comparing back-calculated spectra from a theoretical model with the experimentally-measured SRCD spectrum of the protein of interest (Richards et al. Reference Richards, Hanlon, Berrow, Butcher, Dolphin and Wallace2002) or by comparing the SRCD-derived secondary structure determined for a modelled homologue with the secondary structure derived from crystal structures of other members of the same protein family (Miron et al. Reference Miron, Réfregiers, Gilles and Maurizot2005).
5.3 Synchrotron radiation circular dichroism and protein crystallography
SRCD spectroscopy can be a valuable adjunct to protein crystallographic studies, both as an aid to crystallisation conditions and as a means of relating a protein crystal structure to the biological function of the protein.
As a crystallisation aid, CD can be used to monitor (i.e. by thermal melt studies) the effects of various additives, detergents or other conditions on the stability of the protein; because it has been shown using other techniques that optimising protein stability can lead to identifying initial conditions for crystallisation and, later, improved crystals (Warne et al. Reference Warne, Serrano-Vega, Tate and Schertler2009), CD studies of thermal stability could provide useful information for crystallisation. Alternatively, ligand binding studies can monitor the titration of complex formation, thereby assuring a single species is present under the crystallisation conditions (as opposed to having a mixture of proteins with and without ligand bound). Both of these types of studies can be undertaken successfully with conventional CD spectroscopy, but they can be improved with SRCD because of the wider range of conditions possible, including monitoring additives that may absorb in the UV.
Other applications of CD/SRCD are the ability to demonstrate that constructs produced for crystallisation have well-ordered structures and as a guide to dissecting the protein (deletion of termini, loops), removing disordered regions that can prevent crystallisation (Richards et al. Reference Richards, Hanlon, Berrow, Butcher, Dolphin and Wallace2002). SRCD has also been used to identify whether domain constructs designed for crystallisation are properly folded, and if not, to use the SRCD measurements to help identify the location of domain boundaries (Richards et al. Reference Richards, Hanlon, Berrow, Butcher, Dolphin and Wallace2002). SRCD is preferable to CD for these studies because of the requirement for small amounts of protein (it would not be sensible to use a method that could require much larger amounts of protein than needed for the crystallisation setups), because the unordered structures that are being assessed in these studies have their major spectral features at wavelengths below 200 nm and because domain constructs often require relatively high salt concentrations in order to stabilise them in solution (as neighbouring domains that can contribute to solubility may have been removed in the process). Furthermore, CD/SRCD can be used to monitor the refolding into viable preparations of constructs initially expressed as inclusion bodies or in denatured forms. SRCD has the advantage in this case of enabling such measurements in a range of denaturants such as urea, detergents and guanidine hydrochloride.
One of the potentially most useful applications of SRCD with respect to crystallography is to be able to relate crystal structures to structures present under ‘physiological’ conditions. SRCD can measure samples under both types of conditions (which are often inaccessible to CD measurements due to the high concentrations of salts, buffers and precipitants present in crystallisation mixtures and high ionic strength and concentrated solutions representing cellular conditions). In addition, whilst a crystal structure is a ‘static’ representation, SRCD can monitor conformational changes in the protein associated with ligand binding and altering conditions such as pH and temperature, thereby relating its structure to function.
Another example of where SRCD can provide important information that is complementary to protein crystallography is when a crystal structure has been determined for a protein (for example the wildtype), but a mutant that is biologically important cannot be made to form high resolution crystals. Often the mutant can be compared spectroscopically with the wildtype protein to determine subtle conformational differences. This was the strategy adopted for examining a mutant eye lens γD-crystallin protein (P23T) that causes a form of cataract disease but did not produce suitable crystals, where there was a good quality wildtype protein crystal structure (Evans et al. Reference Evans, Wyatt, Wistow, Bateman, Wallace and Slingsby2004). SRCD showed small but significant differences (Fig. 18 a) that could be interpreted structurally based on the native crystal structure and molecular modelling and dynamics studies as resulting in an extension to one beta strand which changed the protein's solubility; this could then make structural sense of the disease phenotype of opaque (insoluble) protein in the eye.
In a similar type of study, SRCD spectra were used to compare wildtype and mutant forms of the enzyme phosphoribosylpyrophosphate synthetase (Liu et al. Reference Liu, Peng, Zhao, Zhang, Tao, Luo, Li, Teng, Li and Wei2009). The mutant version of this enzyme is super active relative to the wild type, leading to increased synthesis of phosphoribosylpyrophosphate, which is associated with the overproduction of uric acid and the disease gout. The crystal structure of the wild type had been determined, but not of the mutant. Small but significant differences in the SRCD spectra of the two enzymes were evident in both the peaks at ~190 and ~220 nm. These led to calculated differences in helix contents of around 1% between native and mutant. The differences could be rationalised based on the crystal structure of the wildtype in terms of potential structural changes around the single amino acid that was changed. If only one amino acid conformation had changed in the protein, this would have produced much less change than the 1% of the total helix content seen. However, examination of the crystal structure suggested that the asparagine to serine substitution in the mutant would alter the local hydrogen bonding pattern in a way that would change the phi/psi angles of a segment of polypeptide backbone, resulting in the change from a disordered helix to an ordered one. This is an excellent example of the synergy possible between protein crystallography and SRCD spectroscopy: when no crystal structure of the mutant was available, the spectra provided data that were interpretable on a molecular level based on the wildtype crystal structure.
It is significant that in both these examples, the differences between the mutant, disease-causing proteins and the wildtype native proteins were visible in the SRCD spectra. However, they were so small (on the order of 1% differences in the magnitudes of specific peaks) that they would have been undetectable using cCD instruments, where a noise level better than 2%–3% can rarely be achieved, even when averaging many repeats and under optimal conditions. Indeed, in the case of the crystallins study, a direct comparison between the wildtype and mutant proteins with cCD (Fig. 18 b) showed that the data quality was insufficient to make any significant comparisons.
SRCD can also have a role in structural genomics programmes which aim to crystallise examples of all possible protein fold types. Fold recognition studies based on SRCD spectra, using the enhanced information at low wavelengths, may be useful in identifying if a potential target protein may represent a new fold. This and other applications of SRCD in structural and functional genomics are discussed by Miles & Wallace (Reference Miles and Wallace2006).
Finally, a future application of SRCD could be as an aid in identifying a potential model structure for molecular replacement phasing of crystal data. Although this has yet to be realised, with improved amounts of (low wavelength) data, a broader reference data set of spectra of known proteins and further developments in spectral matching and cluster analyses, SRCD spectra of proteins with closely related folds may prove to be useful for identifying a close structural (although not necessarily a close sequence) neighbour for such purposes.
5.4 Synchrotron radiation circular dichroism and other biophysical methods
Isothermal calorimetry (ITC) is a valuable method in structural biology for monitoring binding of various compounds to proteins; this can be combined with SRCD to examine the structural effects of such binding on the protein. For example, Bagger et al. (Reference Bagger, Hoffmann, Fuglsang and Westh2007) used SRCD in conjunction with ITC to compare two forms of the protein phytase from P. lycii (one heavily glycoslyated and the other enzymatically deglycosylated) and their interactions with the denaturing detergent SDS. The aim was to investigate that nature/role of the glycans in maintaining structural integrity. They showed that both the native and deglycosylated versions of the protein produced similar SRCD spectra and that the denatured versions of both variants were also similar, although there was a small additional requirement for denaturant to reach the same level of unfolding in the glycosylated protein. This study also showed, as other SRCD studies of denatured proteins have found (Matsuo et al. Reference Matsuo, Sakurada, Yonehara, Kataoka and Gekko2007), that the ‘denatured’ proteins were not fully unfolded.
SRCD and small angle X-ray scattering (SAXS) are examples of two synchrotron techniques that can produce useful complementary information if applied to a single sample type. This is because SRCD is particularly good at providing secondary structure information and SAXS can provide valuable information on the tertiary or quaternary structure of a protein. Grossmann et al. (Reference Grossmann, Hall, Kanbi and Hasnain2002) exemplified this by using SRCD to examine the conformational differences in the protein rusticyanin with and without its N-terminal extension. SRCD was important for the studies as the differences involved small amounts of beta sheet structures and SAXS was essential for showing that the changes did not involve changes to the association into hexamers.
The combined information from SRCD and SAXS can also provide powerful information against which to test molecular models. As an early example (Scott et al. Reference Scott, Grossmann, Tames, Byron, Wilson and Otto2002), the SRCD spectrum of protein haemoglobinase, a principal component of an iron acquisition system in pathogenic Escherichia coli, was used to confirm the predicted secondary structure of the protein, and then its size and shape were probed using analytical ultracentrifugation and SAXS. The experimental results from all these methods were compared with models of the structure as an extended crescent-shaped conformation and found to be in good agreement. A later example of this combination of methods was as a test for the predicted structure of a designed carboprotein (Hoiberg-Neilsen et al. 2008).
SAXS and SRCD have also been combined to identify the nature of complexes formed between two proteins. Stanley et al. (Reference Stanley, Sokolova, Brown, Clarke, Wilmanns and Svergun2004) combined SRCD and SAXS for studies of the C-terminal domain of Pex5p and the protein SCP2. They showed that the complex formation required little secondary structure rearrangement and comparisons of the irregular ‘shoe’-shaped particle of the complex with the known crystal structures of the individual proteins suggested that complexation required a conformational change of the C-terminus of SCP2.
In another study (Guerra-Giraldez et al. Reference Guerra-Giraldez, Moore, Neves, Wallace, Svergun, Brown and Smith2005), three complementary methods (SRCD, SAXS, NMR) were used to study the SHERP protein associated with the disease leishmaniasis. SRCD showed that in the absence of binding partners, the protein was ‘natively disordered’, a conformation not suitable for NMR studies, but very amenable to SAXS measurements, which confirmed it had an extended conformation under these conditions. SRCD was then used to identify specific binding partners which induced the protein to fold to a regular helical structure, whose detailed conformation was then determined by solution NMR spectroscopy.
6. New developments and future applications
A number of new instrumentation and bioinformatics developments have been described that should enhance the breath and range of potential applications of SRCD in structural biology, functional proteomics and systems biology.
6.1 Instrumentation
6.1.1 Multiple wavelength detection
One potentially-important instrumental innovation has been the development of a multichannel detector for use with multiple wavelength ‘white light’ irradiation, enabling the measurement of SRCD signals at multiple wavelengths (effectively whole spectra) simultaneously (Manolopoulos et al. Reference Manolopoulos, Clarke, Derbyshire, Jones, Read and Torbet2004). It was trialed on the CD12 beamline at the SRS but is not yet installed on any existing SRCD beamline. This type of detection will enable new applications for protein folding, enzyme kinetics and other dynamics studies. The prototype, which had a limited number of channels and therefore limited wavelength resolution, was only tested for collecting a steady state spectrum of myoglobin, not yet for time-resolved measurements. Nevertheless, successor versions should prove essential for monitoring fast dynamics at multiple wavelengths. There are plans to incorporate versions of this type of detector and the use of white light in several of the new SRCD stations such as those at the Diamond and Soleil synchrotons.
6.1.2 Multiple types of detection
A second instrumental enhancement is the ability to measure CD and LD simultaneously, as is possible at the NSLS, or sequentially, as is possible at a number of other SRCD beamlines. This is important because for samples that are oriented, either intentionally such as dried films (Nesgaard et al. Reference Nesgaard, Hoffmann, Andersen, Malmendal and Otzen2008) or fibres (Dicko et al. Reference Dicko, Knight, Kenney and Vollrath2004) or samples that self-orient or aggregate in solution such as prions, nucleic acid polymers or membranes, it is important to be able to determine the contribution of the LD component to the CD signal. In some cases, the LD signal can be very significant and can distort the interpretation of the CD spectrum if it is not measured and considered in the analysis of the CD data. Such measurements can be made relatively facilely (Sutherland, Reference Sutherland, Wallace and Janes2009) and could be incorporated into the electronics design of new and existing beamlines and become a routine check for good practice. In addition to using LD in this manner, facilities are also being developed for purposely measuring LD using couette sample holders (Dicko et al. Reference Dicko, Hicks, Dafforn, Vollrath, Rodger and Hoffmann2008; Rodger, Reference Rodger, Wallace and Janes2009) to produce specifically oriented samples, as is the case at the CD1 beamline at ISA. These SRLD measurements may ultimately provide new insight into a range of orientable samples such as protein, carbohydrate and nucleic acid fibres, as well as lipid vesicles and bicelles.
Not all beamlines currently include the ability to record the pseudoabsorbance (or related parameters such as HT, high voltage or dynode voltage) and CD simultaneously. Including a record of a measure of the absorbance in the saved data file is essential because it enables the user to examine if any changes occured during the time course of the experiment (i.e. between repeated measurements) which could indicate changes to the sample such as degradation, aggregation or precipitation (Miles & Wallace, Reference Miles and Wallace2006). It is standard on a number of beamlines and it is anticipated that this will become a routine piece of information in future beamlines [especially as the common output format that was agreed by all beamline scientists at the SRCD2009 meeting will include the HT values (Tao & Wallace, Reference Tao and Wallace2009)]. The ultimate extension of multiple types of detection is the ‘Omnilyzer’ developed at the NSLS (Sutherland, Reference Sutherland2002, Reference Sutherland, Wallace and Janes2009) which enables measurement on a single beamline of SRCD, magnetic CD, LD, fluorescence and HT.
6.1.3 Dynamics studies
Time-resolved studies by SRCD have great potential for enabling the examination of protein folding/unfolding, the kinetics and mechanisms of enzymatic activity and the binding and insertion of proteins into membranes, amongst other processes. Time-resolved studies initiated by stopped flow or temperature jump techniques are ideally suited for SRCD measurements because of the small amounts of material needed to produce signals and because the measurements can be made very rapidly, at rates that are more compatible with the time scale of the reactions than is possible using cCD. This is currently probably the most under-exploited but exciting application for the use of SRCD.
The first stopped-flow SRCD beamline for time-resolved studies was built at the SRS in station 13.1, which has since been decommissioned. A number of studies were done at this beamline, including monitoring the kinetics of folding of alpha helices (Clarke et al. Reference Clarke, Doig, Stapeley and Jones1999). The station was taken off line in anticipation that the new CD12 beamline at the SRS would include both static and kinetic capabilities, but with the advent of the Diamond synchrotron, which replaced the SRS in 2008, the kinetics facilities (including the use of a white light detector to enable very fast measurements) were not completed at the SRS.
Beamline U9b at the NSLS has an operating stopped flow facility, albeit using a commercial mixer with with a large sample volume. Work is presently in progress at a number of other SRCD beamlines (Soleil, Diamond and BSRF) to enable time-resolved studies, mostly using stopped flow techniques. At BESSYII, dynamics work has been concentrated on producing a microfluidic mixer to enable continuous flow measurements (Kane et al. Reference Kane, Hoffmann, Baumgartel, Seckler, Reichardt, Horsley, Schuler and Bakajin2008). This has enabled kinetics studies to be done on an undulator beamline. There, the dynamics of the protein structure during the folding process (Hoffmann et al. Reference Hoffmann, Kane, Nettels, Hertzog, Baumgärtel, Lengefeld, Reichardt, Horsley, Seckler, Bakajin and Schuler2007) was observed. By measuring at different positions of the microfluidic mixer, they were able to record SRCD spectra at different times in the process, thereby obtaining kinetic data. Although they used SRCD, they only were able to measure the spectra in the range from 200 to 250 nm (in part due to the presence of the absorbing denaturant guanidine HCl). However, the deadtime of the instrument was only 1·3 msec, meaning that fast processes that occur on the millisecond time scale could be monitored at this beamline. This shows great promise for future fast kinetic applications.
A number of current and future beamlines have plans for inclusion of stopped flow, continuous flow or temperature jump techniques for initiating the folding/unfolding process. The ability to detect multiple wavelengths simultaneously as described above using a white light illumination of the sample, would further enhance the information content of the experiment because many (in principle all) wavelengths could be measured rapidly and at the same time, thereby eliminating the current need to do separate repeated measurements, monitoring at a single wavelength each time, and hence decreasing dramatically the amount of material needed per experiment. Furthermore, the time scale of the measurements could be made even faster if the inherent circular polarisation of the beam, as opposed to the instrumentally-modulated polarisation was used (see next section). Hence, there is a good future potential for time-resolved folding and enzyme kinetics studies on SRCD beamlines.
6.1.4 Alternate means of modulation
Another instrument development that may ultimately impact on dynamics studies is the use of the inherent circularly-polarised light from the synchrotron light source, instead of including a modulator in the beam design. A significant advantage of this would be that the speed of data collection (which will have a significant effect on the time resolution of kinetic measurements and a more modest effect on the rate of data collection in the wavelength scanning mode) is the rate at which the PEM can alternate between producing left- and right-handed polarised light. Given that light emitted from a synchrotron source is naturally right-and left-polarised (above and below the central plane of the beam), it has long been proposed that this might be used to eliminate the need for a modulator (normally inserted after a linear polariser but sometimes, depending on the beam design, without a linear polariser using only the central linearly-polarised part of the beam). Potential problems with such a design are that the optics must be well adjusted so that equal amounts of light from both beams are input into the same area of the sample and the stringent requirement for exact calibration across the entire face of the detector. However, the advantage in speed, as well at the absence of additional absorbing surfaces – the windows of the modulator – could, in principle, significantly improve the spectra produced, both in speed and in wavelength range.
A new beamline (BL-5) has been developed on the electron storage ring TERAS at the Tsukuba synchrotron in Japan, which is aimed at measuring both SRCD and LD spectra. It utilises an ac-modulated polarising undulator to produce left- and right-handed polarised light without a transmission type polarising modulator downstream (Yagi-Watanabe et al. Reference Yagi-Watanabe, Tanaka, Yamada, Kaneko, Nakagawa and Yuri2005). The ac modulation of the undulator permits modulation in the range of fHz and by choice of modulation sequence can enable simultaneous CD and LD measurements. It was tested for use with dried films of d- and l-alanine (which have the added advantage that they do not contain water and so spectra to lower wavelengths could be collected). Although no results have yet been published on solutions of macromolecular samples, this beamline design has substantial potential for the future.
6.1.5 High-throughput sample handling
A future use for SRCD is likely to be the identification of small molecule ligands and drugs or macromolecular binding partners from a range of potential candidates, in a high-throughput manner (Wallace & Janes, Reference Wallace and Janes2003). Because the speed of data acquisition is so much higher in SRCD than cCD, SRCD is likely to play an important role in this type of application. However, the sample loading process currently consumes a considerable fraction of the turn around cycle for samples, so new methods will be needed to limit the time of loading or enable offline loading of multiple samples.
SRCD will be necessary for high-throughput screening when the conformational change to be detected is relatively subtle. Large changes can be detected by cCD, such as the binding of anti-epileptic drugs to the voltage-gated sodium channel (Cronin et al. Reference Cronin, O'Reilly, Duclohier and Wallace2003), but smaller changes will require spectra with higher signal-to-noise ratios in order to enable the detection. In addition, the greatly reduced sample requirements with respect to cCD will make high-throughput SRCD a viable technique for scanning many proteins. This will require development of hardware to enable rapid sample loading and new types of sample cells and sample changers to permit screening of multiple samples without regular human intervention to load the samples. To date no beamline has such a capability, but there are plans for accomplishing this on a number of beamlines in different ways, ranging from multiwell plates being loaded off line and then translated in the beam, to robotic loading in situ. Although this may not replace other more rapid screening methods, it does have potential as a new screening tool providing complementary information (including the influence of the binding on the protein secondary structure) that may prove to be of additional value for the pharmaceutical industry.
6.2 Bioinformatics: the Protein Circular Dichroism Data Bank
The Protein Circular Dichroism Data Bank (PCDDB) has recently (December 2009) been inaugurated. It has been developed for the deposition of and access to, CD and SRCD spectral and meta data (Wallace et al. Reference Wallace, Whitmore and Janes2006, 2009a; Whitmore et al. Reference Whitmore, Janes and Wallace2006), in a manner that parallels the information currently available in the Protein Data Bank (PDB) for crystallographic and NMR spectroscopic studies (Berman et al. Reference Berman, Westbrook, Feng, Gilliland, Bhat, Weissig, Shindyalov and Bourne2000). The goal of the PCDDB is to enable public availability of data collected on SRCD and CD instruments worldwide, for analysis, comparisons and data mining. It will also fulfil data sharing (NIH, 2003) and tracability requirements for drug development regulations (Guideline Q6B, 2001). The creation of the data bank (Wallace et al. Reference Wallace, Whitmore and Janes2006) and software for deposition and validation [the latter being comparable to the data checking programs WHATIF (Vriend, Reference Vriend1990) and PROCHECK (Laskowski et al. Reference Laskowski, Macarthur, Moss and Thornton1993)] associated with the PDB are a joint effort of Birkbeck College and Queen Mary College, University of London. Once fully established, the sustainability of the project will become a collaboration with SRCD beamlines, with mirror sites already agreed at the NSRRC and Soleil and expressions of interest from many other beamlines (Tao & Wallace, Reference Tao and Wallace2009).
The data bank is available at http://pcddb.cryst.bbk.ac.uk/. One of the aims of this is as a repository for validated spectra from a wide range of proteins, which will be as a resource for the future development of new SRCD reference data sets to further improve secondary structure analyses and new methods for de novo calculation of spectra from first principles. The access to spectra in this data bank is expected to enable or facilitate a wide range of other new studies, as outlined by Wallace et al. (Reference Wallace and Janes2009).
7. Summary: advantages of SRCD spectroscopy for the characterisation of proteins
SRCD spectroscopy is an emerging technique for the study of proteins that builds on and enhances the well-established method of circular dichroism spectroscopy. The use of synchrotron radiation as the light source enables the extension of the method to new types of samples and for answering new types of structural and functional questions.
The higher light flux results in much higher signal-to-noise levels in the spectra, which mean that much smaller spectral (and thus conformational) differences can be detected with assurance. This has enabled the detection of very subtle conformational changes associated with single point mutations in some proteins and the improved ability to monitor the binding of ligands. The latter may prove useful in the future as a means not only for high-throughput screening of drug binding, but also as a way of identifying to which functional state a particular drug binds. The high flux has also enabled the examination of relatively scarce samples, as the requirements for the amount of protein needed are decreased by about two orders of magnitude with respect to those needed for conventional CD spectroscopy. In the future, this sensitivity will also be a significant advantage to fast dynamic studies, once stopped flow capabilities are routinely available at SRCD beamlines. The high flux also means that adequate light penetration can be achieved in samples that would ordinarily be refractory to CD spectroscopy, such as those including highly absorbing additives such as salts, chaotropic agents, lipids and detergents. As a result, unfolding/folding studies that employ urea and guanidine hydrochloride are feasible in most cases and studies on membrane protein samples which include detergents and/or lipids are facilitated. A further practical consideration is that SRCD data collection can be much faster due to the diminished requirement for spectral dwell time and averaging; this is a valuable parameter for unstable samples and enables much more data to be collected in a given time period.
The lower wavelength limit achievable in SRCD means that the spectra obtained have higher information contents, which in turn means that more accurate secondary structure analyses can be achieved. Also, through the application of new analytical methods based on clustering, neural networks and principal components, it can provide information about the higher level of structural organisation, such as supersecondary structures or fold architectures. The ability to measure lower wavelength transitions, such as those arising from charge-transfer interactions, enables the technique to monitor not only the induced-fit intermolecular interactions involving changes in secondary structure that can be routinely done with conventional CD spectroscopy, but also rigid body interactions that result in complex formation where there is no change in secondary structure. This is a major enhancement of the utility of the method, especially in light of the rising interest in systems biology, where identification of protein–protein interactions is crucial. Another advantage of obtaining the low-wavelength data is that because prominent spectral characteristics due to beta sheet and disordered secondary structures are located in the low-wavelength region, these types of structure can more readily and accurately be measured in proteins, especially proteins that have significant helical content that tends to overshadow the sheet signals at higher wavelengths in the far-UV region. This is especially useful for thermal melt/denaturation studies that examine mechanisms and pathways of protein unfolding and refolding, as the separate unfolding of the different structural elements can be distinguished. It is expected to have even further value in the future for monitoring fast kinetics or folding dynamics which can be done at multiple wavelengths, allowing the user to establish the kinetics and order in which different types of secondary structure are unfolded as well as establishing the nature of the secondary structural features of the intermediates in the folding process. Additionally, as the peaks due to unfolded/disordered structures are also located in the low-wavelength region, SRCD is proving very useful for examining natively disordered proteins and their binding partners that transform them into more regular structures as part of biological signalling and assembly processes. Finally, until the development of SRCD, the sugar components of glycoproteins have not been detectable by CD spectroscopy because their electronic transitions occur in the vacuum UV region. Because carbohydrates have been shown to play major roles in protein folding and targeting, the ability to measure spectra to lower wavelengths adds to the arsenal of methods currently available for their characterisation.
The flexible sample geometry at SRCD beamlines enables the examination of sample types such as membrane proteins and fibres that would ordinarily be unsuitable for conventional CD studies due to differential scattering effects. These types of samples are finding importance in biology for their roles in diseases and as drug targets, and as they are often not amenable to crystallisation, the information available from the SRCD data, especially with respect to their ligand binding, may prove useful in pharmaceutical development. In addition, the ability to examine films (especially oriented bilayers) can provide information on the relative orientation or disposition of the various secondary structure components present in the samples.
Of course all of these advantages must be balanced with a consideration of the disadvantages associated with using a large facility such as a synchrotron, which include travel time and costs, sample transport and time between a proposal for beamtime and actual beamtime allocated, relative to the ease of utility of a cCD instrument in a home laboratory.
In summary, SRCD has the ability to significantly expand the utility of conventional CD spectroscopy for studies of biological systems. In addition, there are emerging a number of examples of the synergistic use of SRCD and other biophysical and structural methods, which can further enhance our understanding of the structure, function and interactions of proteins.
8. Appendix: bioinformatics resources available for SRCD analyses
8.1 CDtool software
CDtool (Lees et al. Reference Lees, Smith, Wien, Miles and Wallace2004) is a downloadable (http://cdtools.cryst.bbk.ac.uk) software package for the processing and analysis of SRCD data. It was developed in order to enable comparisons of data obtained on different SRCD beamlines and on different conventional CD instruments that were all output in different formats. It includes functions for calibrating, displaying and archiving data.
CDtools is capable of accepting as input all data formats currently in use at SRCD beamlines, including spectra with different wavelength ranges, wavelength intervals, wavelength orders and including both CD and HT signals. Data processing functions include averaging, smoothing, baseline subtraction, zeroing, conversion between various units, calculation of error bars and scaling. Multiple data sets can be processed at one time. CDtools includes software to calibrate/cross-calibrate the data according to the procedure by Miles et al. (Reference Miles, Wien, Lees, Rodger, Janes and Wallace2003) if a standard reference spectrum has been obtained on the same beamline (Fig. 5). A header, which includes a record of all the processing functions that were performed, is created and appended to the output file. The headers can later be consulted for details of how the final spectrum was obtained. Output is in ASCII format files that are compatible with standard spreadsheet software as well as as input to the DichroWeb analysis server (Whitmore & Wallace, Reference Whitmore and Wallace2008) (see below). It can produce plots in a range of different graphics formats and styles.
Probably one of its most useful functions is the interface to a user-supplied MYSQL database, which enables the archiving of spectra for later retrieval and downloading, as well as creation of specialist reference data sets that can be used for spectral analyses.
Other functions include the ability to perform principal component and cluster analyses on a series of related spectra. Additional display functions include the ability to display protein structures from Protein Data Bank (Berman et al. Reference Berman, Westbrook, Feng, Gilliland, Bhat, Weissig, Shindyalov and Bourne2000) files, plus Ramachandran plots in order to identify which residues in a structure adopt specified phi, psi angles. It also includes a facility to display three-dimensional plots when a series of related spectra have been obtained (for instance, a thermal melt series, see Fig. 17), which enable detection of unfolding intermediates and clearly visualise the order in which different types of secondary structures unfold.
Comparison of the (a) SRCD spectra and (b) cCD spectra of a wildtype (black) and single point mutation (P23T) (red) human γD-crystallin. The error bars indicate one standard deviation in repeated measurements. It is clear that the two cCD spectra are not significantly different, but that the SRCD spectra are different in the region around 208 nm. (Data are from Evans et al. Reference Evans, Wyatt, Wistow, Bateman, Wallace and Slingsby2004.)

The website also includes an extensive downloadable users' manual.
8.2 DichroWeb server
The DichroWeb analysis server (Lobley et al. 2004; Whitmore & Wallace, Reference Whitmore and Wallace2004, Reference Whitmore and Wallace2008) is an online facility for calculating protein secondary structures based on SRCD and CD spectra. It is located at http://dichroweb.cryst.bbk.ac.uk. The server is capable of accepting a wide range of specific data formats from various beamlines and commercial CD instruments, as well as output files from a number of processing programs (including CDtool, described above) and free-format data in columns of wavelength versus CD signal. The input data can be in a wide range of data units (CD machine units or millidegrees, delta epsilon and mean residue ellipticity values), with different wavelength ranges, wavelength order and wavelength intervals. The user is also provided with the option of reading in a full wavelength data set, but specifying a cut-off wavelength to truncate it at a higher wavelength than the data was collected at, if the user later determines that the data below a certain wavelength are not valid for analysis. If the data are read in as millidegrees, they can be converted and output to more standard units such as delta epsilon or mean residue ellipticity by the server.
The server enables analyses using the five most popular analysis algorithms, SELCON3 (Sreerama & Woody, Reference Sreerama and Woody2000), CONTINLL (Van Stokum et al. Reference Van Stokkum, Spoelder, Bloemendal, Van Grondelle and Groen1990), CDSSTR (Sreerama & Woody, Reference Sreerama and Woody2000), VARSLC (Compton & Johnson, Reference Compton and Johnson1986) and K2D (Andrade et al. Reference Andrade, Chacón, Merelo and Morán1993). These can be combined with any of ten reference data sets (Whitmore & Wallace, Reference Whitmore and Wallace2008) including seven described by Sreerama & Woody (Reference Sreerama and Woody2000), the SP175 database (Lee et al. Reference Lees, Miles, Wien and Wallace2006a), a truncated version of SP175 (intended for use with conventional CD data) and CRYST175 (Evans et al. Reference Evans, Bateman, Slingsby and Wallace2007), which is meant specifically for proteins with a double Greek key fold (as is found in the βγ crystallins family). A new membrane protein reference data set (MP180) and the combination data set MSP180 (containing the SP175 and MP180 proteins and 25 additional soluble proteins) will also be made available as options in the near future. As a further analysis option, the user can specify a scale factor between 0·5 and 1·5, which can be used to test if the spectral magnitude provided is correct, as described in Miles et al. (Reference Miles, Whitmore and Wallace2005b).
The output produced includes the calculated secondary structure, the goodness-of-fit parameter (NRMSD) (Mao et al. 1981) for the calculated best fit, an overlaid plot of the experimental spectrum with the spectrum back-calculated from the best fit solution (Fig. 9) and several types of ASCII files of the experimental and calculated spectra that can be input into standard spreadsheet programs. A difference spectrum between the experimental and calculated spectrum is also provided, which can be useful in detecting features of the spectra that are not well-represented in the standard reference spectra or which result from systematic changes such as peak shifts produced by membrane proteins (Wallace et al. Reference Wallace, Lees, Orry, Lobley and Janes2003).
The website includes extensive help pages and a FAQ section; an extended users' guide, including examples of potential errors in data input and their solutions is included in the work of Whitmore & Wallace (Reference Whitmore, Wallace, Wallace and Janes2009).
8.3 Other analysis algorithms
The original analysis algorithms (Sreerama & Woody, Reference Sreerama and Woody2000) designed for use with CD data are available for download as part of the CDPRO package, which can be obtained at http://lamar.colostate.edu/~sreeram/CDPro/main.html. With the download are a number of reference data sets, including ones in which denatured proteins have been included (Sreerama et al. Reference Sreerama, Venyaminov and Woody2000). Several of the reference data sets have low-wavelength cut-off limits (178 nm) which would be suitable for use with SRCD data. The algorithms include SELCON3, a self-consistent method combined with a singular value deconvolution procedure, CONTINLL, a modified version of the original ridge regression algorithm of Provencher & Glockner (1982) method that incorporates the locally linearised model of Van Stokkum et al. (Reference Van Stokkum, Spoelder, Bloemendal, Van Grondelle and Groen1990), and CDSSTR, which uses a variable selection procedure and is a modified version of the original VARSLC method (Compton & Johnson, Reference Compton and Johnson1986). The input files require a specific data format, data in delta epsilon units, defined wavelength ranges and specific header information. The output includes an ASCII file that can be incorporated into a spreadsheet for graphics display. A short users' guide, including information on the input and output formats is available at the download site.
Other analysis algorithms (Lees et al. Reference Lees, Miles, Janes and Wallace2006b) designed specifically to take advantage of the extra information content in the low-wavelength data present in SRCD spectra, are available for download from http://webspace.qmul.ac.uk/rwjanes/algorithms.htm. These have been shown to be particularly useful for analysing the beta sheet components of proteins. One method included in this package is SELMAT, a version of the popular SELCON3 (Sreerama & Woody, Reference Sreerama and Woody2000) algorithm, but without the constraint that limits the number of reference spectra that can be used in the analyses. Also, by relaxing the sum, fraction, spectral and helix rules at each stage of the algorithm, it ensures that at least one solution can be obtained, something that is not always possible with the original algorithm. This software package also includes chemometric methods such as partial least squares (PLS), simultaneous partial least squares (SIMPLS) and principal component regression (PCR), as well as neural network (NN) and support vector machine (SVM) techniques. It outputs the calculated secondary structures from each of the methods in a number of different secondary structure classification schemes, including the most common one of regular and distorted helix and regular and distorted sheet (as used in CDPRO). Other schemes include the simple division of the structures into helix, sheet and ‘other’ categories or alternative classifications that separately identify the amounts of 310 and PPII helices, parallel and anti-parallel sheets and two types of beta turns. This separation into additional classes is possible only because of the additional information content in the low-wavelength SRCD data (Wallace & Janes, Reference Wallace and Janes2001).
Acknowledgements
I thank Dr. Robert W. Janes (Queen Mary, University of London) and members of my laboratory at Birkbeck College, University of London, especially Drs. Andrew Miles and Lee Whitmore, for valuable discussions. I thank Drs. Miles, Janes, Frank Wien (now at Soleil), Soren Vronning Hoffmann (ISA), and Ye Tao (BSRF) and Alan Brown (SRS) and John Trunk (NSLS) for help with data collection.
The work in my laboratory was supported by grants from the UK Biotechnology and Biological Sciences Research Council. Beamtime at the SRS was supported by a joint Programme Mode Access grant with R.W. Janes; beamtime at the BSRF was supported by a joint grant with R. W. Janes; access at the NSRRC was supported by beamtime grant 2009-1-122-1; access to the DISCO beamline at Soleil was supported by beamtime grant 20090151. Access to the UV1 and CD1 beamlines at ISA is acknowledged under the EU Integrated Infrastructure Initiative (I3), Integrated Activity on Synchrotron and Free Electron Laser Science (IA-SFS), contract number RII3-CT-2004-506008. Beamtime at the National Synchrotron Light Source, Brookhaven National Laboratory, was supported by the US Department of Energy, Division of Materials Sciences and Division of Chemical Sciences, under contract number DE-AC02-98CH10886. I thank R. W. Janes for access to the Chirascan instrument at Queen Mary which produced the conventional CD data in Figure 7.
I thank the participants of the SRCD2009 Workshop held in Beijing in April 2009, as well as Professor John Sutherland (NSLS), Dr. Soren Vronning Hoffmann and Dr. Gerd Reichardt (BESSY2) for providing the information included in Table 1.