Introduction
In the process of informatization, digitization and intelligent transformation driven by the new round of scientific and technological revolution and industrial transformation, digital technology has become an important driving force for the development of contemporary Chinese society, reshaping people’s living habits and behaviour patterns (Hoehe and Thibaut Reference Hoehe and Thibaut2020). In China, this transformation is particularly extensive and in-depth. While changing the working and living styles of the younger generation, it also affects the daily experiences of older adults (Xiong et al. Reference Xiong, Wang, Wu and Liu2024; Zhang Reference Zhang2024). However, unlike the young adults born in the digital age and the middle-aged adults who have integrated into the digital age by learning the digital language, vulnerable groups such as older adults are often excluded from digital services and face significant challenges in integrating into digital society (Seifert et al. Reference Seifert, Cotten and Xie2021). With the parallel arrival of the digital and ageing eras, how to support older adults to integrate effectively into digital society has become an important issue in the research on older adults in the digital age (Sen et al. Reference Sen, Prybutok and Prybutok2022; Wilson et al. Reference Wilson, Gates, Vijaykumar and Morgan2023).
Regarding the relationship between digital inclusion and well-being, two main views are commonly discussed internationally. One view holds that digital inclusion has a positive impact on the well-being of residents (Kiecolt-Glaser and Newton Reference Kiecolt-Glaser and Newton2001). Being able to access and use digital technology is the basis for residents to acquire digital skills. By mastering digital skills, residents can obtain certain digital dividends. Digital inclusion affects people’s subjective well-being by reducing the cost of information acquisition, providing leisure and entertainment, increasing social activities, promoting consumption on online platforms and so on (Campante et al. Reference Campante, Durante and Sobbrio2018; Cilesiz Reference Cilesiz2009). Firstly, digital inclusion helps to increase connection, and these relationship quality indicators such as social support are related to the increase in well-being (Ahn and Shin Reference Ahn and Shin2013; Deters and Mehl Reference Deters and Mehl2013; Sen et al. Reference Sen, Prybutok and Prybutok2022). Secondly, digital inclusion brings new development opportunities. Through online political participation, individuals can expand their opportunities for democratic engagement (Chan et al. Reference Chan, Mak, Chan and Lin2021), gaining more sense of fairness and satisfaction (Zhong et al. Reference Zhong, Li and Xi2022). Thirdly, mastering digital skills can have a huge impact on residents’ income and social capital, and then affect well-being through this medium (Chan Reference Chan2018; Simons et al. Reference Simons, Reijnders, Janssens, Lataster and Jacobs2023).
Another view is that digital inclusion may undermine subjective well-being. The relative deprivation theory shows that people who find themselves at a disadvantage compared with others in the same living situation will experience a sense of deprivation (Büchi Reference Büchi2024; Helsper Reference Helsper2017). Excessive citation of information on internet platforms will cause people to easily compare themselves with others, leading them to underestimate their economic and social status (Lohmann Reference Lohmann2015). Excessive dependence on and use of the internet by individuals will lead to an atrophy of offline emotional interaction, reduce people’s interest in participating in social activities and thus reduce well-being (Huang Reference Huang2010; Sabatini and Sarracino Reference Sabatini and Sarracino2017). Moreover, “information cocoons”—where users confine themselves to a narrow, self-reinforcing information field—may impair individual’s well-being (He et al. Reference He, Liu, Guo and Guo2023). Excessive integration may trigger negative effects, including problems such as distraction, sleep disorders, anxiety and depression (Nowland et al. Reference Nowland, Necka and Cacioppo2018; Su et al. Reference Su, Zhou, Gong, Teng, Geng and Hu2021), reducing the individual’s mental health level and even inducing mental illness (Kraut and Burke Reference Kraut and Burke2015).
With the improvements in overall health levels, human lifespan is being continually extended, and society has made a further classification of older adults in the traditional sense. Now, those aged 75 and above are usually referred to as old-old adults, whose demand for personal care and medical services increases significantly due to declining physical functions. In contrast, individuals aged 60–74 are referred to as young-old adults, and they generally maintain relatively good physical and cognitive functioning (Burns et al. Reference Burns, Ailshire, Crimmins and Zhang2025; Ouchi et al. Reference Ouchi, Rakugi, Arai, Akishita, Ito, Toba and Kai2017). However, similar to other older adults, young-old adults also encounter certain physiological barriers and experience a digital divide when engaging with digital technologies (Rogers Reference Rogers2001).
In this study, we follow established demographic classifications and define middle-aged adults as those aged 45–59, and young-old adults as those aged 60–74 (Min et al. Reference Min, Topaz, Lee and Schnall2023). This distinction is especially relevant in China, where the statutory retirement age is comparatively low – typically 60 for men and 50–55 for women – so most young-old adults are already retired or transitioning into retirement, while middle-aged adults are generally still active in the workforce (Hu et al. Reference Hu, Chen and Halvorsen2024). The ongoing trend of delayed retirement and population ageing in China has made re-employment and continued workforce participation increasingly common among both groups (Dai et al. Reference Dai, Zhao, Sui and Xu2025). Accordingly, both middle-aged and young-old adults have a strong need and motivation to adopt digital technologies – whether to meet ongoing job demands, facilitate re-employment or navigate daily life in a digital society (Schuster and Cotten Reference Schuster and Cotten2022; Xu et al. Reference Xu, Yanlin and Lingzhi2021). By contrast, old-old adults are less likely to participate in the labour market but may still face substantial challenges in adapting to digital technologies (Li and Kostka Reference Li and Kostka2024).
Although some studies have examined digital inclusion and ageism (Fernández-Ardèvol and Grenier Reference Fernández-Ardèvol and Grenier2022; Mubarak and Suomi Reference Mubarak and Suomi2022), empirical research specifically focusing on the digital inclusion of middle-aged and young-old adults remains scarce, particularly in China. This article uses data from the Chinese Social Survey (CSS) to examine the impact of digital inclusion on the subjective well-being of the middle-aged and the young-old. The results show that the middle-aged and young-old who are digitally included have a stronger subjective sense of well-being, and this positive relationship remains robust and significant after considering differences in factors such as socio-economic status, social interaction and political participation. The marginal contributions of this article mainly include the following: Firstly, to the best of our knowledge, this is the first article to study the well-being of the middle-aged and the young-old. Discussing the association between digital inclusion and the well-being of the middle-aged and the young-old can provide implications for policy makers who plan to bridge the digital divide through the internet to influence the welfare of residents. Secondly, this article estimates the impact of different types of digital inclusion on the well-being of the middle-aged and the young-old, as well as the impact of factors such as socio-economic status, social connection and political participation on the well-being effect of digital inclusion. It can help decision-makers determine an effective path for internet use, thereby enhancing the policy effect of digitization. Thirdly, this article proposes a new well-being measurement indicator to measure individual well-being levels more comprehensively. In terms of article structure, the next section covers the data and methods; the third section provides the results of empirical analysis; the fourth part is further discussion; and the fifth part is the conclusion.
Data and method
Data
The data for this study are sourced from the CSS, overseen by the Institute of Sociology at the Chinese Academy of Social Sciences. The CSS, initiated in 2005, is conducted biennially using a probability sampling method for in-home interviews. The survey covers topics such as basic personal information, labour and employment, household economic conditions and social life status. The survey scope encompasses 31 provinces, 151 counties (districts, cities) and 604 villages (resident committees). This article focuses on the middle-aged and young-old demographic, utilizing data from two phases of the CSS between 2019 and 2021. In line with the research design, only individuals aged 45–74 were included, with samples missing key variables excluded. The final valid sample consists of 5,446 observations.
Variables and descriptive statistics
Dependent variables
Subjective well-being is not directly observable or measurable; however, in relevant studies, life satisfaction is often employed as a tangible indicator to gauge subjective well-being. Current research predominantly measures life satisfaction by scoring single variables related to individual life satisfaction. However, this method is susceptible to the emotional fluctuations of respondents, potentially leading to momentary and non-authentic evaluations of life satisfaction, which can introduce measurement errors. This is also one of the reasons why some scholars are cautious about well-being research. In view of this, drawing on relevant literature (Tan et al. Reference Tan, Kraus, Carpenter and Adler2020), this study constructs a comprehensive index of individual well-being – the Well-being Index of the Middle-Aged and the Young-Old – based on five dimensions: family relationships, economic status, educational level, leisure and entertainment, and social activities. Specifically, respondents rate their satisfaction with each dimension on a scale of 1–10; a higher score indicates higher satisfaction and a stronger sense of well-being. Furthermore, the variables of the five dimensions are standardized by age, and then the arithmetic mean of the standardized Z-scores of the five dimensions is taken as the Well-being Index, so that the index is comparable among different age groups (Huang and Liu Reference Huang and Liu2023).
Independent variables
This study assesses digital inclusion based on respondents’ answers to the questionnaire item ‘Do you usually use the internet?’ Those who answered ‘Yes’ are assigned a value of 1, indicating the achievement of digital inclusion, while those who answered ‘No’ are assigned a value of 0, indicating the lack of digital inclusion. Furthermore, to explore the effect of digital inclusion dimensions on well-being, this article also selects four variables: digital information inclusion, digital entertainment inclusion, digital social inclusion and digital learning inclusion. These are measured based on the frequency with which respondents use the internet for information browsing, entertainment and leisure, chatting and socializing, and learning and working. The scale ranges from ‘Never’, which is assigned a value of 0; through ‘A few times a year’, given a value of 1; ‘At least once a month’, assigned a value of 2; ‘At least once a week’, given a value of 3; and ‘Multiple times a week’, assigned a value of 4; to ‘Almost every day’, which is given a value of 5.
Control variables
Building upon prior research, this study incorporates control variables at three levels: the individual, the family and the social level. Individual-level control variables encompass: gender (men = 1, women = 0), age (calculated as the survey year minus the year of birth), hukou (household registration system in China: non-agricultural = 1, agricultural = 0), marital status (married = 1, unmarried = 0), education (primary school and below = 1, junior high school = 2, high school/vocational school = 3, college and above = 4) and employment (employed = 1, unemployed = 0). Family-level control variables include: family size (number of family members) and financial status (income exceeds expenditure = 1, income equals expenditure = 2, income is less than expenditure = 3). Social-level control variables comprise: social trust (evaluated on a scale of 1–10, with 1 indicating a high level of distrust and 10 indicating a high level of trust) and social fairness (assessed on a scale of 1–10, with 1 indicating a high level of perceived unfairness and 10 indicating a high level of perceived fairness). Furthermore, considering that individual digital inclusion may vary across different years and regions, time-fixed effects and region-fixed effects are employed to control for time level and regional level effects, respectively.
Descriptive statistics
For the convenience of comparison, Table 1 presents the descriptive statistics of the entire sample as well as the grouped descriptive statistics. As shown in Table 1, the mean level of well-being among the middle-aged and the young-old is 0.0002, which is at the 63.42th percentile of the perceived well-being levels of the sampled residents. This indicates that the residents in the sample have a relatively high level of satisfaction with living conditions and a stronger sense of well-being. The proportion of digital inclusion among the sampled residents just reaches 36%, suggesting that the digital integration level of middle-aged and young-old is relatively low and there is a digital divide.
Descriptive statistics

In terms of the control variables, at the individual level they are as follows: (1) gender – 46.35% across the sample are men and 48.84% of those who have achieved digital inclusion are men; (2) age – the average across the sample is 57 years and the average of those who have achieved digital inclusion is 54 years; (3) hukou – across the sample, 28.42% have non-agricultural household registration, while of those who have achieved digital inclusion, 46.57% have non-agricultural household registration; (4) marital status – 88.06% across the sample are married and 89.05% of those who have achieved digital inclusion are married; (5) education – across the entire sample the average education level is junior high school, while the average education level of those who have achieved digital inclusion is high school; (6) employment – 59.11% across the sample are employed, while 62.56% of those who have achieved digital inclusion are employed. At the family level: (1) family size – the average across the sample is five members, and of those who have achieved digital inclusion the average is four members; (2) financial status – both across the entire sample and in relation to those who have achieved digital inclusion, everyone has a balanced income and expenditure status. At the social level: (1) social trust – there is a high level of social trust across the entire sample, rated at 6.53; (2) social fairness – across the entire sample, the rating of societal fairness is 6.94.
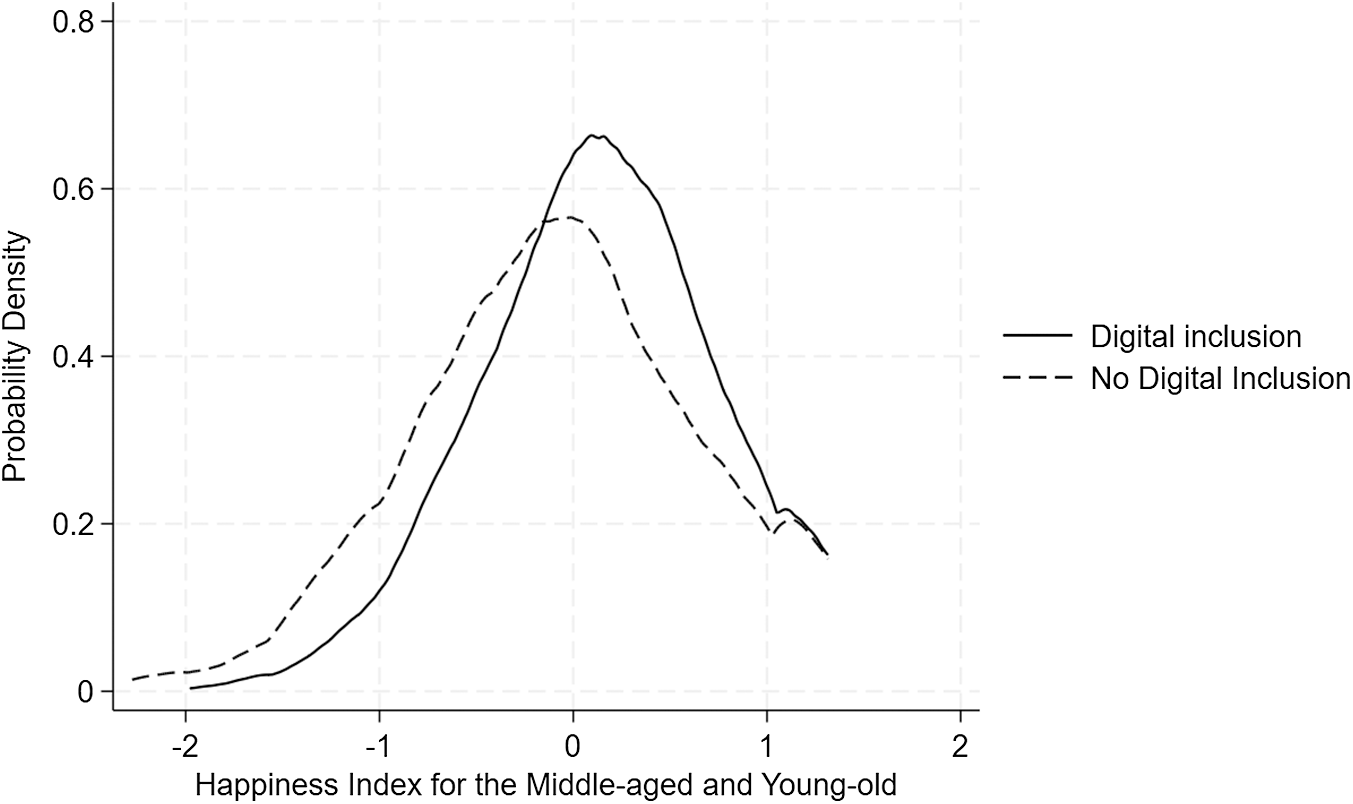
To further examine the potential association between digital inclusion and the well-being of the middle-aged and the young-old, this study presents Figure 1, which contrasts the distribution density of the Well-being Index for the Middle-Aged and the Young-Old who have and have not achieved digital inclusion. The results indicate that among the less happy samples (where the mean Well-being Index is less than 0), there is a higher proportion of the middle-aged and the young-old who have not achieved digital inclusion. Conversely, among the happier samples (where the mean Well-being Index is greater than 0), there is a higher proportion of the middle-aged and the young-old who have achieved digital inclusion. This preliminary observation suggests that digital inclusion has a significant impact on enhancing the well-being of the middle-aged and the young-old.
Probability density plot of well-being for the middle-aged and the young-old (digital inclusion vs no digital inclusion).

Analytical strategy
The primary objective of this study is to ascertain the causal effect of digital inclusion on the well-being of the middle-aged and the young-old, with well-being a continuous variable. Accordingly, the model is specified as follows:
 \begin{equation}Happines{s_{ict}} = {\alpha _0} + {\alpha _1}Dig\_Inclusio{n_{ict}} + \gamma {X_{ict}} + {u_c} + {\mu _t} + {\varepsilon _{ict}}\end{equation}
Here, i, c and t represent the individual, province and year, respectively. The dependent variable Happinessict represents the Well-being Index. Dig_Inclusionict denotes the status of digital inclusion, where Dig_Inclusionict = 1 indicates that the individual has achieved digital inclusion, and 0 otherwise. Further, Xict represents a set of control variables that affect personal well-being, including factors at the individual, family and societal levels; uc represents region fixed effects, which control characteristics at the province level that do not vary over time, while μt denotes time fixed effects, which account for variables that change over time but are constant across regions; and εict is the stochastic disturbance term. The key coefficient α 1 represents the impact of digital inclusion on the well-being of the middle-aged and the young-old.
Results
Baseline results
Columns (1) and (2) of Table 2 report the effect of digital inclusion on the happiness of middle-aged and young-old individuals across various columns. Specifically, Column (1) controls variables at the individual, family and societal levels that may influence the happiness of middle-aged and young-old individuals; Column (2) further incorporates time and region fixed effects. In all regression results, the impact coefficient of digital inclusion on the happiness of middle-aged and young-old individuals is consistently positive and statistically significant at the 1% level, indicating that digital inclusion contributes to enhancing individual happiness. According to the results in Column (2), individuals with digital inclusion experience a happiness level that is 0.1386 units higher than others. Age, education, hukou, marital status, employment, family size, social trust and social fairness all have a significantly positive effect on the happiness of middle-aged and young-old individuals. Gender and financial situation have a significantly negative effect on the happiness of middle-aged and young-old individuals.
Effect of digital inclusion on well-being

Notes: Standard errors clustered at the individual level are reported in parentheses;
* p < 0.1, **p < 0.05, ***p < 0.01.
Which dimension of digital inclusion is associated with greater well-being?
Columns (3) to (6) of Table 2 present the regression results of the impact of four dimensions of digital inclusion – digital information inclusion, digital entertainment inclusion, digital social inclusion and digital learning inclusion – on the well-being of the middle-aged and the young-old. The results indicate that the impact of each dimension of digital inclusion on well-being is significant at the 1% confidence level, suggesting that individuals are more likely to enhance their overall sense of well-being through the internet. Among these, the positive effect of digital learning inclusion on individual well-being is the most pronounced; this dimension of digital inclusion not only expands the boundaries of knowledge but also yields benefits for individuals on both spiritual and material levels. In contrast, the benefits of well-being derived from digital entertainment inclusion are relatively lower.
Robustness tests
Alternate the definition of well-being
To ensure the robustness of the aforementioned results, this study employs an alternative measure of individual well-being based on respondents’ answers to the questionnaire item, ‘Overall, how satisfied are you with your life?’ This variable is scored on a scale of 1–10, with higher scores indicating greater satisfaction with life; thus, an individual’s overall life satisfaction can reflect their sense of well-being to a certain extent. In Table 3, Columns (1) and (2) present the regression results using the alternative variable, which demonstrates that digital inclusion significantly promotes the enhancement of well-being among the middle-aged and the young-old. The results remain significant after replacing the dependent variable, confirming the robustness of the previous findings.
Robustness test

Notes: Standard errors clustered at the individual level are reported in parentheses;
* p < 0.1, **p < 0.05, ***p < 0.01.
Alternative sample size
In the baseline regression, the Well-being Index may be influenced by extreme values, leading to potential bias in the estimation of the effect of digital inclusion on well-being. Therefore, this study trims the Well-being Index of the dependent variable at the 1% level (both tails) to discuss the impact of digital inclusion on the well-being of the middle-aged and the young-old. The results are detailed in Table 3, Column (3), which indicates that, after the 1% two-tailed trimming, digital inclusion can enhance the well-being of the middle-aged and the young-old. This further confirms the robustness of the baseline regression results.
Instrumental variable method
When examining the effect of digital inclusion on individual well-being, although this study controls several factors that may influence individual well-being, there are numerous elements that could affect well-being, potentially leading to omitted variable bias. Additionally, there is the possibility of reverse causality, where well-being might affect their digital inclusion. To address potential endogeneity issues, this study employs an instrumental variable method.
Drawing on the selection of instruments by and Sabatini and Sarracino (Reference Sabatini and Sarracino2017), we use the ‘average digital inclusion of other individuals at the county level’ as instruments for digital inclusion. Firstly, the level of digital inclusion of other individuals can influence one’s own digital inclusion, satisfying the relevance assumption. Secondly, the county-level data remain unchanged by individual actions, fulfilling the exogeneity assumption. Moreover, the first-stage F-statistic is greater than 10, suggesting that the chosen instruments are strongly correlated with the endogenous variable and that weak instrument concerns are minimal. Therefore, it is reasonably confident to conclude that the chosen instruments are appropriate and the model’s estimation results are reliable.
In Table 3, Column (4) presents the first-stage regression results for the endogenous variable, where the ‘average digital inclusion of other individuals at the county level’ variable has positive estimated coefficients that are significant at the 1% statistical level, indicating a strong correlation with digital inclusion. Also in Table 3, Column (5) shows the second-stage main regression results; after correcting for endogeneity, the estimated coefficient for the digital inclusion variable remains positive and is significant at the 10% statistical level, indicating that the baseline results are robust.
Discussion
In this section, we attempt to conduct an empirical test to explore what factors can, to some extent, help us understand the impact of digital inclusion on the well-being of the middle-aged and the young-old. Of course, due to the numerous factors influencing human behaviour, the research here is only tentative.
Does greater well-being with digital inclusion reflect only improved socio-economic status?
Class identification is closely related to the level of individual well-being (Zhou et al. Reference Zhou, Chen, Chen and Li2021). Based on the current class positioning, individuals form a judgement of their own situation after comparing with those around them or with their own future expectations (Kraus et al. Reference Kraus, Piff, Mendoza-Denton, Rheinschmidt and Keltner2012). Digital inclusion broadens the individual’s comparative vision from the acquaintance society to the network society (Karimi and Matous Reference Karimi and Matous2018). The public reference information provided by digital inclusion will cause residents to make comparisons, and then over/under-estimate their actual socio-economic status. Therefore, we need to examine whether residents with digital inclusion will have higher well-being due to their higher socio-economic status. In this article, using the variables provided by CSS, we use the response to ‘Which level do you think your current socio-economic status in the local area generally belongs to?’ as a proxy variable. If the response is ‘middle, upper-middle, upper’, the socio-economic status is 1; otherwise, it is 0. This article uses Model (2) to explore whether the coefficient of digital inclusion is still significantly positive after controlling for socio-economic status. The results are shown in Table 4. We use ‘whether using the internet or not’ as a measure of digital inclusion, and β is still significantly positive, indicating that, even considering the socio-economic status, the promotion of well-being by digital inclusion still exists significantly.
 \begin{equation}Happines{s_{ict}} = {\beta _0} + {\beta _1}Dig\_inclusio{n_{ict}} + {\beta _2}Diwe{i_{ict}} + \gamma {X_{ict}} + {u_c} + {\mu _t} + {\varepsilon _{ict}}\end{equation}
Digital inclusion, socio-economic status and well-being

Notes: Standard errors clustered at the individual level are reported in parentheses.
** p < 0.05, *** p < 0.01.
If the impact of digital inclusion on well-being is related to socio-economic status, then we naturally wonder: Will the improvement of socio-economic status strengthen this impact? If this hypothesis holds, there are the following two inferences: first, the well-being of individuals with higher socio-economic status is not affected by digital inclusion; and second, the level of socio-economic status will affect the degree of the impact of digital inclusion on the well-being of the middle-aged and the young-old. We use group-based tests and Model (3), respectively, to test these two inferences. Model (3) adds the cross-term of socio-economic status and digital inclusion on the basis of Model (2). If the coefficient β3 is significantly greater than zero, it indicates that improvement of socio-economic status will significantly strengthen the positive impact of digital inclusion on well-being.
 \begin{align}
Happines{s_{ict}} &= {\beta _0} + {\beta _1}Interne{t_{ict}} + {\beta _2}Diwe{i_{ict}} + {\beta _3}Interne{t_{ict}} \times Diwe{i_{ict}} \nonumber \\
&\quad + \gamma {X_{ict}} + {u_c} + {\mu _t} + {\varepsilon _{ict}}
\end{align}
Table 4 reports empirical results testing the two inferences mentioned above. Columns (2) and (3) present the results of the group-based tests. In both the low and the high socio-economic status subgroups, the coefficients of digital inclusion are positive and highly significant, indicating that digital inclusion significantly enhances well-being for both groups. This result does not support the first inference, as the well-being of individuals with higher socio-economic status is still significantly affected by digital inclusion. Column (4) shows the estimation results of Model (3), where the estimated coefficient of the cross-term is positive but statistically insignificant. This suggests that the positive effect of digital inclusion on well-being does not vary significantly with socio-economic status, providing no support for the second inference. Overall, the findings demonstrate that digital inclusion robustly improves the well-being of middle-aged and young-old individuals, regardless of their socio-economic status, and this effect is not significantly moderated by socio-economic status.
Does greater well-being with digital inclusion reflect only increased social connectedness?
There is a possibility that residents with digital inclusion may have less resistance to integrating into social life and are more likely to establish social networks, thus having higher levels of social participation and social interaction. Some scholars have found that social connection can affect well-being (Clark et al. Reference Clark, Algoe and Green2017). Therefore, we need to examine whether the relatively high well-being of the middle-aged and the young-old with digital inclusion can be fully explained by relatively high social connections. Firstly, we need to find a proxy variable for ‘social connection’; we use household gift-money expenditure to represent the level of family social interaction (Hu et al. Reference Hu, Xiang and Zhong2021). If the household gift-money expenditure of the respondent is greater than 0, social interaction takes 1 (high level of social connection); otherwise, it takes 0 (low level of social connection). Similar to the part of socio-economic status, the test results of control variables, grouping and cross-terms are shown in Table 5. We find that, after controlling social connection, β is still significantly positive with an effect of 0.1885, indicating that social connection cannot fully explain the impact of digital inclusion on the improvement of well-being (Column [1]). The results of the grouped regression show that, regardless of the level of social connection, the coefficient of digital inclusion is significantly positive (Columns [2] and [3]). The regression results with the cross-term added show that the estimated coefficient of the cross-term is significantly negative (Column [4]). This indicates that the enhancement of social connection will instead reduce the well-being improvement effect of digital inclusion.
Digital inclusion, social connection and well-being

Notes: Standard errors clustered at the individual level are reported in parentheses.
** p < 0.05, ***p < 0.01.
Does greater well-being with digital inclusion reflect only increased political engagement?
Similarly, political participation also needs to be considered. The middle-aged and the young-old can better participate in various political activities through the internet, including safeguarding rights and voicing opinions. The degree of political participation has an important impact on the well-being level of middle-aged and young-old (Pirralha Reference Pirralha2017). Therefore, we need to examine whether individuals with digital inclusion will have higher well-being due to higher political participation.
In the Chinese context, the concept of ‘political participation’ is broader than in many Western countries. While Western definitions often emphasize voting, party membership or campaigning, political participation in China typically involves engagement in community governance, communication with authorities and participation in collective actions, which are not always directly related to formal political institutions (Ma and Cao Reference Ma and Cao2023).
The CSS data provide indicators regarding political participation. In response to the question ‘Have you participated in the following things?’ in the CSS questionnaire, the possible answers are: ‘(1) Discuss political issues with others or netizens; (2) Report social problems to newspapers, radio stations, online forums and other media; (3) Report opinions to government departments (including through telephone, email, etc.); (4) Use professional knowledge to participate in public policy and public affairs seminars; (5) Publish personal opinions on government-announced policies through various channels; (6) Attend public policy hearings organized by government departments; (7) Petition to government departments; (8) Participate in major decision-making discussions in the village/unit where you live; (9) Participate in social welfare activities organized by the community or spontaneously, such as voluntary blood donation, voluntary environmental cleaning and providing voluntary help to older adults, the disabled and the sick; (10) Participate in religious activities; (11) Participate in online/offline collective rights-protecting actions’. We define the political participation indicator of an individual who participates in any one of these as 1 (high degree of political participation); otherwise, it is 0 (low degree of political participation). Similar to the previous content, the test results of control variables, grouping and cross-terms are shown in Table 6. We find that, after controlling the level of political participation, β is still positive, indicating that political participation cannot fully explain the enhancement of well-being brought about by digital inclusion among the middle-aged and the young-old. The results of the grouped regression show that, regardless of the level of political participation, the coefficient of digital inclusion is significantly positive. The regression results with the cross-term added show that the estimated coefficient of the cross-term is insignificant. This indicates that increase in enthusiasm for political participation will not reduce the well-being effect of digital inclusion.
Digital inclusion, political participation and well-being

Notes: Standard errors clustered at the individual level are reported in parentheses.
*** p < 0.01.
Conclusion
This study takes the middle-aged and the young-old as the research objects and discusses how digital inclusion affects individual subjective well-being and the moderating factors that promote or inhibit the subjective well-being of this group during this process. The research findings are as follows. Firstly, compared with individuals who are not digitally included, the middle-aged and the young-old with digital inclusion have a stronger sense of well-being. Secondly, digital inclusion in all four dimensions has a positive impact on individual well-being, among which digital learning inclusion has the most significant positive impact on individual well-being. Thirdly, this relationship cannot be completely explained by differences in factors such as socio-economic status, social connection and political participation, but social connection may weaken the well-being improvement effect of digital inclusion. However, the factors influencing human behaviour are quite complex, and we expect that future research can continue to explore how digital inclusion affects individual well-being.
If these findings are reliable, they indicate that digital inclusion may have a long-lasting and far-reaching impact on the well-being of the middle-aged and the young-old. In light of these findings, we make the following suggestions: On the one hand, increase investment in digital infrastructure and general-purpose digital application platforms, ensure the breadth and depth of network coverage and lower the threshold for the middle-aged and the young-old to enter the digital world; and establish a digital skills training system to guide the middle-aged and the young-old to cultivate their digital learning capabilities and actively maximize the role of digital resources. This can be achieved by leveraging the roles of schools, training institutions, social organizations and other institutions to improve the level of digital inclusion. On the other hand, when formulating relevant digital development policies, fully consider social connection factors. For example, in the promotion of digital social platforms, design functions that are conducive to helping the middle-aged and the young-old to establish and maintain interpersonal relationships, encourage the middle-aged and young-old to learn from and help each other, promote the consolidation and development of social connection, and avoid the occurrence of social isolation caused by digital inclusion.
Acknowledgements
The data utilized in this article are derived from the major project ‘2021 Chinese Social Survey’, conducted by the Institute of Sociology, Chinese Academy of Social Sciences. The project was led by Professor Guangjin Chen and Professor Wei Li. The authors would like to thank the above institutions and their staff for providing data support. The content of this article is solely the responsibility of the authors. We are also grateful to the editor and anonymous reviewers for their thoughtful comments and constructive suggestions, which have helped us to substantially improve the clarity and overall quality of this manuscript.
Financial support
This research was supported by the General Project of Philosophy and Social Sciences Research in Universities of Jiangsu Province, “Optimization and Policy Integration of the Long-term Care Service System for Disabled Older Adults.” (2025SJYB0216)
Competing interests
The authors declare no competing interests.
Ethical standards
This study uses data from the ‘2021 Chinese Social Survey’ conducted by the Institute of Sociology, Chinese Academy of Social Sciences. According to national regulations (§23 of the Declaration of Helsinki), such non-interventional survey data usually do not require additional ethics committee approval. However, the data collection process was overseen by the project’s internal ethics procedures.