Introduction
With the advent of nanotechnologies and nanomedicine, numerous fluorescent optical nanoprobes have been designed for in vitro, ex vivo, and in vivo bio-imaging, such as dye-doped silica nanoparticles,[Reference Wang, He, Yang and Shi1] rare earth-doped nanocrystals,[Reference Bouzigues, Gacoin and Alexandrou2] and nanodiamonds[Reference Faklaris, Garrot, Joshi, Druon, Boudou, Sauvage, Georges, Curmi and Treussart3] as recently reviewed.[Reference Wolfbeis4] For in vivo experiments, the penetration depth is a crucial parameter[Reference Gigan5] and the use of emitters with excitation properties in the near-infrared (NIR) region and the so-called biologic transparency windows (BWs) is required. Based on down-conversion fluorescence, Nd3+-doped fluorescence probes[Reference Dantelle, Matulionyte, Testemale, Cantarano, Ibanez and Vetrone6,Reference del Rosal, Rocha, Ximendes, Martín Rodríguez, Jaque and García Sol7] or more complex multi-doped architectures[Reference Wang, Li, Zhou and Zhang8,Reference Tan, del Rosal, Zhang, Martín Rodríguez, Hu, Zhou, Fan, Ortgies, Fernández, Chaves-Coira, Núñez, Jaque and Chen9] have raised high interest with their excitation at 808 nm and their emission in the first (750–950 nm), second (1000–1350 nm), and third (1500–1800 nm) BWs, ensuring deep tissue imaging while minimizing tissue autofluorescence and photon scattering. Similarly, PbS or InP quantum dots appear as good candidates for biologic applications thanks to their tunable NIR emission.[Reference Chinnathambi and Shirahata10] Among other recent developments, the use of nanoprobes excited through a two-photon process has also been studied, allowing an excitation in the BWs and resulting in a higher spatial selectivity than the one-photon down-conversion fluorescence, as the emission only occurs at the focal point of the excitation laser. Up-conversion photoluminescence (UC-PL), two-photon excitation fluorescence, and second harmonic generation (SHG) are the different envisioned processes. The latter, characterized by transitions from virtual levels, offers the advantage of a tunable excitation in the material transparency range and in the different BWs.
To benefit from the advantages of the different fluorescence-based and nonlinear optical (NLO) imaging techniques, bimodal nanoprobes were recently introduced.[Reference Mayer, Dantelle, Jacques, Perruchas, Patriarche, Roch and Gacoin11] For instance, UC-PL and SHG-active nanoprobes would allow to combine the advantages of both processes: PL can be easily detected using conventional microscopy platforms but is a slow process (typical excited-state lifetimes for rare earth emitters are of the order of tens of μs to ms), whereas NLO imaging from harmonic nanoparticles (HNPs)[Reference Pantazis, Maloney, Wu and Fraser12,Reference Staedler, Magouroux, Hadji, Joulaud, Extermann, Schwung, Passemard, Kasparian, Clarke, Gerrmann, Le Dantec, Mugnier, Rytz, Ciepielewski, Galez, Gerber-Lemaire, Juillerat-Jeanneret, Bonacina and Wolf13] is less implemented on commercial microscopes. SHG and third harmonic generation (THG) signals are polarization-sensitive, instantaneous processes and their simultaneous acquisition results in rapid two-dimensional scans and a better imaging selectivity in demanding applications.[Reference Dubreil, Leroux, Ledevin, Schleder, Lagalice, Lovo, Fleurisson, Passemard, Kilin, Gerber-Lemaire, Colle, Bonacina and Rouger14] In addition, SHG- and THG-active nanoprobes do not evidence any blinking, photobleaching, or saturation process, allowing prolonged studies.[Reference Slenders, Bove, Urbain, Mugnier, Yasin Sonay, Pantazis, Bonacina, Vanden Berghe, vandeVen and Ameloot15,Reference Le, Zhou, Slablab, Chauvat, Tard, Perruchas, Gacoin, Villeval and Roch16] However, only a very limited number of nanosources producing both SHG and UC-PL have been reported in the literature[Reference Mayer, Dantelle, Jacques, Perruchas, Patriarche, Roch and Gacoin11] due to the difficulty to find a single-phase nanomaterial that is both non-centrosymmetric and a good host for luminescent species.
Acentric α-La(IO3)3 is known for its SHG activity as initially demonstrated from comparative micron-sized powder experiments.[Reference Ok and Halasyamani17,Reference Taouti, Suffren, Leynaud, Benbertal, Brenier and Gautier-Luneau18] Recently, we reported the synthesis of α-La(IO3)3 nanocrystals and the quantitative assessment of its orientation-averaged SHG efficiency[Reference Regny, Riporto, Mugnier, Le Dantec, Kodjikian, Pairis, Gautier-Luneau and Dantelle19] that was found comparable to the other HNPs of interest (KTP, BaTiO3, LiNbO3, etc.).[Reference Joulaud, Mugnier, Djanta, Dubled, Marty, Galez, Wolf, Bonacina and Le Dantec20,Reference Riporto, Urbain, Mugnier, Multian, Riporto, Bredillet, Beauquis, Galez, Monnier, Chevolot, Gayvoronsky, Bonacina and Le Dantec21] We also evidenced the possibility of doping α-La(IO3)3 nanocrystals with Er3+ ions by La3+ substitution and showed that Er3+-doped α-La(IO3)3 nanocrystals emit both UC-PL and SHG signals under 800- and 980-nm excitations. Here we report on multifunctional Yb3+,Er3+-doped α-La(IO3)3 nanocrystals demonstrating optimized UC-PL properties and a strong SHG activity. In addition, because of the resonant conditions of UC-PL and the intrinsic non-resonant behavior of SHG in the material transparency range, special attention has been paid to a possible interplay between the two signals when the excitation wavelength is scanned around the Yb3+ and Er3+ absorption bands.
Results and discussion
Synthesis of α-La1−y−xYbyErx(IO3)3 nanocrystals
α-La1−y−xYbyErx(IO3)3 nanocrystals, with y = 0.1 and x = 0.005, 0.01, and 0.02, were synthesized using a microwave-assisted hydrothermal method, as reported in Ref. [Reference Regny, Riporto, Mugnier, Le Dantec, Kodjikian, Pairis, Gautier-Luneau and Dantelle19]. In the following, the nanocrystals will be referred to as α-La0.9−xYb0.1Erx(IO3)3. Briefly, LaCl3, YbCl3, ErCl3, and HIO3 precursors (all purchased from Sigma-Aldrich, France, purity >99.9%) were mixed in water and introduced into a quartz vessel, tightly sealed. The mixture was then heated through microwave radiations (power: 800 W) at 250 °C for 10 min. After cooling down (cooling rate: 10 °C/min), the obtained powders were washed with pure water and dried at room temperature. Nanocrystals were then mixed in ethylene glycol and sonicated for 15 min at a typical concentration of 0.1 mg/mL so as to obtain dispersions for the subsequent optical characterizations. Note that the quantity of inserted rare-earth ions inside the α-La(IO3)3 matrix is relatively large (>10 mol%) and that the term “doping” may not be strictly speaking the more appropriate. However, for the sake of consistency with this research field, it will be used throughout this paper.
Characterization of nanocrystal structure and morphology
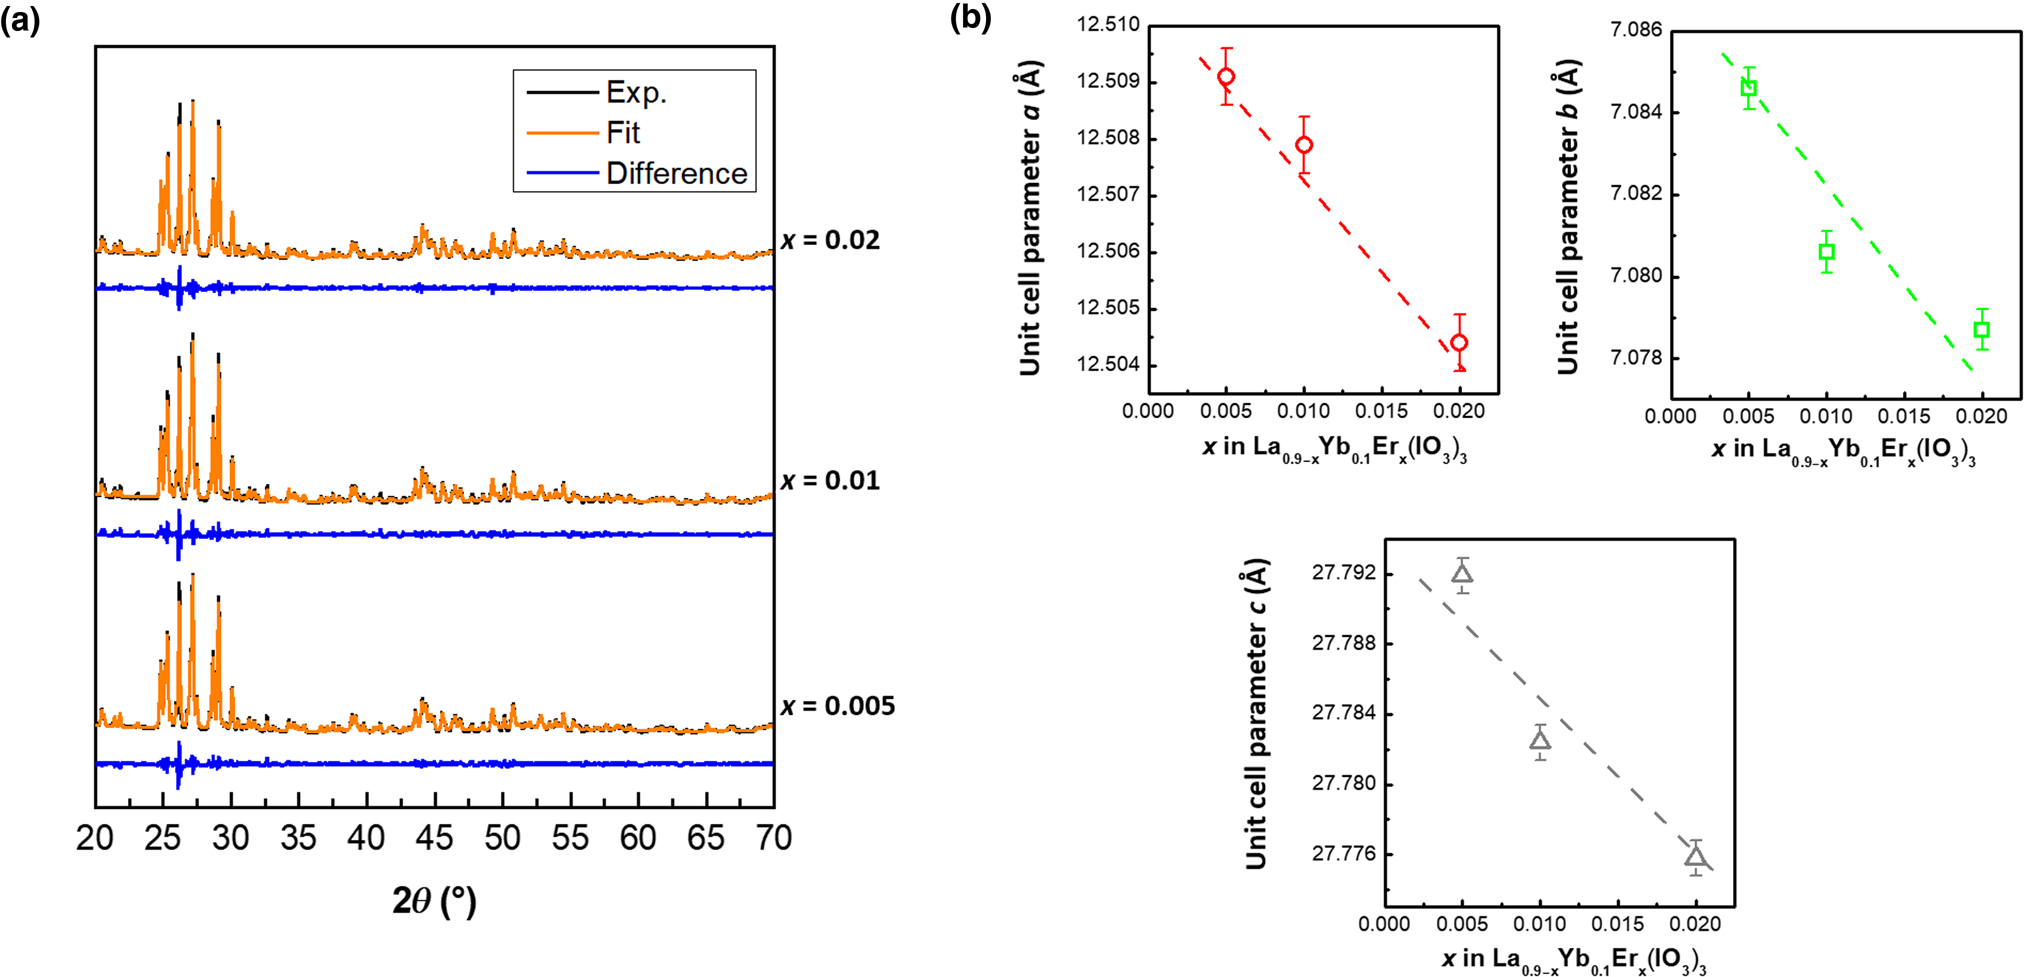
Obtained α-La0.9−xYb0.1Erx(IO3)3 powders were characterized by powder x-ray diffraction (PXRD) using a Siemens D8 Advance diffractometer (Cu Kα1 radiation, 40 mA, 40 kV). Figure 1(a) shows the PXRD diagrams of La0.9−xYb0.1Erx(IO3)3 with x = 0.005, 0.01, and 0.02, along with their associated Le Bail refinements, based on already published results as input parameters (ICSD card #171250).[Reference Ok and Halasyamani17] No phase impurity was detected. This is consistent with the results published by Taouti et al. on α-La(IO3)3 and by Suffren et al. on β-La(IO3)3 as both polymorphs can incorporate more than 10 mol% of Yb3+.[Reference Taouti, Suffren, Leynaud, Benbertal, Brenier and Gautier-Luneau18,Reference Suffren, Leynaud, Plaindoux, Brenier and Gautier-Luneau22]
(a) PXRD diagrams of α-La0.9−xYb0.1Erx(IO3)3 for x = 0.005, 0.01, and 0.02 and their associated Le Bail fits. α-La(IO3)3 is a monoclinic phase, crystallizing in the Cc space group. (b) Evolution of the unit cell parameters a, b, and c as a function of x in α- La0.9−xYb0.1Erx(IO3)3.

The unit cell parameters of La0.9−xYb0.1Erx(IO3)3 were obtained from the Le Bail fits and are shown in Fig. 1(b). As the concentration of Er3+ is raised, the unit cell parameters a, b, and c become smaller according to the Vegard's law. It is consistent with the decrease in the ionic radius from La3+ (r La3+ = 1.216 Å in a ninefold coordinated environment) to Er3+ (r Er3+ = 1.062 Å in a ninefold coordinated environment) and evidences the substitution of La3+ by Er3+ upon doping. In addition, the coherence length, L c, of the crystalline domains obtained from the Le Bail fits assuming an isotropic broadening is about 60 ± 10 nm for each composition.
For La0.9Yb0.1(IO3)3, the values of the cell parameters can be derived through the extrapolation of the linear regression at x = 0 from Fig. 1(b). It results in a = 12.5110(5) Å, b = 7.0860(5) Å, and c = 27.7965(5) Å. All these values are smaller than that of pure α-La(IO3)3 (a = 12.526(2) Å, b = 7.0939(9) Å, and c = 27.823(4)[Reference Ok and Halasyamani17]) again in good agreement with the reduction of ionic radius from La3+ to Yb3+(r Yb3+ = 1.042 Å) and with the substitution of La3+ by Yb3+.
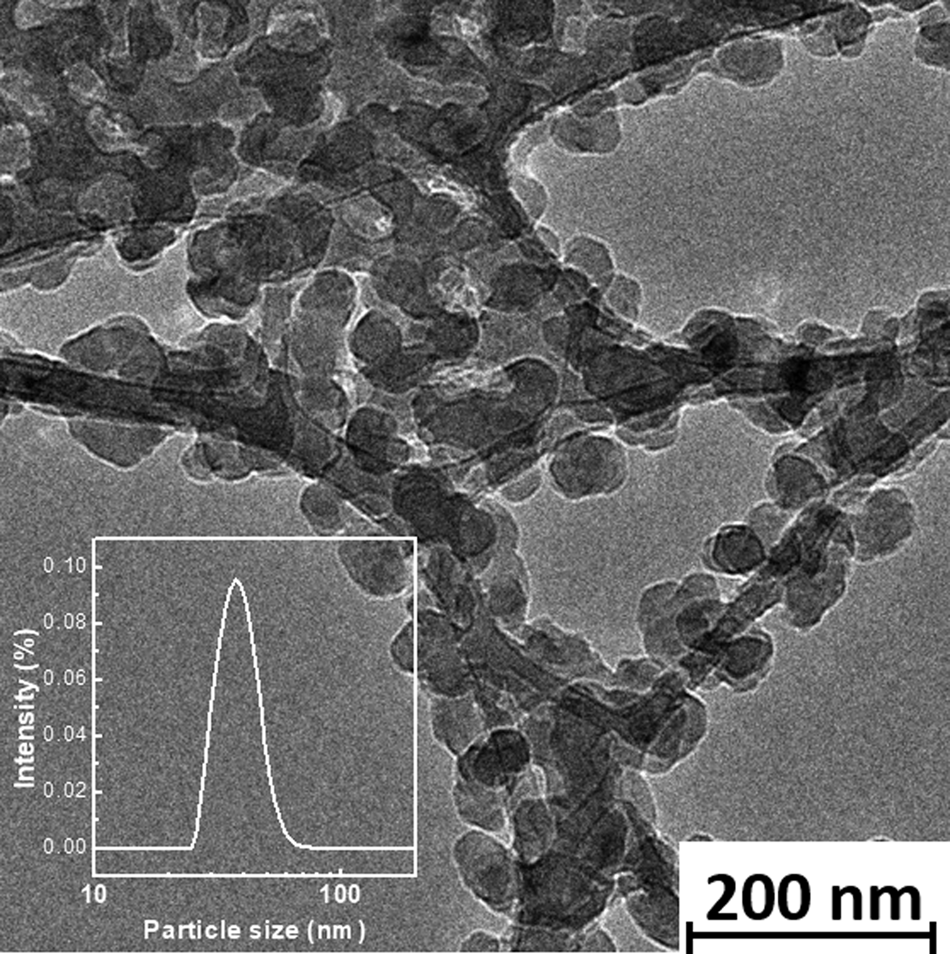
The obtained α-La0.9−xYb0.1Erx(IO3)3 powders were dispersed in ethylene glycol using ultra-sound bath (for 15 min at room temperature). Dilute solutions were obtained by successive dilutions and drop-casted onto transmission electron microscopy (TEM) grids (Cu, 300 mesh, Electron Microscopy Sciences). After 4 days of drying at 80 °C to remove any trace of solvent, the carbon grids were inserted into a TEM (Philips CM300) operating at 300 kV and 77 K. Figure 2 shows a typical TEM image of α-La0.88Yb0.1Er0.02(IO3)3, representative of all α-La0.9−xYb0.1Erx(IO3)3 compounds. One can observe that the nanocrystals are homogeneous in size, with a typical average size of 50 ± 10 nm. This value is consistent with the coherence length (L c = 60 ± 10 nm) previously determined and attests the single-crystal character of the obtained α-La0.9−xYb0.1Erx(IO3)3 nanocrystals. It is worth mentioning that, as previously reported in Ref. [Reference Regny, Riporto, Mugnier, Le Dantec, Kodjikian, Pairis, Gautier-Luneau and Dantelle19], doped and undoped α-La(IO3)3 nanocrystals present a strong affinity for the TEM carbon-coated Cu grids, resulting in a high coverage density.
Typical TEM image of α-La0.88Yb0.1Er0.02(IO3)3 nanocrystals recorded at 77 K. In the inset is shown the size distribution by intensity measured by DLS from La0.88Yb0.1Er0.02(IO3)3 nanocrystals dispersed in ethylene glycol.

In addition, dynamic light scattering (DLS) measurements performed from the ethylene glycol dispersions of α-La0.9−xYb0.1Erx(IO3)3 nanocrystals confirm the above-size estimations (TEM and PXRD) whatever the Er3+ concentration (inset in Fig. 2).
Evidence of multiple emission from α-La0.9−xYb0.1Erx(IO3)3 dispersions
The orientation-averaged optical properties of α-La0.9−xYb0.1Erx(IO3)3 nanocrystals dispersed in ethylene glycol were studied using the hyper-Rayleigh Scattering (HRS) configuration with a tunable (700–1300 nm) vertically polarized femtosecond Laser (Insight X3 Spectra-Physics, 80 MHz, 100–120 fs) as the excitation source.[Reference Regny, Riporto, Mugnier, Le Dantec, Kodjikian, Pairis, Gautier-Luneau and Dantelle19,Reference Riporto, Urbain, Mugnier, Multian, Riporto, Bredillet, Beauquis, Galez, Monnier, Chevolot, Gayvoronsky, Bonacina and Le Dantec21] Emitted signals were collected perpendicularly to the laser beam through a spectrometer (Andor Shamrock 193) coupled to a CCD camera (Andor iDus 401). The power-law dependences were obtained by adjusting the excitation power from 250 to 800 mW thanks to a half-wave plate associated with a polarizer cube. The peak intensity within the sample ranges from 0.5 to 1.6 GW/cm2 and the average intensity from 4.5 to 13 kW/cm2. Note that the peak intensity range is to be considered for the second harmonic scattering (SHS) process, whereas, the average intensity is assumed for the UC-PL signals since the typical excited state lifetime of Er3+ is of the order of several tens of μs, i.e., much longer than the excitation fs laser pulse.
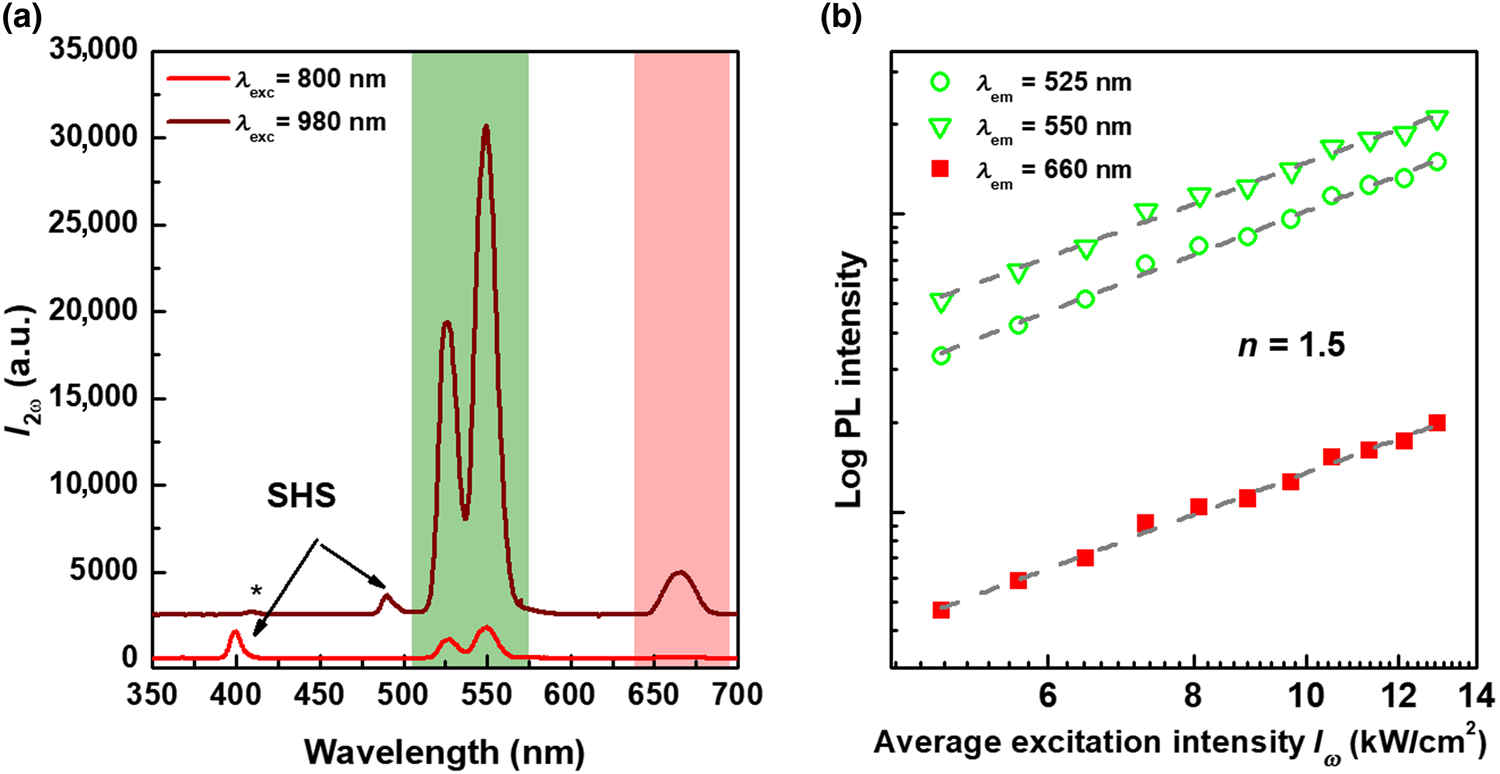
All dispersions of α-La0.9−xYb0.1Erx(IO3)3 nanocrystals in ethylene glycol emit several characteristic optical signals corresponding to SHG and UC-PL, as illustrated in Fig. 3(a) for two resonant excitation wavelengths at 800 nm (red curve) and 980 nm (dark red curve). Arrows indicate the SHS signal whose position varies with the excitation wavelength, namely, λ SHS = 400 nm for λ exc = 800 nm and λ SHS = 490 nm for λ exc = 980 nm. In addition, the power-law dependence of the SHS intensity scales quadratically with the peak intensity as expected for SHS (Supplementary Fig. S1). The other characteristic peaks centered at 525, 550, and 660 nm are independent of the excitation wavelength and correspond to the UC-PL process through the well-known Er3+ electronic transitions. As reminded in Supplementary Fig. S2, the peaks at 525, 550, and 660 nm are associated with the 2H11/2 → 4I15/2, 4S3/2 → 4I15/2, and 4F9/2 → 4I15/2 transitions, respectively.[Reference Dieke23,Reference Peijzela, Meijerink, Wegh, Reid and Burdick24] When plotted on logarithmic scales, the power-law dependence of the UC-PL intensity of each emission wavelength [Fig. 3(b)] scales as  $I_\omega ^{1.5}$ where I ω is the average excitation intensity. For the UC-PL emission, the sequential absorption of n photons can lead to different values of the exponent according to the competition between the linear decay up-conversion processes.[Reference Pollnau, Gamelin, Lüthi, Güdel and Hehlen25] The value here obtained at n = 1.5 is typical of the up-conversion processes in co-doped Yb3+,Er3+ systems under such excitation intensities.[Reference Peijzela, Meijerink, Wegh, Reid and Burdick24,Reference Suyver, Aebischer, García-Revilla, Gerner and Güdel26]
(a) Emission spectra of α-La0.88Yb0.1Er0.02(IO3)3 nanocrystal dispersions in ethylene glycol under a 800-nm excitation (red curve) and a 980-nm excitation (dark red curve). For sake of clarity, the spectra have been stacked. The arrows point out the SHG signals, whereas the up-conversion emission is evidenced at 525, 550, and 660 nm. * is discussed in the text. (b) Power-law dependence of the UC-PL intensity at 525, 550, and 660 nm, in logarithmic scale under a 980-nm excitation. Data correspond to the symbols and dashed lines to the linear fit giving a slope of n = 1.5.

In terms of relative intensities between the SHS and UC-PL signals and after a proper calibration of the wavelength-dependent response of the experimental set-up,[Reference Riporto, Urbain, Mugnier, Multian, Riporto, Bredillet, Beauquis, Galez, Monnier, Chevolot, Gayvoronsky, Bonacina and Le Dantec21] the signals at 400, 525, and 550 nm are very similar under an excitation wavelength set at 800 nm and whatever the Er content (x = 0.005, 0.01, and 0.02). However, when the resonant excitation is shifted to 980 nm, a much more efficient UC process can be noticed comparatively to the almost constant SHS signal. Note that the overall spectral dependence of the SHS and UC-PL signals according to the excitation wavelength is further studied in the following section.
Spectral response of the SHS and UC-PL signals under resonant conditions
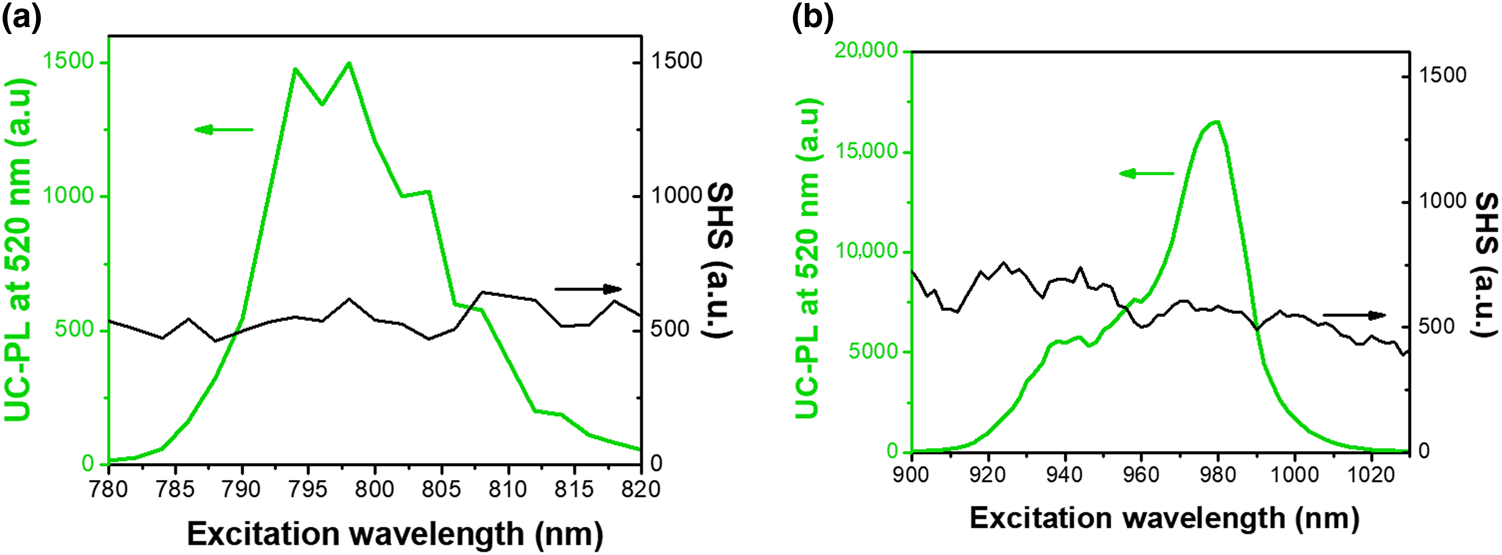
To understand better the evolution of SHS and UC-PL emissions with the excitation wavelength, the emission spectra of the α-La0.88Yb0.1Er0.02(IO3)3 nanocrystals dispersed in ethylene glycol were recorded by scanning both in the 780–820 and 900–1020 nm ranges. After fitting of each characteristic peak with Gaussian functions, the UC-PL at 550 nm and SHS intensities are reported in Fig. 4. For both excitation ranges, the SHS signal appears rather constant with the excitation wavelength (Fig. 4, black curves). On the contrary, the UC-PL signal strongly depends on the excitation wavelength (Fig. 4, green curves). Such evolution of the UC-PL signal is directly correlated to the real absorption levels of Er3+ and Yb3+ whereas SHS only involves virtual states. In Fig. 4(a), the green curve corresponds to the typical absorption of Er3+ around 800 nm, namely to the 4I15/2 → 4I9/2 electronic transition.[Reference Blasse and Grabmaier27] In Fig. 4(b), the green curve is well correlated to the 2F7/2 → 2F5/2 transition of the Yb3+ excitation spectrum. Note also that the absorption cross-section of Er3+ around 980 nm is 10 times smaller than that of Yb3+ and thus Er3+ ions do not contribute to the excitation spectrum.[Reference Huang, Liu, Ma, Kang, Hu and Chena28] Hence, according to the excitation wavelength, two UC-PL mechanisms can be suggested:
• For an excitation at 980 nm, the UC-PL process first involves Yb3+ ions. After absorption of the incident photons to the 2F5/2 excited state, energy is transferred to the neighboring Er3+ ions in their vicinity. Because of the long lifetime of the 4I11/2 level of Er3+, further energy transfer from Yb3+ is repeated (before de-excitation of Er3+) thus allowing the population of higher excited states. A two-photon process thus results in the Er3+ PL emission at 525 and 550 nm from the 2H11/2 and 4S3/2 levels, respectively. In addition, a three-photon process from the 2H9/2 is also observed as evidenced in Fig. 3(a) by the weak emission at ~400 nm.
• For an excitation at 800 nm, the UC-PL process occurs exclusively through the Er3+ ions, as Yb3+ shows no absorption in this range. Er3+ ions are first excited to the 4I9/2 level before the absorption of a second photon populating higher excited states of Er3+ and leading to a PL emission from the 2H11/2 and 4S3/2 levels.
Spectral response of the emission intensity of the UC-PL at 550 nm (green curves) and SHG signals (black curves) in the 780–820 nm (a) and 900–1030 nm (b) ranges for α-La0.88Yb0.1Er0.02(IO3)3 nanocrystals dispersed in ethylene glycol. These spectra were recorded for a peak intensity of 1 GW/cm. Note that for the sake of comparison of SHS and UC-PL intensity, both y-axis scales were kept identical in graph (a). On graph (b), as the UC-PL intensity is much more intense than SHS, the y-axis scales were chosen differently. It is possible to compare the absolute intensity values of the two graphs (a) and (b) as a thorough calibration of the set-up has been performed as the function of the excitation wavelength.[Reference Riporto, Urbain, Mugnier, Multian, Riporto, Bredillet, Beauquis, Galez, Monnier, Chevolot, Gayvoronsky, Bonacina and Le Dantec21]

The highest conversion efficiency of the UC-PL process, illustrated in Fig. 3(a) for an excitation wavelength at 980 nm, is thus consistent with the absorption cross-section of Yb3+ which is known to be much larger than that of Er3+ at 800 nm.[Reference Dong, Sun and Yan29] Similarly, when Yb3+ is used as a sensitizer, a three-photon process with an emission at ~400 nm is only detectable when pumping at 980 nm.
Regarding the SHG conversion efficiency, the SHS signal is measured constant within the experimental uncertainties (evaluated at 15%[Reference Riporto, Urbain, Mugnier, Multian, Riporto, Bredillet, Beauquis, Galez, Monnier, Chevolot, Gayvoronsky, Bonacina and Le Dantec21]) (Fig. 4) while scanning in both excitation ranges (780–820 and 900–1020 nm). Hence, the SHG signal is not modulated in both excitation ranges, on the contrary to the UC-PL process which is strongly dependent on the excitation wavelength. Under such resonant excitation conditions for the Er3+ and Yb3+ ions, the absence of interplay between the SHS and UC-PL processes can be clearly noticed, indicating that the real transition levels of the lanthanide ions are not involved in the SHS emission. The absence of interplay here observed for the UC-PL and SHG processes might be attributed to the intrinsic properties of lanthanum iodate compounds themselves. Indeed, the SHG efficiency in iodate materials is mainly attributed to the stereoactive lone-pair of I5+,[Reference Chang, Kim, Halasyamani and Ok30,Reference Sun, Hua and Mao31] whereas the PL comes from the lanthanide ions, substituting La3+ as evidenced by the PXRD results. Such a behavior would deserve further comparison with other non-centrosymmetric structures like LiNbO3 for which co-doping with Er3+ and Yb3+ ions has already been achieved.
Conclusions
Microwave-assisted hydrothermal reaction allows to successfully produce α-La0.9−xYb0.1Erx(IO3)3 nanocrystals with x = 0.005, 0.01, and 0.02. Under NIR resonant excitations at around 800 and 980 nm, corresponding to the Er3+ and Yb3+ excited levels, a simultaneous emission of UC-PL and SHS signals can be observed. Very notably, Yb3+ acts as a strong sensitizer for the UC-PL at 980 nm and no competition between the two processes (UC-PL and SHS) could be evidenced in the co-doped lanthanide iodate nanocrystals.
Supplementary material
The supplementary material for this article can be found at https://doi.org/10.1557/mrc.2019.137.
Acknowledgments
The authors thank the French-Swiss Interreg V and French ANR programs for financial supports (Projects OncoNanoscreen and Racine) and the 2015−2020 French Contrat Plan État Région (project E-TIME, SYMME).