INTRODUCTION
Increasing conflicts regarding the allocation of water resources for irrigation has introduced a new level of significance to the issue of water use efficiency (IRRI (International Rice Research Institute), 2009). Water scarcity for irrigated crops, particularly rice, is increasing due to persistent dry spells that result into drying out of various water sources and the high demand for irrigation of various crops. In Malawi, rice is the second most important cereal crop after maize, including where it is used as a coping mechanism in rural homes at the instance of unseasonal maize shortfalls. About 15% of the country's rice supply comes from only a little over 2% of arable land under irrigation and contributes to a total production of 120,000 tonnes (Aune et al., Reference Aune, Sekhar, Esser and Tesfai2014). Malawi has an irrigation potential of about 162,000 hectare, which is about 7% of arable land. Given that current production does not meet market demand, there is potential to increase both production and productivity of the crop. Farmers flood their rice fields continuously from transplanting to 7–10 days before harvesting (Malawi Government, 2003). Because of this watering regime, the demand for water becomes high with upstream farmers usurping all water to the chagrin of downstream users. The situation worsens when the rainy season experienced dry spells that affect water tables and water levels in rivers.
Indeed, Brown and Turner (Reference Brown and Turner1978) reported that 48% (570 mm) of the applied irrigation water (1180 mm) to rice is consumed through evapotranspiration (ETo), while the remainder is lost through runoff and infiltration. Under current production methods, irrigated rice requires more water than any other major crop, commonly 3000–5000 litres of water per kg of rice produced (Uphoff et al., Reference Uphoff, Kassam and Thakur2013). Buresh and Haefele (Reference Buresh and Haefele2010) suggested that rice will be increasingly produced within political and economic environments of less supply of irrigation water and more income opportunities from alternative crops. This will necessitate changes in water management, rice cultivation practices and cropping patterns that include reduced soil submergence.
Current irrigation trends have thus recognized water saving irrigation technologies, such as direct dry seeding, land levelling and alternate wetting and drying (also called controlled irrigation or deficit irrigation) (IRRI, 2009; Lantican et al., Reference Lantican, Lampayan, Bhuiyan and Yadav1999). System Rice Intensification (SRI) further advances the tenets of controlled irrigation to include specific soil and agronomic management practices (Thakur et al., Reference Thakur, Uphoff and Antony2010). These practices are, but not limited to, use of single young seedlings, drastically lowered plant densities, keeping fields unflooded and use of mechanical weeders that aerate the soil, all with the aim of providing optimal growth conditions for the plant, to get better performance in terms of yield and input productivity.
In a review of 31 published experiments on various forms of AWD, Bouman and Tuong (Reference Bouman and Tuong2001) found that 92% of the AWD treatments resulted in yield reductions ranging from zero to 70%, relative to the flooded control plots. The research findings were attributed to a wide range in severity of AWD treatments with varying but often severe impact on crop growth and yields. Nonetheless, water saving irrigation increased water productivity. Yan et al. (Reference Yan, Yu, Tao, Vos, Bouman, Xie and Meinke2010) reported results for four direct-seeded rice varieties in China that showed comparable yields in non-flooded soil, which ranged from 3.6 to 4.7 t ha−1, with yields in flooded soil that ranged from 3.6 to 5.1 t ha−1. The results also indicated significant varietal effect on biomass, yield, panicle number, spikelet number, grain weight and grain filling percentage in both soils.
Traditional weed control methods in rice have included land preparation (soil puddling), water management, manual weeding or chemical weed control (Labrada, Reference Labrada2003). In Malawi, a minimum ponded depth of 5 cm has further been used as the standing recommendation for weed control (Malawi Government, 2003). There appears equivocal evidence whether deficit irrigation results in the diminution of the weed problem (Buresh and Haefele, Reference Buresh and Haefele2010; Labrada, Reference Labrada2003). The emergence of intractable weed complexes from temporal intensification practices, such as double cropping and known weed complexes in aerobic rice culture need to be re-examined in the implementation of deficit irrigation.
Although controlled irrigation has been effectively used elsewhere (Bouman and Tuong, Reference Bouman and Tuong2001), it has not been extended to other farmers in water scarce areas of Southern Africa. Further, it is argued that the reasons for higher yield with AWD irrigation or SRI under variable agronomic management need to be understood to inform practice and policy on the cultivation of rice under water saving systems (Aune et al., Reference Aune, Sekhar, Esser and Tesfai2014; Dass and Chandra, Reference Dass and Chandra2013). The objective of this study was to assess deficit irrigation practices with systematic comparison to conventional continuous flooding management practices under small-scale farmers’ field conditions. Deficit irrigation practices comprised regulated deficit irrigation, treatments that reduced irrigation in certain developmental stages, and sustained deficit irrigation, where the irrigation reduction was constant throughout the season.
MATERIALS AND METHODS
Site description
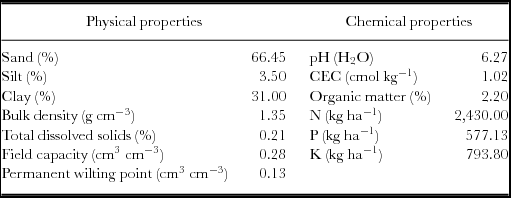
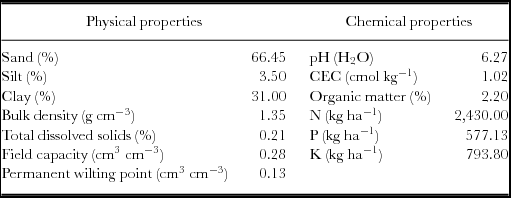
The experiment was carried out at Domasi Irrigation Scheme in Machinga District located in Southern Malawi (Lat. 15°21ʹ S; Long. 35°30ʹ E; elevation of 650 m) during the dry season from June to November 2011. The irrigation scheme, with an area of 475 hectare, was designed for smallholder rice cultivation and is gravity-fed using water diverted from the Domasi river. As of 2010, the scheme had 4000 farmers with an average land holding size of 0.12 hectare. The area receives average annual rainfall of 952 mm between November and March (Venema, Reference Venema1991). There was no rainfall during the conduct of this experiment. Maximum mean monthly air temperatures during the growing period (June–November) ranged from 23.0 to 29.9 °C, while the minimum temperature ranged from 11.9 to 19.0 °C. The soil of experimental site was a sandy clay loam (mesic). Soil samples were taken at 0–15- and 15–30-cm depths for laboratory analysis. Physical and chemical properties of soil are shown in Table 1.
Physico-chemical properties of the soil used in the field trial.
Rice genotypes evaluated
Two rice varieties, NERICA 4 and Nunkile, were used in the experiment. NERICA 4 is a variety developed by West African Rice Development Association (WARDA). It yields up to 5.0 t ha−1 under rainfed conditions (summer) and 4.5 t ha−1 under dry season (winter) irrigation. It takes 100–110 days to mature during summer and 130 days during winter. It is recommended mainly for upland agro-ecological conditions (Sasakawa Global 2000, 2009). Nunkile is a variety developed by the Department of Agricultural Research Services in Malawi and released in 1997 (Malawi Government, 2003). It yields up to 6.0 t ha−1 during summer and 5.4 t ha−1 during winter, has strong aroma, and takes 112 days to mature during summer and 141 days during winter. It is recommended for lowland irrigated agro-ecological conditions. The two varieties were chosen because of their related duration to maturity, and both are photoperiod insensitive. They are thus grown under rainfed and irrigated conditions. The varieties are already being grown by farmers, and therefore would easily be promoted under water deficit irrigation once their performance is established.
Treatments, experimental design and crop management
The experiment was established using five replications in a split block design (O’Neill and Lee, Reference O’Neill and Lee2009) with irrigation method as main plots (blocks) and varieties as subplots. Main plots comprised four irrigation regimes: (1) continuous flooding with surface water level kept at approximately 5 cm throughout the crop duration (CFI); (2) alternate wetting and drying up to start of flowering, after which continuous flooding was applied (AWD1); (3) alternate wetting and drying up to start of grain filling, after which continuous flooding was applied (AWD2); and (4) alternate wetting and drying throughout the crop duration (AWD3). CFI represented the current recommended management practice for rice cultivation in Malawi; AWD1 and AWD2 represented regulated deficit irrigation, a treatment that reduces irrigation in certain developmental stages; and AWD3 represented sustained deficit irrigation, where the irrigation reduction is constant throughout the season. Subplots comprised two rice varieties: NERICA 4 and Nunkile. The experiment comprised 40 subplots of size 70 m2 each. Subplots were enclosed by 50-cm bunds with 1.5-m distance between them.
Seedlings were produced using the wet-bed nursery method seeded at the rate of 75 kg ha−1. Transplanting of seedlings was done 21 days after emergence with three seedlings per station at between- and within-row spacing of 23 cm and 15 cm respectively. At transplanting, all the irrigation treatments were flooded to a depth of 5 cm above the soil surface to establish the seedlings. The crop received 80.5-kg N, 21-kg P2O5, 0-kg K2O and 4-kg S ha−1 through basal dressing a compound fertiliser 23:21:0+4S at 100 kg ha−1 together with urea (46:0:0) at 25 kg ha−1. A further top dressing of urea fertiliser was applied 25 days after transplanting at 100 kg ha−1.
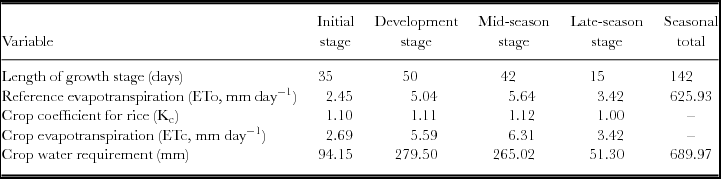
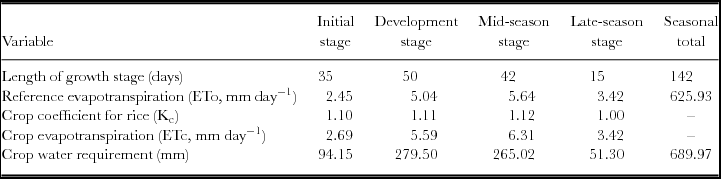
The amount of water applied during each irrigation event and frequency was established by computing evaporative demand of atmosphere in the study area and water requirements of the rice crop (FAO (Food and Agriculture Organization), 2009). Reference potential crop evapotranspiration (ETc) values for each month from July through November, determined based on the FAO Penman–Montheith method (Allen et al., Reference Allen, Pereira, Raes and Smith1998), were: 1.81, 2.49, 3.69, 4.22 and 3.42 mm day−1 respectively. These values were converted to potential ETc by multiplying with crop coefficient (Kc). Crop water requirement at different growth stages was calculated using ETc and total number of days at each growth stage. Total irrigation water required for the growing season was obtained by the summation of water requirements of the four growth stages multiplied by block area. This water volume was taken as a guide such that it was considered the minimum amount of water that would be applied to the crop during the season without stressing it.
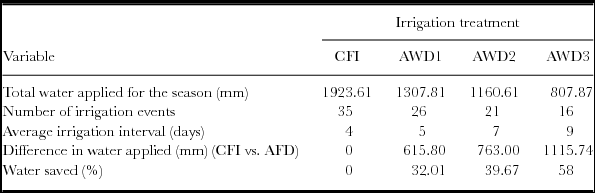
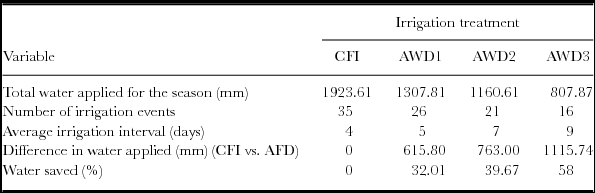
In terms of irrigation scheduling, water depth in the CFI plots was maintained at 5 cm above the soil surface (Malawi Government, 2003). Thus, the plots were irrigated whenever the water level dropped below 5 cm. The alternate wetting and drying treatments, AWD1, AWD2 and AWD3 blocks were flooded to 5-cm depth above the soil surface whenever soil moisture level was at or close to 20% of field capacity (management allowable depletion for rice) (Enciso et al., Reference Enciso, Porter and Peries2007). Eijkelkamp gypsum electrical resistance blocks and gravimetric methods were used to determine soil moisture. Pairs of gypsum blocks were placed at two different stations, 3 m away from each at 10- and 20-cm depth increments within the active root zones for rice (Evans, Reference Evans1996). Water levels were controlled in such a way that the depths of flow were kept constant during irrigation using calibrated Washington State University Calibrations (WSC) trapezoidal flumes (Herbert, Reference Herbert1965). Water depth in the blocks was further monitored using two field water tubes placed at both ends of the block (Enciso et al., Reference Enciso, Porter and Peries2007; Evans, Reference Evans1996). Total amount of water per irrigation event was obtained by multiplying flow rate by total irrigation time. The number of irrigation events, volume of water and depth per irrigation event were recorded for all irrigation treatments. Irrigation applications are summarised in Table 3. Data were not crop response variables, and thus were not analysed statistically.
The study employed consumptive use, or evapotranspiration (ETo) of water as a parameter in crop yield–water use. Crop water productivity (CWP; kg m−3) was defined in terms of crop grain yield and seasonal evapotranspiration, and disaggregated in the following components:
 \begin{equation*}
{\rm CWP} = {\rm C}\; \times \;\left[ {{\rm Y}/{\rm ETc}_{{\rm act}} } \right]\!,
\end{equation*}
where CWP is the crop water productivity (kg m−3), Y is the actual yield (kg ha−1), ETcact is the actual crop evapotranspiration (mm) and C is the conversion factor, 0.10 (ha mm−1 m−3) (Molden, Reference Molden1997).
Weed occurrence was recorded at vegetative, booting, flowering and physiological maturity stages from five plots each of 1 m2 randomly demarcated in all the irrigation treatments. Other data collected included crop developmental stages and growth characteristics. At harvest maturity, paddy and straw were separately sun-dried followed by weighing to determine production of each net plot. Samples of the paddy were oven-dried at 65 °C for 48–72 hours to determine dry matter yield and yield components corrected to 14% moisture content.
Data analysis
Data were analysed using the analysis of variance technique as applicable to a split block design (O’Neill and Lee, Reference O’Neill and Lee2009). The statistical packages used were General Statistics (Genstat) 14.0 and Statistical Package for Social Sciences (SPSS) 16.0. The significance of difference among treatments was tested using F-test. The Least Significant Difference (LSD) test at the level of 5% probability was used to compare differences among treatment means (Steel et al., Reference Steel, Torrie and Dicky1997). Different trends in crop growth and yield response to water saving irrigation regimes may be due to different water events in different irrigation regimes. Therefore, linear regression relationships between growth and yield variables with seasonal water use were determined for the two varieties. Slope of linear regression was considered a measure of sensitivity of variety to water amounts applied.
RESULTS
Irrigation water applications
Reference potential ETc determined during the growing period based on the FAO Penman–Montheith method was 626 mm (Table 2). The product of ETc and total number of days at each growth stage provided the seasonal crop water requirement of 690 mm. This means that if proper scheduling was done with appropriate irrigation depths during irrigation events, more water could be saved, especially where irrigation water is applied in excess of crop water requirements for the rice crop at this location. In fact, irrigation treatments AWD1, AWD2 and AWD3 with seasonal water applied equivalent to 1307.81, 1160.61 and 807.87 mm, respectively, saved 32, 40 and 58% more water when compared with CFI treatment that received 1923.61 mm of irrigation water for a growing period of 140 days (Table 3).
Determination of crop water requirement at different growth stages.
Average values of water supply for different irrigation treatments.
Phenological and growth characteristics
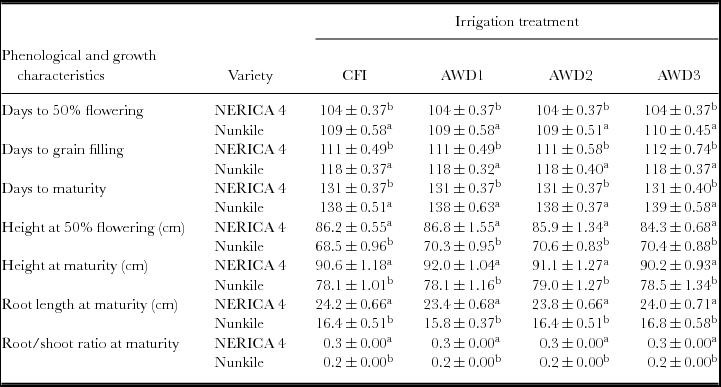
Irrigation treatments did not cause significant (p ≤ 0.05) variation in phenological and growth characteristics in both varieties (Table 4). Nunkile reached various phenological stages earlier than NERICA 4. The latter had superior shoot and root growth characteristics than the former. The linear relationships between phenological and growth characteristics with seasonal water applied for the two varieties were not statistically significant (data not shown).
Mean comparison of phenological and growth characteristics for the two varieties and irrigation treatments.
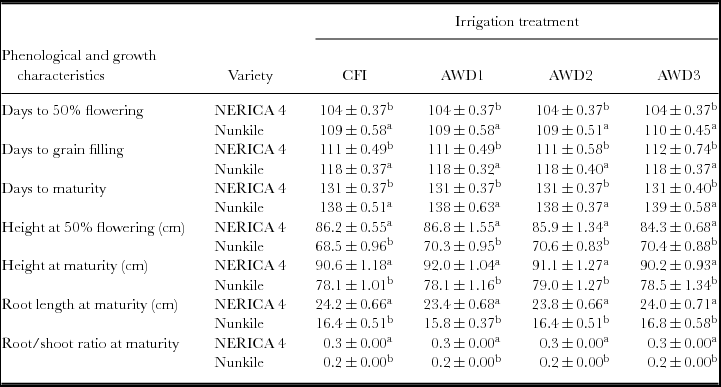
Note: Pair of mean values (between varieties) with different superscripts for each characteristic and irrigation treatment is significantly different (p ≤ 0.05).
Yield and yield components
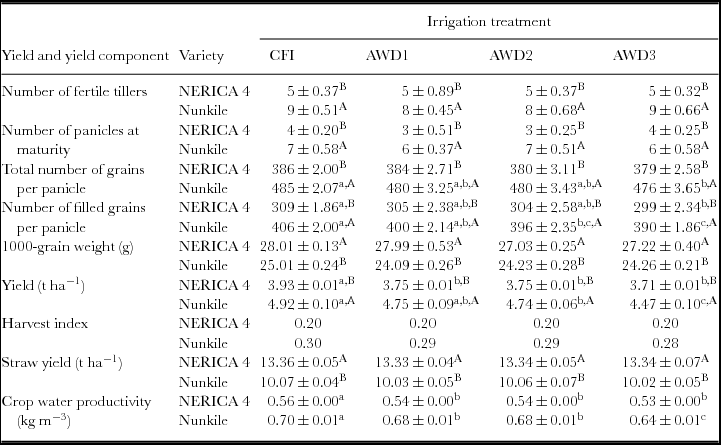
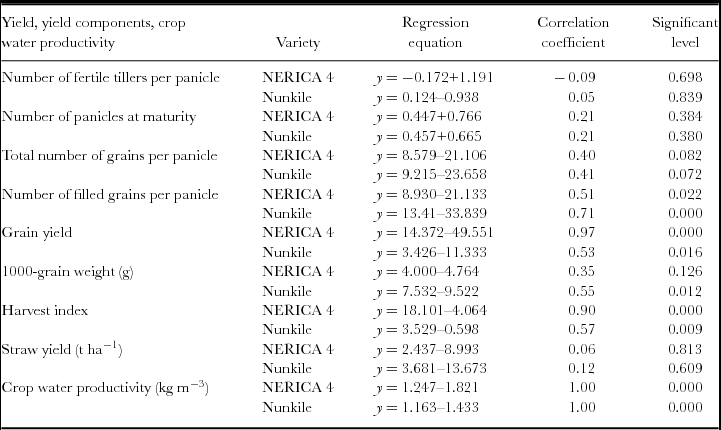
There were no significant differences in the number per plant of either tillers or panicles across irrigation treatments for either variety (Table 5). However, Nunkile subtended almost twice the number of tillers and panicles compared with NERICA 4. The results indicated no significant differences on total number of grains per panicle across irrigation regimes for NERICA 4, while there were significant differences between CFI and AWD3 for Nunkile. The latter variety further exhibited higher total number of grains per panicle and filled grains per panicle than the former. Irrigation treatments significantly influenced the number of filled grains per panicle, although there were overlaps between treatments with the least return on filled grains subtended by AWD3 regime in both varieties. Linear relationship between the number of fertile tillers per panicle and the number of panicles at maturity with seasonal water applied was not statistically significant for either variety (Table 6). However, slope of linear regression was significantly lower for NERICA 4 for number of filled grains per panicle. Therefore, this trait was less affected by water saving irrigation regimes for NERICA 4.
Mean comparison of yield and yield components for the two varieties and irrigation treatments.
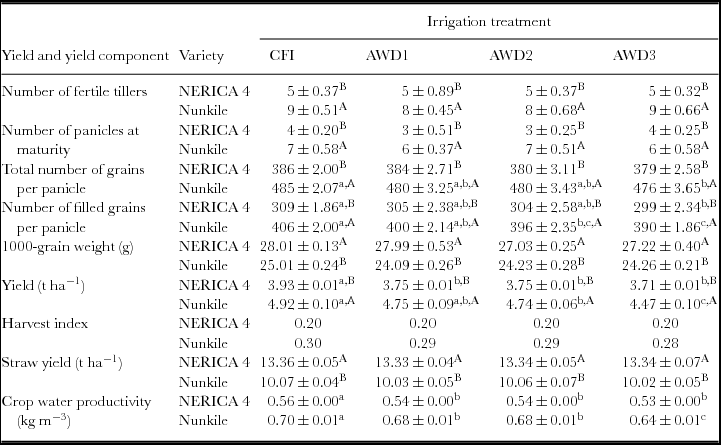
Note: Mean values with different superscripts (lower case) within the same row (variety) for each variable are significantly different (p ≤ 0.05). Pair of mean values (between varieties) with different superscripts (upper case) for each column (irrigation regime) is significantly different. Mean values within the same row (variety) or pair of means (between varieties) for each variable with no superscripts (lower or upper case) are not significantly different.
Linear relationships between seasonal water use (y) and yield variables for the two varieties.

There were no significant differences in 1000-grain weights across the four irrigation treatments for either variety (Table 5). However, significant differences for 1000-grain weight were observed between the two varieties with NERICA 4 having higher values than Nunkile. Under the four irrigation treatments, NERICA 4 produced the highest grain yield at 3.93 t ha−1 with CFI. Yields were not significantly different among the rest of the treatments with AWD3 giving the lowest yield at 3.71 t ha−1. Similarly, for Nunkile, the AWD3 irrigation treatment gave the lowest yield at 4.47 t ha−1, while CFI treatment yielded the highest at 4.92 t ha−1. There were no significant differences in yield between CFI and AWD1 and between AWD1 and AWD2, but grain yield differed between CFI and AWD2. Grain yield of NERICA 4 under CFI, AWD1, AWD2 and AWD3 was shy by 12, 16, 16 and 17%, respectively, compared with multi-site and multi-year irrigated yield potential of 4.5 t ha−1. In the same order, the yield gap for Nunkile was 8, 12, 12 and 17% respectively against a potential of 5.4 t ha−1.
Irrigation treatments and varieties did not significantly influence harvest index or straw yield. With the exception of straw yield, linear relationships between grain yield, 1000-grain weight and harvest index with seasonal water applied were significant for either variety (Table 6). Nunkile showed less sensitivity to irrigation treatments for these traits compared with NERICA 4 on account of lower slopes of linear regression.
Water productivity
Mean CWP values for NERICA 4 were tightly grouped and ranged from 0.53 kg m−3 for AWD3 treatment to a high of 0.56 kg m−3 for the CFI treatment with the remaining treatments at 0.54 kg m−3 respectively (Table 5). CWP under CFI was significantly greater compared with all AWD treatments. The CWP values for Nunkile ranged from 0.64–0.70 kg m−3 for the four irrigation treatments and thus were higher compared with NERICA 4. Similar to NERICA 4, CWP for Nunkile under CFI was significantly greater compared with all AWD treatments. AWD1 and AWD2 treatments showed similar intermediate values that were significantly greater than the AWD3 treatment. Again, Nunkile showed less sensitivity to irrigation treatments for CWP compared with NERICA 4, based on lower slope of linear regression (Table 6).
Weed occurrence
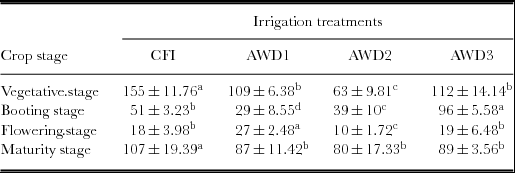
The highest number of weeds per unit area was recorded under CFI treatment compared with other irrigation treatments at vegetative and maturity crop stages (Table 7). Weed incidence was also significantly higher for the AWD3 treatment at booting stage and came second at flowering and maturity stages. The CFI and AWD3 irrigation treatments subtended higher weed incidence compared with the other irrigation treatments.
Mean comparison of number of weeds (m−2) at vegetative, booting, flowering and maturity stages for different irrigation treatments.
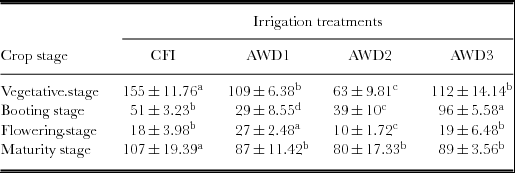
Note: Means with different superscripts within the same row are significantly different (p ≤ 0.05).
Dominant weed species were Cynodon dactylon L., Eleusine indica L. and Euphobia hirta L. in AWD3 treatment, less in AWD1 and AWD2 and sparse in CFI treatment. Commelina benghalensis L., Cyperus rotundus L., Echinochloa crus-galli, Scirpus mucronatus and Cyperus difformis were dominant in CFI and AWD3, with the former irrigation treatment subtending a higher intensity of the weed species. Algae were always present in CFI treatment, while in deficit irrigation treatments, the plants appeared following flooding and died out once surface water receded.
DISCUSSION
Phenological and growth characteristics
There was lack of significant influence of irrigation treatments on phenological development and growth characteristics such as plant height, root length and root to shoot ratio. It is probable that plant dry mass determinations could have added value to the results. For instance, Fageria et al. (Reference Fageria, Moreira and Coelho2011) observed that in modern rice varieties, the contribution of roots, shoots and grain to the total plant weight is 10, 48 and 42% respectively. Nevertheless, the short stature presently preferred for rice varieties is related to lodging resistance (Yoshida, Reference Yoshida1972), which may be altered with change in plant density under SRI (Thakur et al., Reference Thakur, Uphoff and Antony2010) or soil fertility amendments (Fageria et al., Reference Fageria, Moreira and Coelho2011). NERICA 4 had lower number of days to flowering, grain filling and maturity, higher root length at maturity, greater plant height at flowering and maturity, and higher straw yield than Nunkile.. On the other hand, Nunkile had more tillers and panicles per plant than NERICA 4. The differences between the two rice varieties for days to developmental stages and root and shoot features could be due to variation in the genetic potential make-up of these varieties. Several plant features have been altered under controlled irrigation and SRI. Thakur et al. (Reference Thakur, Uphoff and Antony2010) reported changes in leaf size, canopy architecture, root length and distribution and length of panicles. Dass and Chandra (Reference Dass and Chandra2013) found enhanced dry matter accumulation in stems, leaves and grain under SRI. But they attributed differences in duration taken to panicle initiation, flowering and maturity to genetic variations for these traits in the varieties used. The number of days to developmental stages remains equivocal with claims of water-stressed rice plants taking the longest time to attain 50% flowering and maturity, while other works showed shorter duration under SRI compared with traditional flooding (Dass and Chandra, Reference Dass and Chandra2013). It appears critical to understand potential confounding effects of water stress and prevailing temperature regime under deficit irrigations.
Grain yield and yield components
Grain yield is a function of cumulative behaviours of yield components, while the physiological efficiency of a crop to convert dry matter into economic yield is determined by the harvest index (Yoshida, Reference Yoshida1972). The response of yield components to irrigation treatments was not adequately distinguished using analysis of variance in our study. Relationship between grain yield and yield components to irrigation treatments was further determined by regression analysis, which showed that the total number of grains per panicle (p ≤ 0.1), number of filled grains per panicle and harvest index have potential to predict grain yield under variable water management. The 1000-grain weight only had significant effect on grain yield for Nunkile. Chawdhury et al. (Reference Chowdhury, Kumar, Sattar and Brahmachari2014) also observed that the 1000-grain weight did not change with irrigation levels under SRI. The potential size of rice grain is reported to be physically restricted by the size of hull; accordingly, grain weight is considered a stable varietal character (Yoshida, Reference Yoshida1972).
The lack of response of the harvest index to irrigation treatment corroborates the result of Chawdhury et al. (Reference Chowdhury, Kumar, Sattar and Brahmachari2014), who reported that irrigation levels did not significantly influence grain to straw ratio and harvest index. However, Zhao et al. (Reference Zhao, Wu, Li, Lu, Zhu and Uphoff2009) reported increased harvest index under SRI compared with traditional flooding, while Thakur et al. (Reference Thakur, Uphoff and Antony2010) found more grain per panicle and higher percentage of grain filling under SRI. Abbasi and Sepaskhah (Reference Abbasi and Sepaskhah2011) included unfilled grain percentage together with harvest index as the most suitable traits for selection of rice varieties with high yield potential under water saving irrigations. It is noted however that unlike in our study, plant densities under SRI are reduced, which may lead to compensatory phenotypic alterations and enhance per plant productivity (Thakur et al., Reference Thakur, Uphoff and Antony2010). Dass and Chandra (Reference Dass and Chandra2013) concluded that water saving irrigation regimes may necessitate changes in genotypes and crop geometry that contribute to yield forming processes and yield.
Water use and yield
Crop water use was reflected by determining CWP for respective irrigation treatments. CWP was higher for Nunkile compared with NERICA 4 across all irrigation treatments and significantly greater for CFI compared with all AWD treatments grown with either variety. Although a certain reduction in yield is observed under deficit irrigation, it is suggested that the practice generally maximizes the productivity of water (Geerts and Raes, Reference Geerts and Raes2009). Zhao et al. (Reference Zhao, Wu, Li, Lu, Zhu and Uphoff2009) reported 21–22% average yield increase under SRI with 40–47% reduction in irrigation water in China. Dass and Chandra (Reference Dass and Chandra2013), working in India, recorded improved grain yield by 16.9% and increase in water productivity by 18.5% over traditional flooding. In our study, while CWP for NERICA 4 was within and/or slightly above a threshold of 0.39 to 0.53 kg m−3, projected as the average water productivity increases in 1995–2025 in developing countries (Cia and Rosegrant, Reference Cia, Rosegrant, Kijne, Barker and Molden2003), Nunkile exceeded the suggested threshold. Nunkile would be the probable variety to grow as it exemplifies a variety able to tolerate some deficit irrigations and stress, but with good water productivity.
Irrigation treatments AWD1 and AWD2 saved water without too much compromise on yield levels. The two irrigation treatments would be the probable choices for water deficit irrigation in the area of study owing to overall less than 5% yield reductions compared with CFI treatment. These results confirm the application of the practice of ‘safe’ AWD irrigation applied when water depths fall below a threshold (Bouman et al., Reference Bouman, Lampayan and Tuong2007) as adopted in this study. However, a choice of AWD2 would be more plausible as it saved 40% water compared with CFI treatment. Application of AWD2 means that 763 mm extra water used under CFI would be saved and used to irrigate approximately 0.7 hectare that can produce 3.13 tonnes of Nunkile or 2.46 tonnes of NERICA 4 rice respectively. Thus, in spite of a small reduction of 0.18 t ha−1 in yield for both Nunkile and NERICA 4, there would be a gain of 2.95 tonnes for Nunkile and 2.28 tonnes for NERICA 4 through the additional land of 0.7 hectare. This means that by practising AWD2, there would be a production gain of 60% and 50% for Nunkile and NERICA 4, respectively, over CFI. Bouman and Tuong (Reference Bouman and Tuong2001) suggested that the AWD irrigation methods may be considered not necessarily to increase yield on one land but rather to increase rice production by using the saved water on another piece of land. In the context of small-scale farmers, this would allow irrigation of downstream or contiguous parcels of land that often experience poor water allocation.
Weed control
Continuous flooding irrigation has been considered a weed management strategy in rice culture. In general, all irrigation treatments showed fewer weeds during booting and flowering whereas more weed populations were evident during vegetative and maturity stages. A developing canopy cover at crop establishment and a receding one at maturity could have allowed weeds to usurp below and above ground resources, causing their upsurge during the two crop stages. Weed density was significantly lower among the irrigation treatments in the order AWD2 < AWD1 < AWD3 < CFI. Deficit irrigation till grain maturity appeared effective at reducing weed populations. Buresh and Haefele (Reference Buresh and Haefele2010) suggested that weeds may be more serious constraints on aerated soils than on submerged soils, potentially necessitating increased pesticide use. However, in conformity with our findings, Bin (Reference Bin2008) suggested that weeds that are sensitive to hydrophytic conditions would grow well when there is no water on the surface whereas weeds that are aquatic or semi-aquatic in nature would either die or reduce in their densities under surface dry conditions. Dominant weed species were Cynodon dactylon L., Eleusine indica, L. and Euphobia hirta, L. in AWD treatments whereas Commelina benghalensis L., Echinochloa crus-galli, L., Scirpus mucronatus and Cyperus spp. were largely dominant in CFI. Similar weed species were reported by Lantican et al. (Reference Lantican, Lampayan, Bhuiyan and Yadav1999).
CONCLUSIONS
In this study, the grain yields and CWP of two rice varieties grown under alternate flooding and drying (AWD) irrigation were lower than under conventional continuous flooding irrigation. Thus, CWP was not increased with deficit irrigation. AWD irrigation applications until flowering or grain filling did not significantly differ from each other in terms of water productivity and yield. This suggests that at the location of study and under scarcity of water, rice can be grown with AWD irrigation until beginning of grain filling without significant reduction in yield. AWD irrigation until crop maturity was detrimental to rice growth and subsequent yield. The number of filled grains per panicle, 1000-grain weight and harvest index mostly controlled grain yield of the two varieties.
Nunkile performed relatively well under AWD conditions, although it is mainly recommended for lowland irrigated conditions under continuous flooding. NERICA 4 exhibited lower CWP under deficit irrigations. It will be important to determine the range of water productivity values for a number of seasons, varieties, agro-ecological areas, including within the same basin. The latter will establish whether water outflow upstreams are effectively reused among rice and non-rice crops within basins or downstream to justify deficit irrigation.
Acknowledgements
The authors greatly acknowledge the Malawi Government's Ministry of Agriculture and Food Security for providing financial assistance to conduct this study. The research team is indebted to Domasi Irrigation Scheme and its farmers for hosting the study. The authors are also grateful to the anonymous reviewers for much help in improving this manuscript. This publication is a product of research work by the first author for his Master of Science qualification at the University of Malawi.