I. INTRODUCTION
The application of Mg alloys is limited by their relatively low resistance to wear and corrosion, which deleteriously affects the reliability of Mg-based structural components used under abrasive and corrosive service conditions. Reference Kulekci1,Reference Song and Atrens2 Recently developed diffusion coatings that form a thin protective layer have been identified as a promising approach for enhancing surface durability of various Mg alloys; among these, Al is the most commonly used alloying element for diffusion coatings on Mg alloys. Reference Gray and Luan3–Reference Sun, Shi, Zhang and Lu8 Through aluminizing treatment, hard intermetallic compounds form on the surface of Mg alloys providing protection from wear and corrosion. Reference Zhang, Huang, Spencer and Shi7,Reference Zhao, Liu, Song and Atrens9–Reference Zhong, Liu, Wu, Le, Liu, He, Zhu and Hu13 Packed powder diffusion coating (PPDC) techniques using Al, Zn mixed powders as the diffusion source have been successfully applied to obtain thick intermetallic coatings on Mg alloys, with the layers being polycrystalline β-Mg17Al12 and τ-Mg32(Al, Zn)48 intermetallic compounds. Reference Hirmke, Zhang and St John4,Reference Zhang and Kelly14,Reference Hirmke, Zhang and St John15 The intermetallic layers improved the corrosion resistance of Mg alloys in NaCl solution by one to two orders of magnitude and exhibited significantly better nanomechanical properties, such as increased hardness and elastic modulus. Reference Hirmke, Zhang and St John4,Reference Zhang, Huang, Spencer and Shi7,Reference Chang, Zhang, Atrens and Huang16 Another important property of the protective coating is fracture strength, owing to its significant influence on the lifetime and the structural integrity of the coated base metal components. The fracture properties are especially difficult to measure due to the small dimensions and brittleness of the coatings. Investigations regarding the fracture properties of the β-Mg17Al12 and τ-Mg32(Al, Zn)48 intermetallic coatings are therefore lacking in the literature.
Micromachined cantilever and bridge bending are potential means to measure the fracture properties of small structures. Reference Kamiya, Hanyu, Amaki and Yanase17 In fact, these techniques have been widely used for measuring the mechanical properties of Si and thin films deposited on Si substrate. Reference Cao, Zhang and Zhang18–Reference Ericson and Schweitz20 Well-established lithography and wet etching micromachining techniques make possible the production of large numbers of miniaturized testing specimens in Si. Indentation is typically used to bend the well-characterized small structures to failure and the properties (elastic modulus, residual stress, yield strength, fracture toughness, etc.) of interest can be estimated by modeling the response of these structures. However, these techniques are not easily applicable to materials other than Si. Alternatively, focused ion beam (FIB) milling is capable of machining microscale and submicrometer-scale cantilevers for the micromechanical characterization of thin coatings. Among the first to utilize FIB-machined microcantilever bending technique to characterize the mechanical properties of thin films was McCarthy et al. Reference McCarthy, Pei, Becker and Atteridge21 In their work, Si microcantilevers were made on an ultra-thin Si disk (5 µm in thickness, prepared by mechanical grinding and polishing) by milling a deep U-shaped cavity through the thickness of the disk. An Al film was then deposited on the cantilever and the residual stress of the film was studied. Massl et al. Reference Massl, Thomma, Keckes and Pippan22,Reference Massl, Keckes and Pippan23 and Matoy et al. Reference Matoy, Detzel, Müller, Motz and Dehm24 reported procedures to machine microcantilevers in the vicinity of the specimen edge using FIB to characterize the fracture properties of thin films and film/substrate interfaces, respectively; grinding and polishing of the base material were not required prior to FIB milling. In spite of the simplicity of these cantilever machining procedures, their approaches were limited to the near-surface zone as they require milling from a perpendicular face of the base material. Di Maio and Roberts Reference Di Maio and Roberts25 reported microcantilevers produced using FIB that exhibited a symmetrical and irregular pentagon shaped cross-section. The advantage of this approach is that milling was carried out on a single face of the specimen only, and the cantilevers could thus be made at any desired location on the sample. These investigations have provided valuable insight into the study of the fracture strength of the intermetallic coatings on Mg alloys. Most notably, Di Maio's study provided a method for machining microcantilevers on β-Mg17Al12 phase, an intermediate layer found between the Mg alloy substrate and the τ-Mg32(Al, Zn)49 top layer. In this study, a new and successful methodology for fracture testing is described, which incorporates an experimental system with the finite element method to determine the fracture strength of β-Mg17Al12 and τ-Mg32(Al, Zn)49 intermetallic coatings.
II. EXPERIMENTS
A. Sample preparation
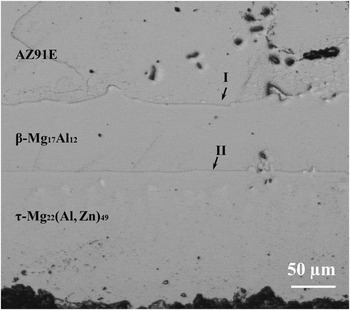
The chemical composition of the cast AZ91E Mg-alloy ingots that were used as the substrate for PPDC treatment was 8.31 wt% Al, 0.52 wt% Zn, 0.6 wt% Mn, and 90.57 wt% Mg. Specimens were cut from the AZ91E ingots with a dimension of 15 mm × 10 mm × 10 mm and were then treated at 413 °C for 18 h using PPDC techniques. The details of the PPDC process can be found elsewhere. Reference Chang, Zhang, Atrens and Huang16 After the treatment, specimens were cross-sectioned, and the sample cross-section was grounded and polished. The optical microscope image of the polished specimen is shown in Fig. 1. As shown, two layers of intermetallic coatings were formed as a result of the PPDC treatment, with τ-Mg32(Al, Zn)49 phase being the top layer and β-Mg17Al12 phase sandwiched between τ-phase and AZ91E substrate.
Optical micrograph of the alloyed layers on a cross-section of a typical PPDC-treated AZ91E Mg alloy sample; arrows I and II indicate the substrate/β-Mg17Al12 and β-Mg17Al12/τ-Mg22(Al, Zn)49 interfaces, respectively.

B. Machining of microcantilevers
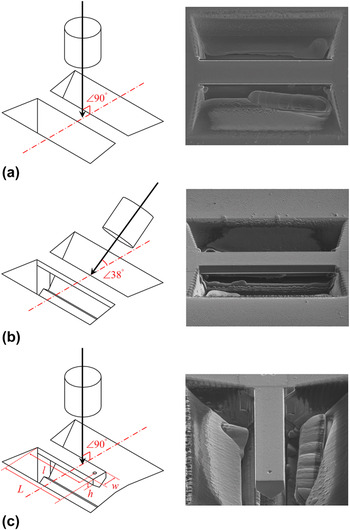
The cantilevers were machined using the Quanta 3D Dualbeam FIB workstation (FEI, Hillsboro, OR). The cantilever machining process is shown in Fig. 2. The initial shape of the cantilever was created by rough-milling two trapezoidal cavities on the surface approximately 7–10 µm deep and 3–5 µm apart, as shown in Fig. 2(a). In this process, the incident ion beam was perpendicular to the surface; the milling energy of the Ga+ beam was 30 keV, and the current was varied across a range from 5 nA (for rough milling) to 0.3 nA (for fine milling). These trapezoidal grooves were created using “cross-section milling” in a stepped fashion to create an angled side wall, so that the resultant central structure could be imaged using the ion beam from an angle of 38° to the surface. A bridge structure was then made by milling away the material beneath the central structure, with the ion beam cutting at the angle of 38° to the sample surface [Fig. 2(b)]. After one side was cut, the operation was repeated on the other side to create a symmetrical cross-section. Afterward, one end of the bridge was separated using an ion beam perpendicular to the surface [30 keV, 0.1 nA, Fig. 2(c)] to create a free-standing cantilever. As shown in Fig. 2(c), the resulting pentagonal cross-section of the cantilever is symmetrical about the vertical axis. A shallow hole (roughly 50 nm deep and 500 nm in diameter) locating along the central line of the cantilever was made to create a well-defined location for placing indentation load. After the cantilever was machined, a low energy and small current ion beam (2 keV, 0.1 nA) was used to do the final polishing to create clean side walls and remove irradiation damaged layers.
Schematic illustration of the cantilever machining sequences; images on the right hand side were taken using Ga+ ion beam showing the resultant geometries of each milling process; the cantilever shown is T-3.

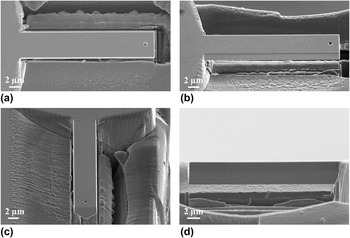
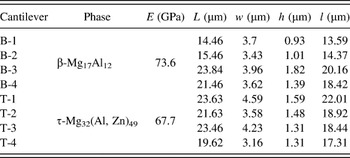
In total, eight cantilevers were machined for fracture strength characterization, with four specimens made for each layer. Note that the cantilevers were located in the central area of the coatings, away from the substrate/β-Mg17Al12 and β-Mg17Al12/τ-Mg32(Al, Zn)49 boundaries. It ensured that each cantilever was composed of only a single constituent phase and the deformation of the cantilevers was not affected by the adjacent phases and the interfaces. The cantilevers were imaged using a JEOL 7100F secondary electron microscope (SEM; JEOL Ltd., Tokyo, Japan) at different tilting angles for measuring the dimensions, as shown in Fig. 3. To ensure accurate measurement, calibration was carried out using magnification standards prior to SEM imaging. The dimensions of all eight cantilevers are summarized in Table I. In Table I, L and w represent the length and width of the cantilever, respectively, h, the height of the perpendicular side walls, and l is the distance between the loading point and the end of the cantilever (the length of the torque axis). Note that the value of h could not be measured directly as the incident electron beam could not be directed perpendicularly to the sidewall of the cantilever. Instead, the projected height h* of the sidewall was measured from the SEM image obtained with an electron beam incident angle of 60° (or 40° stage tilt), such as Fig. 3(b). The h values were then calculated using the projection rule:
 $$h = {h^ * }\;{\sin ^{ - 1}}40\quad .$$
SEM images of a typical FIB-machined cantilever: (a) 0° tilt/top view; (b) & (c) 40° tilt; (d) 90° tilt/side view; the cantilever shown is T-1.

Elastic modulus and dimensions of the cantilevers.

To prove the validity of this indirect measuring approach, two cantilevers (T1 & T2) were made at the edge of the top layer [τ-Mg32(Al, Zn)49 phase] so that the h values could also be directly measured with an electron beam perpendicular to the sidewall (equivalent to 90° stage tilt) [Fig. 3(d)]. The calculated h values were found consistent with the directly measured ones.
C. Nanoindentation
Nanoindentation tests were performed at room temperature using a TI900 Hysitron Triboindenter (Hysitron Inc., Eden Prairie, MN). A Berkovich indenter with an included angle of 142.3° and a tip radius of 100 nm was first used to measure the elastic modulus (E) of β-Mg17Al12 and τ-Mg32(Al, Zn)49 coatings using the Oliver–Pharr method. Reference Oliver and Pharr26 The values of E are shown in Table I. A conical indenter with spherical apex was then used to bend the microcantilevers. The critical loads and deflections at which the cantilevers failed were measured. The tip had an included angle of 90°; the radius of the spherical apex was 1 µm. Besides applying load, the indenter can also scan the surface using the tip in contact mode, to produce an image of the cantilever. Before the load was applied, a scan of the cantilever was performed so that the indenter tip could be accurately placed in the hole made on the center-line of the beam at a known distance from the cantilever base. The cantilever was then loaded to fracture using a loading rate of 2 nm/s. The fractured surfaces were examined using the JEOL 7100F SEM.
D. Finite element modeling
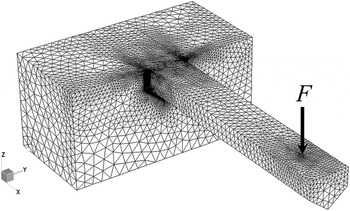
A commercial FEA code, Strand7, was used to identify the tensile failure stress in the cantilever structures. The cantilevers were modeled, as shown in Fig. 4. A substantial volume was modeled behind the cantilever to permit some end rotation; this section of the model was fully restrained on the four sides that were not connected to the cantilever. As the cantilevers consisted only single constituent phase, the material being modeled was thus considered as homogenous, i.e., containing either β-Mg17Al12 or τ-Mg32(Al, Zn)49 phase. The cantilever model was dimensioned according to measurements obtained from SEM imaging of the completed cantilever prior to testing, and meshed with TET10 elements.
Finite element model of cantilever beam with front loading.

The load was applied as a point load at a location coincident with the small depression used to locate the indenter during testing. A point load was considered sufficiently accurate in this case, as the bulk of the deformation occurs due to beam bending and not indenter penetration; the similarity between the measured and predicted deflection supports this assumption.
In the highly stressed region of the cantilever adjacent to the support, a high mesh resolution was enforced to give accurate and consistent results across cantilever cases. A mesh refinement study was conducted to demonstrate that the change in maximum stress was less than 3%.
III. RESULTS
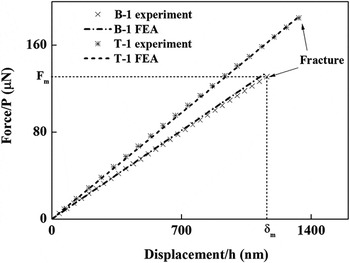
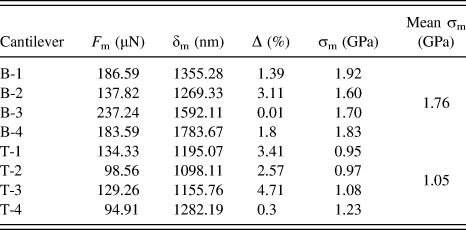
Typical nanoindentation load–displacement (P–h) curves are shown in Fig. 5. For the eight cantilevers tested, the P–h curves showed linear behavior until fracture. Once the fracture occurred, the recorded applied force dropped to zero immediately. No discontinuity was found on P–h curves prior to fracture. The critical load and displacement at the moment of fracture, F m and δm, respectively (Fig. 5), are summarized in Table II. The values of F m were then used as input parameters for finite element analysis (FEA) modeling and the calculated P–h curves were compared with the experimental P–h curves in Fig. 5. The FEA P–h curves are linear and coincide with the corresponding ones obtained experimentally. The difference between the FEA yielded δm and the δm measured experimentally was calculated and is listed in Table II. The percentage errors [Δ (%)] were in an acceptable range of 0.01–4.71%.
Comparison of the force–displacement (P–h) curve of the cantilevers obtained from the bending experiments and FEA models.

Load (F m) and deflection (δm) at fracture and the fracture strength (σm) of the cantilevers.

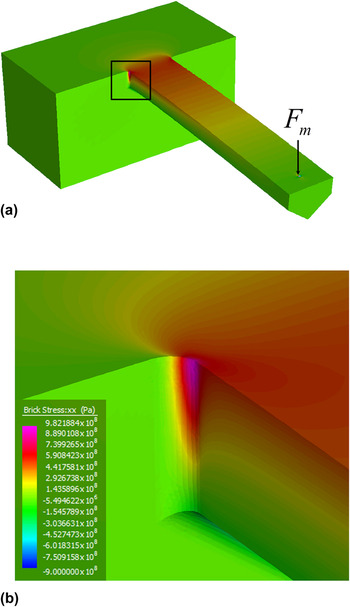
Figure 6 shows the stress contour of a cantilever at the moment when the applied load reaches the critical value F m. As shown in Fig. 6, the points of maximum stress occur in the corner radius of the cantilever. The maximum tensile stress was then used as the fracture stress (see Fig. 6) and is reported in Table II. Note that the stress values shown are the maximum values reported at the Gauss integration points; in the FE package used, the stress values are calculated at these points and extrapolated to the adjacent nodes. Due to mesh refinement, the difference between the maximum stress values at the Gauss integration points and the adjacent surface nodes was less than 2.3% in all cases. The mean fracture strengths σm determined by FEA were 1.76 and 1.05 GPa, respectively, for β-Mg17Al12 and τ-Mg32(Al, Zn)49 phases; the respective standard deviations of the mean σm are 0.14 and 0.13 GPa.
(a) Stress contours of a bent cantilever at the moment of fracture; (b) stress contours at the corner of the cantilever root; the cantilever shown is T-2.

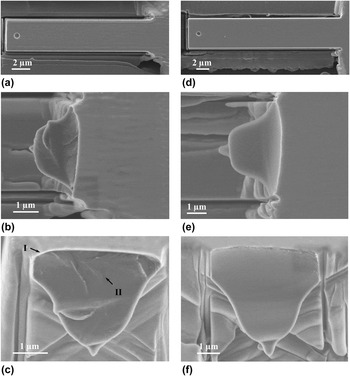
SEM was utilized to characterize the cantilevers after they failed. Figure 7 shows the SEM images of the cantilevers prior to [(a) & (d)] and after [(b) & (e)] the bending test as well as their fracture surfaces [(c) & (f)]. As shown in Figs. 7(b) and 7(c), the cantilevers failed at the root adjacent to the corner radius. The fracture surface of a typical β-phase cantilever is shown in Fig. 7(c). As shown, a small but distinguishable mirror zone was observed at the top left corner of the cross-section indicating the origin of the fracture; the mirror zone was followed by an apparent hackle zone as crack started to bifurcate along the front. For most τ-phase cantilevers, the fracture surfaces were often very smooth [see Fig. 7(f)]. It is difficult to identify the site where fracture originated in this case.
Fracture surface examination of cantilevers made of β-Mg17Al12 (a)–(c) (cantilever B-2) and τ-Mg32(Al, Zn)49 (d)–(f) phases (cantilever T-1) by SEM: (a) & (d) top view of the cantilevers prior to indentation; (b) & (e) front view of the cantilever after indentation; (c) & (f) fracture surfaces, 40° tilt; arrows I and II indicate the mirror and hackle zones, respectively.

IV. DISCUSSION
All cantilevers tested failed in a brittle fashion. When bending force was applied, the cantilevers deflected elastically until the fracture force F m was reached; the P–h curves were perfectly linear until the force suddenly dropped to zero. It is therefore valid to use a linear-elastic FEA model to describe the deflection of the cantilevers in this study. If plastic deformation occurred in the course of bending, a more complex model would be required. Immediately after fracture initiated, the detected force suddenly dropped to zero, suggesting the crack propagated very fast across the cantilever cross-section and the cantilever instantaneously separated from the base. Fracture was found to occur at the root of the cantilever, where the tensile stresses were highest. The critical force F m and displacement δm at fracture were recorded and used in the FEA simulation. The FEA result shows that the mean σm of β-Mg17Al12 is higher than that of τ-Mg32(Al, Zn)49 phase by approximately 68%.
The actual initiation of the fracture should be controlled by atomistic flaws. The strength of a brittle solid subject to an applied tensile field is determined by the most severe flaw in the surface or bulk. Reference Lawn27 In general, a smooth fracture surface suggests that the failure was initiated by a strength-reducing flaw, and a hackled fracture indicates that the precursor flaw must have been relatively small. Reference Lawn27,Reference Johansson, Schweitz, Tenerz and Tiren28 Hence, smooth fractures usually occur in cases of low fracture limits. This is in good agreement with the FEA result. Further, the elastic modulus of β-Mg17Al12 is significantly higher than that of τ-Mg32(Al, Zn)49. As higher elastic modulus implies stronger bonding in the intermetallic compounds, Reference Zhang, Huang, Spencer and Shi7 β-Mg17Al12 is more likely to have higher strength, which also agrees well with the FEA result.
Although the experimental P–h curves and the FEA calculated P–h curves are in reasonably good agreement, there are several potential sources of error needed to be discussed. The first of these is the deflection of the cantilever center downwards as relative to its edges. This occurs when a force is applied at a point on a cantilever beam with a finite width and length, both of which are much greater than the thickness of the beam. In a study by Weihs et al., Reference Weihs, Hong, Bravman and Nix19 the influence of the additional deflection due to the bending of the cantilever across its width during indentation was discussed; the cantilevers tested were considerably wide compared to their thickness. Plate theory was then used to calculate the resultant curvature across the width at the applied load. When the width to length ratio (w/l) of the cantilever was close to 1, less than 2% extra deflection was reported. This additional deflection is proportional to the cube of the w/l ratio. However, the w/l of the cantilevers tested in this study was smaller than 0.2, thus the extra deflection, if any, is considered negligible.
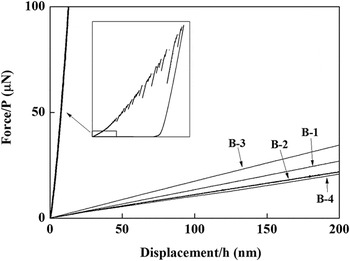
Contact induced deformation may also generate additional displacement to the P–h curve. As the P–h curve is considered to be purely the response of a beam elastic deflection in the analysis, it is necessary to determine the extent of deformation that was associated with the contact induced stress. For this purpose, indentation using the 1 µm conical indenter was conducted on both β-Mg17Al12 and τ-Mg32(Al, Zn)49 layers. The P–h curves obtained from the indentation on β-Mg17Al12 and bending tests on the cantilevers made in β-Mg17Al12 phase are compared in Fig. 8. Apparently, the contact compliance is much greater than the bending compliance of the cantilever beams. Therefore, deflection of the beam is favorable and the contact induced deformation is insignificant.
Comparison of the indentation P–h curve of a displacement-controlled indentation on β-Mg17Al12 layer and the P–h curves obtained from the cantilever bending test; the conical indenter of 1 µm radius was used in both cases.

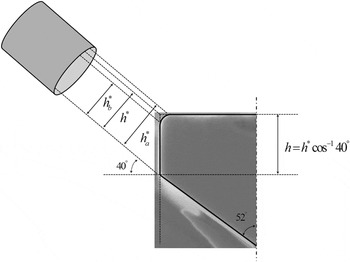
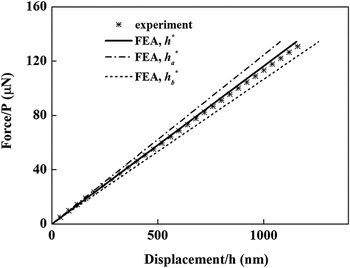
During the FIB milling process, the material removal rate is highly dependent on the incident angle. In general, with the increase of angle of incidence, sputtering yield increases markedly. Reference Prenitzer, Urbanik-Shannon, Giannuzzi, Brown, Irwin, Shofner and Stevie29 As a result, the cantilever side walls milled using FIB are inevitably rounded along the top edges, which created difficulties in the measurement of the height of the side wall, h*, at a viewing angle of 40°. As shown in Fig. 3(b), the rounded top edge is marked as a gray stripe of approximately 250 nm, likely due to the irradiation damage in the course of milling. Figure 9 schematically demonstrates how measurement error can arise due to the undesirable rounded edge. As the electron beam is oblique to the cantilever side wall, the true edge is in fact an invisible “ghost line” inside the ribbon area with h a* and h b* being the upper and lower boundary, respectively. Hence, measuring h* is not possible. As the deflection at a given force is proportional to the cube of the thickness of the cantilever beams, the force–deflection relation is very sensitive to the thickness value. Figure 10 compares the FEA P–h curves computed using h* = h a* = 1.51 µm and h* = h b* = 1.67 µm with the experimental P–h curve. The resultant percentage errors of the curves are 5.37 and 9.76%, respectively. In this study, therefore, assuming the real edge is located at the middle of the rounded ribbon area, the values of h* were estimated by
 $${h^*} = {{\left( {\mathop {{h_{\rm{a}}}}\nolimits^* + \mathop {{h_{\rm{b}}}}\nolimits^* } \right)} \mathord{\left/ {\vphantom {{\left( {\mathop {{h_{\rm{a}}}}\nolimits^* + \mathop {{h_{\rm{b}}}}\nolimits^* } \right)} 2}} \right. \kern-\nulldelimiterspace} 2}\quad .$$
Schematic illustration of the error in measuring the cantilever thickness.

Sensitivity study of beam thickness: comparing the experimental P–h curve with the FEA calculated P–h curves using h*, h a*, and h b* (cantilever T1).

The FEA result using the estimated h* is also shown in Fig. 10. Reasonably good agreement was obtained with the experimental result.
V. CONCLUDING REMARKS
A method for determining the fracture strength of β-Mg17Al12 and τ-Mg32(Al, Zn)49 intermetallic coatings on AZ91E substrate was developed in this study. The experimental techniques involved fabrication of microcantilevers using FIB milling and bending tests using nanoindentation. FEA was then used to simulate the deflection of the cantilevers and the stress at fracture σm was determined.
The bending induced fracture occurred at the root of the cantilever where the tensile stresses were highest and the computed mean σm of β-Mg17Al12 and τ-Mg32(Al, Zn)49 phases were 1.76 and 1.05 GPa, respectively. The cross-sectional fracture at the root of the cantilever resulted in a fracture surface that is readily amenable to direct post-test observation. The fracture surfaces of β-Mg17Al12 phase were found hackled while those of τ-Mg32(Al, Zn)49 phase were smooth.
The primary advantage of the proposed method is that the experimental and numerical processes are easy to implement. Cantilevers may be made anywhere within the surface of a sample; etching, specimen thinning, and milling on different faces of the sample are not required. This enables us to measure the fracture strength of subsurface structures as long as a cross-section of the specimen could be acquired. Although the modeling scheme described here is only applicable to brittle materials, by applying an elastic–plastic model that accounts for the plastic deformation, this method may also be applied to ductile materials.
ACKNOWLEDGMENT
The authors would like to thank the ARC linkage project (LP110200800) for financial support.