Chinese economic growth is not a recent phenomenon. Thomas Rawski contends that China's per capita GDP growth had already attained a similar rate to that of Japan in the first three decades of the twentieth century, a period also referred to as the Republican era. In fact, economic growth is a theme as enduring as Chinese economic history. The question raised by Joseph Needham, subsequently referred as the Needham puzzle, asked why, given her scientific, technological, and economic leadership over the rest of the world up until perhaps the fourteenth century, the Scientific Revolution and the Industrial Revolution bypassed China. More recently, a new wave of revisionist scholarship marked by Kenneth Pomeranz's book, The Great Divergence, extends this thesis with the provocative claim that levels of development and living standards in the Lower Yangzi region (historically China's most advanced area) may have still been on a par with those of Northwestern Europe as late as the eighteenth century. It was accidental factors such as the absence of coal deposits in the Lower Yangzi coupled with the natural resource windfalls from the discovery of the New World for Europe that tilted the balance afterward against China.Footnote 1
This article focuses on Chinese industrialization in the early twentieth century, which was disproportionately concentrated in the Lower Yangzi, a region situated largely within the two administrative provinces of Jiangsu and Zhejiang (hereafter abbreviated as “Jiang-Zhe”). It revisits the debate on Chinese economic growth in the Republican era from 1911 to 1936 with new, regional-level, quantitative evidence. It offers a detailed sectoral reconstruction of the 1930s GDP estimates for Jiang-Zhe within the national GDP framework proposed by Liu Ta-chung and Yeh Kung-chia. The result shows that per capita GDP in Jiang-Zhe in 1930s was about 55 percent higher than China's national average, and 16–29 percent higher than those of Japanese-controlled Korea and Manchuria. It ranked only below Japan and Taiwan. Backward projection based on my 1930s Jiang-Zhe benchmark shows structural change and per-capita income growth comparable to those of Japan and her colonies between the 1910s and 1930s and an economic structure far removed from a traditional agrarian economy.
A striking feature of this distinctively regional economic growth is that it took-off in an era of national disintegration and civil strife. The article offers a narrative to demonstrate that the pattern of industrialization, especially its absence during the latter half of the nineteenth century followed by a surge in the early twentieth century, speak to the importance of ideological and institutional changes in modern China. In particular, during China's tumultuous Warlord era in the 1910s and 1920s, Shanghai transformed from a colonial treaty port to a European style city-state under the rule of Western business elites and provided effective public security and private property rights for both Chinese and foreign business within its jurisdiction. Despite the superior historical conditions of the Lower Yangzi (as recently championed by Kenneth Pomeranz and others), early-twentieth-century economic growth in the Lower Yangzi did not grow out of traditional institutions, but rather grew outside of them. Going beyond resource endowments, I highlight institutions as crucial determinants of long-term economic change.
ECONOMIC GROWTH IN THE LOWER YANGZI: A REGIONAL QUANTITATIVE RECORD
Lower Yangzi: The Historical Setting
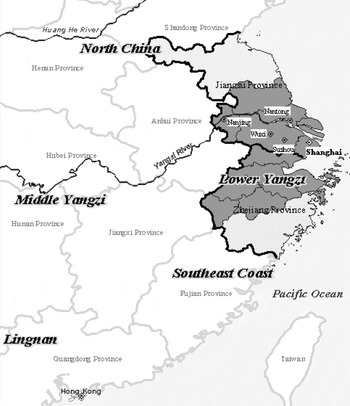
The Lower Yangzi is one of the ten economic macro-regions defined by William Skinner. Marked in dark shade in the map (Figure 1), it includes eight of the ten prefectures in Zhejiang province and ten of the 12 prefectures in the Jiangsu province plus the city of Shanghai. The Lower Yangzi macro-region constitutes a relatively integrated cultural, economic, and geographic region distinguished from those outlying prefectures in the Jiang-Zhe provinces in levels of development, degrees of commercialization, culture, and dialects.
MAP OF LOWER YANGZI AND OTHER MACRO-REGIONS IN CHINA

Due to the nature of the data, my quantitative analysis in this study is largely based on the administrative boundaries of Jiang-Zhe provinces with due references to the somewhat smaller “Lower Yangzi Macro-Region” where necessary, while “Lower Yangzi” will remain a generic term for the area.Footnote 2 At 210,741 square kilometers, roughly 86 percent the size of Britain and 56 percent the size of Japan, and with over 60 million residents in the 1930s, Jiang-Zhe is a substantial economic region, albeit only a small part of China.
The Lower Yangzi occupies a central place in recent revisionist literature on eighteenth-century China. While a full evaluation of this literature is beyond the scope of this article, I offer a perspective here with a regional macroeconomic framework.Footnote 3 In the absence of any national or regional GDP data for China in the mid-eighteenth century, I make use of the tax revenue records to get a crude approximation of the per capita income difference between the Lower Yangzi and the rest of China. My calculation based on Wang Yeh-chien's study on Qing taxation shows that the per capita tax revenue contributed by the Jiang-Zhe provinces in 1753 was 1.44 times the national average.Footnote 4
The “guess-estimates” in the global dataset by Angus Maddison show the British, West European, and European (including East Europe but not Russia and Turkey) per-capita income figures are 2, 1.7, and 1.45 times the level of China in 1700, respectively.Footnote 5 If the Jiang-Zhe per capita income could be assumed to be 1.44 times of that of China, as implied in the tax records, this would equal 72 percent, 85 percent, and about 100 percent of the per capita income of Britain, Western Europe, and Europe overall, respectively. It would also be slightly higher than Maddison's guess-estimated level for early-nineteenth-century Japan.Footnote 6 Clearly, both tax-revenue-based, regional-income-difference estimates and Maddison's guess-estimates are highly speculative. But this exercise is useful to show that a regional perspective could alter our pre-existing views on Jiang-Zhe's relative backwardness in the early modern period.Footnote 7
Shanghai-Based Industrialization: The Regional Picture
In the 1930s Shanghai alone produced 41 percent of national manufacturing output (48 percent if excluding Japanese-controlled Manchuria); housed 50 to 60 percent of cotton spindles throughout the 1910s and 1930s; and generated about 50 percent of national electricity in the 1920s, almost twice that of the major British industrial cities of Manchester and Glasgow. In the 1930s, Shanghai alone absorbed 46.4 percent of total foreign direct investment (FDI) in China and 67 percent of FDI in manufacturing and claimed 47.8 percent of China's financial capital. With more than half of China's foreign trade and one-fifth of the Chinese shipping tonnage sailing through its harbor. Shanghai was the commercial, financial, and industrial city of China in the early twentieth century.Footnote 8 Its population doubled from only half a million in the 1890s, to over a million in the 1910s, and to about 3.5 million in the 1930s, making it the world's seventh largest city.Footnote 9 These staggering statistics lead some scholars to refer to China's early-twentieth-century growth as Shanghai-based industrialization.
The Shanghai-based industrialization occurred during China's first major phase of modern industrial expansion dated from the mid-1890s. Du Xuncheng shows that nominal annual industrial investment by Chinese nationals from 1914 to 1925 was 11 times that of the 1840–1911 period.Footnote 10 The capital of a modern Chinese banking sector, largely non-existent before the mid-1890s, multiplied at an annual rate of 10.2 percent between 1897 and 1936. C. F. Remer displays a corresponding growth in foreign investment at annual rates of 8.3 percent, 5 percent, and 4.3 percent respectively for Shanghai, Manchuria, and the rest of China between 1902 and 1931. Railroad mileage built surged from a mere 364 kilometers until 1894 to over 21,000 by 1937. The national industrial output index constructed by John Chang, shows an annual real growth rate of 10 percent for the period of 1912–1936, a phenomenal growth rate by the standard of the time.Footnote 11
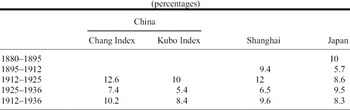
John Chang's industrial output index covers the output of modern “factory” employing seven or more workers. It includes 15 products, ten of which are mineral and metallurgical commodities. Overall, these 15 products cover between 40 and 50 percent the total modern factory output.Footnote 12 The growth rate implicit in the Chang index turns out to be upward biased due to its over-representation of the fastest-growing mining sectors, part of which was launched in Manchuria of Northeast China under Japanese colonialism from 1931.Footnote 13 Recently, Toru Kubo revised Chang's annual series by updating the cotton output series and adding important light industrial products such as silk and flour. The Kubo index as presented in Table 1 raises the total coverage to 72 percent and reduces the real annual growth rates to 8.4 percent for 1912–1936.Footnote 14
ANNUALIZED REAL GROWTH RATES OF MODERN INDUSTRY OUTPUT IN CHINA AND JAPAN
(percentages)

Sources:
The Chang index is from Chang, Industrial Development, p. 60, table 14. The Kubo index from Kubo, “Industrial Development.” The Shanghai series is from Xu and Huang, Shanghai, p. 342. Both Chang and Kubo indices are in 1933 prices and the Shanghai index by Xu and Huang is in 1936 prices. The Japanese series of factory manufacture is from Ohkawa, Growth Rate, pp. 79–80. The manufacturing price deflator is from Ohkawa et al., Estimates, pp. 192–93.
We now compare these national indices with the new modern industrial gross output series for Shanghai constructed by Xu Xinwu and Huang Hanming, for the benchmarks of 1895, 1911, 1925, and 1936 based on 1936 prices. The Shanghai index by Xu and Huang, as presented in Table 1, covers nine sectors including textiles (cotton, silk, and wool), flour milling, matches, cigarettes, paper, pharmacy, and machinery repair as well as estimates for other sectors. In the absence of any mining sectors, modern industry in Shanghai attained a real annual growth rate of 9.6 percent, faster than the Chinese national average of 8.4 percent as revealed by the Kubo index. Because the national average included the fast-growing Shanghai and Manchuria, the difference in growth rates between Shanghai and the rest of China outside of these regions would be larger than is shown in Table 1.Footnote 15
Modern industrial growth in Shanghai compares favorably with Japanese industrial performance as measured by those produced by modern factories employing more than five workers. Table 1 shows that Shanghai's growth rate leads Japan both for the 1895–1911 and the 1912-1936 periods, matched possibly only by Korea in the Japanese colonial era of 1912–1936.Footnote 16
Shanghai-based industrialization spilled over to the rest of China but most directly to her immediate hinterland, the Lower Yangzi region. For the Lower Yangzi, Shanghai became a massive draw for labor and a major source of capital and entrepreneurship. Shanghai capital supported the renowned scholar-bureaucrat-entrepreneur Zhang Qian in turning Nantong in Jiangsu province into an industrial city. Capital infusion from Wuxi-born industrial tycoons in Shanghai transformed the market town of Wuxi into China's fifth largest industrial city by the 1930s, which was then dubbed “Little Shanghai.”Footnote 17 Towards the 1930s, industrial production in Shanghai was moving from labor-intensive consumer goods towards more capital-intensive sectors, with low-value-added sectors steadily migrating to other regions, particularly southern Jiangsu. In 1933 the industrial output of Jiangsu province reached about 13 percent of that of China proper (excluding Manchuria), trailing only behind Shanghai and Japanese-controlled Manchuria.Footnote 18
Shanghai-based industrialization also impacted the agriculture sector. Industrial demand brought direct impetus to the improvement of major industrial cash crops such as cotton and silk cocoons through the diffusion of new scientific seeds and practices; and accelerated the adoption of commercial fertilizers and the introduction of power-driven agricultural machines such as water pumps and rice and flour mills.Footnote 19
The Regional Production Accounts
The most comprehensive way to register economic activities is the national income framework. The pioneering research of Ou Baosan et al. and Liu and Yeh provided the first set of Chinese GDP estimates of reasonable quality for the 1930s.Footnote 20 I employ their national-level GDP framework to calculate the total net value added (NVA) of all 13 sectors for Jiang-Zhe. I first estimate the ratio of Jiang-Zhe gross value output (GVO) in China's total and then use this ratio to multiply China's NVA for that sector to derive the Jiang-Zhe NVA.Footnote 21 Mathematically it is expressed as

where i stands for the i th of the 13 sectors and R stands for the R th provinces or city, namely, Jiangsu, Zhejiang province and the city of Shanghai. The Jiang-Zhe Net Domestic Product (NDP) is the summation of all 13 sectors' net value added. As Liu and Yeh's estimation of Chinese GDP conducted in 1965 is much more consistent in terms of theoretical framework and price and quantity information, I use their national GDP figure and NVAs for all the 13 sectors. My contribution here, as shown in the Appendix, is to derive the GVO ratio of Jiang-Zhe for China. For that, I make use of the rich regional-level data from Ou et al. as well as other available sources as detailed in the Appendix.Footnote 22
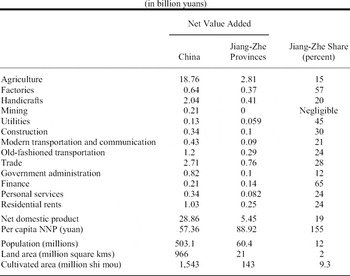
Table 2 presents my estimate of the Jiang-Zhe NDP for the 1930s with a detailed breakdown of all 13 sectors. The details of data sources and calculations are reported in the Appendix. Of the 13 sectors estimated, the coverage of products for agriculture in this study is 67 percent of the total, 60 percent for handicrafts, and 100 percent for modern industry. As usual, data for service sectors are more problematic. However, except for three sectors (less than 9 percent of the NDP), which were guess-estimated from crude assumptions, all other sectors are supported by some form of regional data.
NET DOMESTIC PRODUCT BY SECTOR OF ORIGIN FOR CHINA AND THE JIANG-ZHE PROVINCES IN 1933

Sources:
See the Appendix. Population for Jiangsu, Zhejiang, and Shanghai were 34.9, 22, and 3.5 million respectively. See Liu and Yeh, Economy, pp. 178–79; and Murphey, Shanghai, p. 22. Cultivated acreages for China, Jiangsu, Zhejiang were 1,534, 92 and 51 millions respectively, see Liu and Yeh, Economy, p. 129. Land area is from the China State Statistical Bureau cited in Maddison, Chinese Economic Performance, p. 181.
Table 2 shows that in 1933 the Jiang-Zhe provinces, with a 12 percent share of the Chinese population, contributed 15 percent of agriculture, 20 percent of handicrafts, 57 percent of modern factory output, 65 percent of finance and 45 percent of modern utilities services. Taken together the Jiang-Zhe provinces had 19 percent of China's NDP, with a per capita NDP 1.55 times the national average. Output produced by modern factories had a much larger impact in Jiang-Zhe, reaching 7 percent of NDP versus only 2 percent for China. The share of modern-factory in total manufacturing output (including both factory and traditional handicraft production) was 47 percent for Jiang-Zhe versus only 24 percent for China. This ratio likely puts Jiang-Zhe on about the same level as Japan in the 1900s or the 1910s.Footnote 23
Rawski's unpublished manuscript also offers a GDP estimate for what he defines as the “Lower Yangzi Core” in the 1930s. His per capita income estimate for the core is only 37 percent above the national average, lower than my 55 percent. His “Lower Yangzi Core” has a 7.8 percent share of China's population compared to 12 percent for Jiang-Zhe. As Rawski's manuscript does not present details of geographic definition or data sources, it is hard to pinpoint the sources of discrepancy. My crude guess is that there are differences in geographic coverage and possible underestimation of agricultural and handicraft sectors in his estimates.Footnote 24
Growth and Structural Change
Rawski's 1989 book, Economic Growth in Prewar China, provides a most comprehensive reassessment of Chinese economic growth during the Republican era and derives a new estimate of national per capita income growth rate of 1.1–1.2 percent, not much below the Japanese rate of growth of about 1.4 percent between the 1910s and 1930s. This is a remarkably optimistic assessment compared with earlier estimates of annual growth rate of per capita GDP at 0.33 percent for this period.Footnote 25 As there is no 1914–1918 benchmark GDP data for China. Rawski, following Yeh Kung-chia, use sectoral series of real growth rates to derive the real GDP growth rates between 1914–1918 and 1931–1936.
Given the small share of the fastest growing modern sectors, Rawski's upward revision of per capita Chinese GDP growth rate between 1914–1918 and 1931–1936 from Yeh's 0.33 percent to 1.1–1.2 percent hinges on a reassessment of the agricultural sector, which accounted for more than 60 percent of GDP. In the absence of reliable agricultural output data for 1914–1918, Rawski uses the growth rate of several scattered series of agricultural real wages to derive his real per capita agricultural output series between the 1910s and 1930s. The annual 1.4–1.7 percent growth in per capita agricultural output thus derived raises his overall 1930s Chinese per-capita income estimate 16 percent above that of Liu and Yeh's original estimate. Without this upward revision in agricultural output, Rawski's revised per-capita income would only be 6 percent higher than the Liu and Yeh estimate and the annual GDP per capita growth rate between the 1910s and 1930s would decrease to 0.5 percent, not that different from the original 0.33 percent rate by Yeh.Footnote 26
Here, I establish a case of regional economic growth without such “aggressive” assumptions about agricultural performance. Given there are no sectoral growth rates for Jiang-Zhe provinces during this period, I use the same rates for China established by Rawski except for agriculture, where I use Yeh's original rate of 0.8 percent. Because Jiang-Zhe is likely to grow faster at the sectoral level than China, the assumption of equal rates for the two establishes a lower-bound estimate for Jiang-Zhe GDP growth rates between the 1910s and 1930s, with differences in growth rates between Jiang-Zhe and China driven entirely by their different sectoral weights.
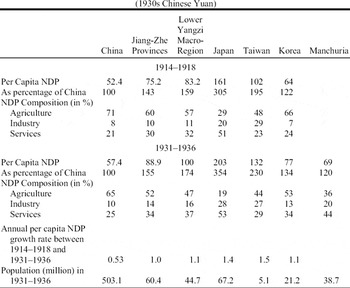
Table 3 shows that annual per capita NDP growth in both Jiang-Zhe provinces, at 1 percent, were roughly double that of China and almost matched those of Japan and her colonies during this period. So, even in the absence of the “Rawskian” type of upward revision in agricultural output growth, the growth rate in per capita terms in Jiang-Zhe—not China—had already achieved rates comparable to those of her East Asian neighbors. If we apply Rawski's revised agricultural growth rate of 1.55 percent rather than the original 0.8 percent used by Yeh and hold everything else the same, the overall Chinese per capita GDP between 1914–1918 and 1931–1936 is raised to 1 percent per year, and the Jiang-Zhe per capita GDP growth rate attains 1.4 percent, giving the region one of the highest growth records in East Asia for the period.Footnote 27 In either scenario, the case for regional growth can be established beyond dispute.
PER CAPITA NDP AND NDP COMPOSITION IN EAST ASIA IN 1914–1918 AND 1931–1936

Source Notes:
The averages of NDP (all in 1934–1936 constant prices) and population in 1914–1918 and 1931–1936 for Japan, Taiwan, and Korea are calculated from Mizoguchi and Umemura, Basic Economic Statistics, pp. 228–29, 232–33, and 236–37, respectively.
“Industry” includes factory, handicrafts, and mining. “Services” include sectors other than agriculture and industry.
Growth rates used for the 13 sectors (except for agriculture) to project the 1931–1936 China and Jiang-Zhe series backward to the 1914–1918 are from Rawski, Economic Growth, p. 274. They are 0.8, 8.1, 8.1, 8.1, 1.4, 4.6, 3, 1.9, 2.5, 5, 3.4, 0.9, and 0.8 percent respectively for agriculture, modern factory, mining, utilities, handicrafts, construction, modern transportation and communication, traditional transportation and communication, trade, finance, government administration, personal services, and residential rents.
Population figures for China and Jiang-Zhe provinces in 1914–1918 are 440 and 54.1 million, respectively. China's 440 million population in 1914–1918 is from Yeh, “China's National Income,” p. 104. The population figures for Jiangsu and Zhejiang provinces are 33.7 and 19.2 million, respectively, from Perkins, Agricultural Development, p. 212. Adding the 1.2 million Shanghai population sums to 54.1 million for Jiang-Zhe (Shanghai population is from Murphey, Shanghai, p. 23).
The Lower Yangzi Macro-Region per capita income can be calculated as: YLY = (YJZ - YC ÷ PEX) ÷ PLY; where YLY, YJZ and YC, stand for the per capita incomes of the Lower Yangzi Macro-Region, Jiang-Zhe, and China respectively, and PLY and PEX denote the respective population shares of the Lower Yangzi Macro-Region and the remaining four prefectures in Jiang-Zhe provinces. The prefectural-level data in 1910 is from Chao Suji, Zhongguo Renkoushi, vol. 5, pp. 691–92, which shows that population in the Lower Yangzi Region had a share of 74 percent of the Jiang-Zhe provinces. The same 74 percent is applied to calculate the 1931–1936 population of the Lower Yangzi Macro-Region.
Manchuria (for 1934) is from Eckstein, Chao, and Chang, “Economic Development,” pp. 254–55. These estimates of per capita income are consistent with more recent work by Yamamoto Yuzou, Nihon Shokuminchi, p. 116.
The exchange rate is equal to 1 yuan = 1.1 yen calculated as the average of 1933–1936 from Hsiao, China's Foreign Trade Statistics, p. 192.
The case for regional growth can be further strengthened if we compare the growth rate in Jiang-Zhe with the rest of China excluding Jiang-Zhe and Manchuria. With an overall Chinese per capita growth rate of 0.53 between the 1910s and 1930s, and assuming a combined annual per capita growth rate of 1 percent for Jiang-Zhe and Manchuria with a total of 25 percent share in overall Chinese GDP, the annual per capita GDP rate of growth for the rest of China (excluding Jiang-Zhe and Manchuria) will be 0.37. This is just about a third of the growth rate of Jiang-Zhe in this Republican era, a finding that confirms Rawski's observation that “regional growth in Manchuria, . . . and probably in the Lower Yangtze areas of China may have progressed more rapidly than the national average, thus ensuring that other regions experienced below average, and possibly negative, growth.”Footnote 28
Table 3 also confirms that the absolute level of per-capita income in Jiang-Zhe based on 1930 exchange-rate conversions was higher than those of Korea and Manchuria, ranking third only after Japan and Taiwan in the 1930s.Footnote 29 It shows the economic structures of the Jiang-Zhe in 1914–1918 and 1931–1936 were characterized by shares in industry and service sectors much higher than those that defined the primarily agrarian China. With a population almost the size of Japan's and more than ten times that of Taiwan in the 1930s, Jiang-Zhe was clearly the second largest industrial region in East Asia (perhaps Asia).
Table 3 shows the per capita GDP estimate of the Lower Yangzi Macro-Region (see Figure 1), calculated assuming that the per-capita income of the four prefectures outside the “Macro-Region” but within Jiang-Zhe were equal to China's national average (including that of the Jiang-Zhe Provinces). This calculation shows that the per capita income for the Lower Yangzi Macro-Region in 1933 at 1.74 times the level of China, with an economic structure even further “advanced” than China and Jiang-Zhe.
Any causal statements linking these growth figures to human welfare should hinge on further research on consumption expenditure and income distribution. Existing studies based on household income and consumption surveys conducted during the 1920s and 1930s seem to point to higher household income and consumption standards in Shanghai than in other urban centers outside the Lower Yangzi. Some other surveys conducted for rural households also seem to point to similarly higher levels in Jiang-Zhe than in other parts of China. However, without careful control for differences in sampling methods and regional price effects, these findings only remain very tentative support for the outcome of my production-based study.Footnote 30
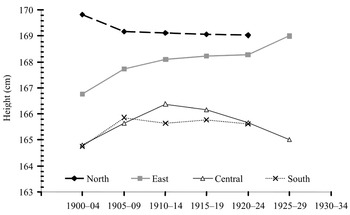
Recent anthropometric research by Stephen Morgan seems more definitive. Analyzing thousands of height records of railway employees across China, Morgan concludes that from the last years of the nineteenth century to the second half of the 1920s, the average male stature in China increased 0.25cm per decade but grew by 0.7cm per decade in Jiang-Zhe provinces. This 0.7 cm per decade height increase is only slightly lower than the 0.91 cm per decade increase for Japan between 1892 and 1937. In fact, Morgan's regional figure for railway skilled workers, reproduced here in Figure 2 shows that only the average height of Jiang-Zhe subjects (classified by Morgan as “East” in the figure) shows a consistent upward trend, while average heights in North China, Central China, and South China either stagnated or fluctuated between 1900 and 1929. This evidence leads him to conclude a spatially differentiated and uneven pattern of economic growth, a finding that lends strong support to this study.Footnote 31
ESTIMATE AVERAGE TREND IN ADULT HEIGHT BY REGION, 1900–1929

LOWER YANGZI ECONOMIC GROWTH IN HISTORICAL PERSPECTIVE
Political Change and Industrial Development
The distinctively regional nature of economic growth in the early twentieth century raises some large questions germane to the historical origin and pattern of modern economic growth in China and East Asia. In fact, compared with Japan, a growth spurt that came nearly four decades after China's encounter with Western Imperialism around the mid-nineteenth century seems less like a miracle than a puzzle. The contrast is particularly puzzling given the emergence of Chinese mercantile dominance across regions of East and Southeast Asia after the mid-nineteenth century under a free-trade regime imposed by Western imperialism. In particular, Shanghai, as a newly opened treaty port, rapidly emerged as the node of a vast trading network that enveloped, among others, the Japanese treaty ports of Yokohama and Kobe. In fact, the dominance and solidarity of the Chinese merchant network throughout Asia posed a challenge to the young Meiji government as formidable as its agenda of catching-up with the West.Footnote 32 To tackle the puzzle of Chinese industrialization in nineteenth-century China, I turn to a brief review of the economic policy contrasts between China and Japan.
In Japan, the new Meiji leaders who came to power in 1868 embarked on a comprehensive reform program to forge a modern nation-state modeled after the West. Although the Meiji government initially engaged in a series of government-sponsored enterprises, their liquidation by the 1880s signaled a decisive switch of its policy away from direct engagements towards indirect support for the private sector. The government engaged in the building-up of critical public infrastructure such as railroads and telegraphs, the establishment of a modern education system, the drafting of the commercial code in the 1880s, and the founding of the Bank of Japan in 1882. The 1880s marked the beginning of Japan's full-scale industrialization.Footnote 33
In comparison, the late-Qing government in China under the era of Tongzhi Restoration (1862–1874) aimed to restore the traditional economy from the Taiping devastation. The limited reform carried out under the banner of the Self-Strengthening Movement (1860–1894) erected a series of government-financed or controlled Western-style, capital-intensive industrial and military enterprises in a largely agrarian setting. While these high-profile government-sponsored enterprises were fraught with corruption and inefficiencies, the much more deleterious impact of late-Qing economic structure fell on the development of a modern private sector.Footnote 34
Detailed case studies reveal that attempts to set up modern factories in sectors such as cotton and silk (that were to form the core of early-twentieth-century industrialization) met serious resistance even within the treaty port. Similar obstacles confronted the building of key public infrastructures such as modern railroads and steam shipping in inland waters in the nineteenth century.Footnote 35 This critical policy difference towards private sector and public infrastructure held the key to explaining the divergent paths of industrialization between China and Japan.Footnote 36
The 1894–1896 naval confrontation between China and Japan became a turning point when the fruits of these two modernization programs were put to test. The much bigger guns and battleships of the Chinese Northern Fleet built under the Self-Strengthening Movement suffered humiliating loss at the hands of a smaller but more disciplined Japanese navy, supported by a modern economic infrastructure built up during the Meiji era: railroads and steam ships that mobilized troops, a banking system and a bond market that supported war finance.Footnote 37
China's defeat by a nation long regarded as her former student brought a profound mental shock, which spelled the end of the Self-Strengthening Movement and opened the path towards the late-Qing constitutional reform in 1903–1911 modeled directly on Japan's Meiji reform.Footnote 38 The constitutional reform recognized the centrality of the private sector to a market economy and paved the way for the introduction of modern public infrastructure.Footnote 39 But the immediate economic impact of the defeat was the signing of the treaty of Shimonoseki in 1896 that granted foreigners the right to establish factories in the treaty port, lifting the floodgate of foreign direct investment in China and indirectly legitimizing Chinese modern enterprises. These dramatic turns of events around the turn of the century set off the first major wave of Chinese industrialization.
The Late-Qing constitutional reform was as short-lived as the final years of the empire, which collapsed in 1911. The new Republican regime, following the death of its first dictatorial ruler, Yuan Shikai in 1916, was politically weak and fiscally insolvent. National disintegration and civil strife became the norm in the two decades of warlordism after 1916. According to James Sheridan, warlords often brought terror and exploitation. “[Theirü demand for money was insatiable and the militarists wrung an astonishing array of taxes from the population. They printed worthless currency on a large scale. . .. In many areas, the actions of organized crimes were less serious than the hordes of uncontrolled soldiers who roamed the countryside preying on the peasantry.”Footnote 40
According to one estimate, there were some 140 wars fought among a total of more than 1,300 rival militarists between 1911 and 1928.Footnote 41 In the Lower Yangzi, the least war-torn area, the war between the rival Jiangsu and Zhejiang warlords in 1924 led to massive forced requisitioning of civilian personnel and services, confiscation of private properties, extortion of merchants and businesses, and severe disruptions of production and trade, inflicting total economic losses estimated between four and five hundred million yuan.Footnote 42
The extent of warlord damage to the Chinese economy is disputed by Rawski who points to the limited scale and duration of warfare. Furthermore, there were enlightened and stable warlords such as Yan Xishan and Feng Yuxiang who promoted economic reforms in the territories under their rule. The logic of Chinese warlord politics inspired Mancur Olson's classic distinction between stationary bandits—those with long-tenure rule and thus less predatory—and roving bandits—those with short time horizon and consequently more destructive.Footnote 43 Overall, despite the reassessment of the warlord era, Rawski agrees that “political unrest and civil wars made any long-range investment extremely precarious.”Footnote 44
How did and could industrialization take root in an era of widespread abuse of property rights and pervasive political uncertainty during the Republican era? For that, we turn to a new political entity in the Lower Yangzi: the treaty port of Shanghai ruled by Western business elites.
The Rise of the City
Shanghai, once a market town peripheral to the city of Suzhou in the traditional Lower Yangzi, was opened as a designated treaty port in 1842. As a treaty port, Shanghai was under separate jurisdictions of British, French, and American Concessions as well as Chinese quarters. In 1863 the British concession merged with the American quarters to form the International Settlement for all Western (and later Japanese) residents. Following the massive influx of Chinese refugees during the Taiping rebellion, Chinese residents quickly formed the majority of the Settlement residents.
The Settlement operated with its own mini-Constitution: the Shanghai Land Regulations signed in 1854 and subsequently revised and approved in 1866. It organized a Municipal Council whose members were elected by the rate-payers association consisting of tax-paying Western and later Japanese residents in the Settlement. Judicial powers over foreign residents were, under the grant of extraterritoriality, vested in the Consular Courts of the foreigners concerned, or, in the case of unrepresented foreigners or Chinese, in the International Mixed Court. This institutional structure placed the Settlement on a foundation of limited power and rule of law.Footnote 45
The Municipal Council levied land and property taxes and business license fees, ran its own prison and police squad with the additional support of a volunteer army in times of need. In comparison with the Chinese quarter governed by the local Qing government, the business-dominated council was far more efficient in the provision of public goods (or semi-public goods) including the maintenance and improvement of city roads, transportation and communication infrastructures, public utilities, and port facilities.Footnote 46
This governance structure of the Settlement is reminiscent of the Medieval European political tradition where incorporated urban communities practiced self-rule under merchant elites or oligarchies often with charters granted by larger territorial rulers. From its very early days, the Western merchant elites of the Settlement had desired and fought for self-rule. This is an institutional feature that distinguished the Settlement from most other treaty ports in China or even the neighboring French Concession, which had been under the administrative rule of the French consular officials appointed from Paris.Footnote 47
In the wake of the dynastic collapse in China in 1911, the International Settlement and the French Concession realized their greatest territorial expansion to reach 33 square kilometers, 1.5 times the total size of foreign concessions in the other 23 treaty ports in China.Footnote 48 When the Qing magistrate in Shanghai absconded—allegedly with public funds—during the 1911 revolution, the International Settlement took over the Mixed Court and began to appoint its own Chinese personnel. By then, the Settlement became a de-facto city-state with full territorial jurisdiction over its residents, Western and Chinese. This is the second institutional feature that set it apart from the rest of foreign concessions in China.
Thomas Stephens's study of the Mixed Court in 1911–1925 led him to emphatically state that “throughout all the political vicissitudes of the Yuan Shikai era . . ., throughout all the marching and countermarching of the armies of the warlords and their murdering marauding hordes, . . . Shanghai became an oasis of peace, order and good government in a China torn into convulsions by revolution, banditry and civil war.”Footnote 49 The 1911–1925 period saw the transformation of Shanghai into a truly industrial city and ushered in what Marie-Claire Bergere hailed as the golden age of Chinese bourgeoisie.Footnote 50
But beyond security and order, the institutional model of the International Settlement had exerted a profound and lasting impact on political organization, legal regime of property rights and contract enforcement, fiscal structure, and civil society. It laid the political foundation for a legendary Shanghai style of freewheeling capitalism characterized by free trade, free capital, and banking with a small government but a large civil society.Footnote 51 The historical significance of the International Settlement is eloquently captured by Justice Richard Feetham, the judge called upon to review the legal status of the Settlement in the 1930s:
The great piles of banks, offices and warehouses along the Bund [the financial hub of Shanghaiü, as seen from the deck of an ocean liner steaming up the river, are at once recognized by the newcomer as evidence of the wealth and enterprise of Shanghai, and of the belief which its merchants and citizens have in its future. But they have a deeper economic significance than this; they are the first conspicuous signs and symbols of the sanctity of the rights of private property, as recognized and safeguarded in the [Internationalü Settlement, and of the far-reaching confidence which this condition of things has inspired.Footnote 52
The political power of the city-state spread beyond the Settlement. In the warlord era, the political structure of Western Shanghai uniquely empowered the Chinese business class to defy the political center and wring concessions of peace from the warlord governments. The Lower Yangzi became the least war-torn region in China—avoiding major battles at least before 1924—partly thanks to the political mobilization of the Shanghai General Chamber of Commerce, the majority of the members of which were Jiang-Zhe natives with a huge stake in the region's peace and order. The Shanghai capitalists also forged an intricate and sometimes treacherous alliance with the new Nationalist regime that founded its capital in Nanjing (Jiangsu province) in 1927. The city, especially its Chinese financial elites, helped shape the new empire—the Nationalist regime—in the formulation of a comprehensive national economic policy which included the restoration of tariff autonomy, modernization of China's public finance and monetary regime.Footnote 53
The Epilogue
The flowering of a European city-state in the middle of twentieth-century China was fraught with historical irony and institutional contradiction. The Municipal Council's systematic practice of political exclusion and racial discrimination had turned Shanghai into a symbol of national humiliation. The co-existence of three separate jurisdictions in a tight and open space created a fertile ground for political agitation and organized crime.Footnote 54 The political autonomy of colonial Shanghai was swept away by the full-scale Japanese invasion in 1941, followed by the arrival of the Communist troops in 1949, which returned China to international isolation.
Shanghai capitalists' massive exodus to colonial Hong Kong, brought that city capital, industrial skills, entrepreneurial vision, and (as recognized by the Hong Kong government) a 10–15 year head-start in industrialization over many other Asian countries.Footnote 55 China's emergence out of isolation in the late 1970s saw the resurgence of Shanghai and the Lower Yangzi. Although economic growth during China's reform era occurred in a different institutional context, a historical shadow of old Shanghai capitalism loomed in contemporary Chinese reform: the increased role of foreign direct investment, the policy experimentation with “special economic zones,” and the preservation of Hong Kong's autonomy under the “one country two systems” framework.Footnote 56
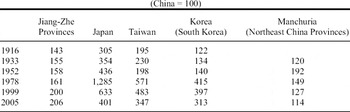
Table 4 links my 1910s and 1930s regional per capita GDP to the post–World War II data in a comparative East Asian framework (with the usual caveats against the hazards of cross-country comparison). Note that the relative rankings of per capita income in 1952 largely mirrored those of the 1930s (with Northeast China, formerly Manchuria, being the only exception).Footnote 57 While the gap between Jiang-Zhe and China remains unchanged in 1978, China's overall standing in per capita GDP had fallen far behind those market economies of her East Asian neighbors after two decades of isolation and command economies. Two decades of opening-up and reform enable a significant catch-up of China and especially Jiang-Zhe with her East Asian neighbors. Meanwhile, with the resurgence of Shanghai along with China's increasing regional inequality, the economic distance between Jiang-Zhe and the rest of the nation attained a ratio of over two by 1999 and 2005, a historical high.
RELATIVE PER-CAPITA GDP IN CHINA AND EAST ASIA

Sources:
Data for Japan, Taiwan, and South Korea in 1952–2005 are from Groningen Growth Center website (http://www.ggdc.net/homeggdc.html). The regional per capita income differences for 1999 and 2005 are calculated from relevant annual issues of China Statistical Yearbook. The data for China in 1952 and 1978 are from Xin Zhongguo Wusenian by the State Statistical Bureau.
CONCLUSION
Through the reconstruction of a regional prewar GDP estimate and its growth dynamics, this article establishes the case for regional growth concentrated in the Lower Yangzi area and a major reinterpretation of the extent and nature of Chinese economic growth between the 1910s and the 1930s. The narrative structures this growth in the larger historical context and highlights political and institutional changes as the most important determinants to both the timing and pattern of industrialization in China and East Asia during the late nineteenth through early twentieth centuries. In particular, it emphasizes the importance of a new political entity, the International Settlement in Shanghai, that supplied public order and protected private property rights in an era of national disintegration and civil strife. The political structure of a city-state forged a legendary Shanghai style of freewheeling capitalism, a model that stood apart from the acclaimed East Asian model of state-led industrialization in postwar Japan and Korea. Nonetheless, weighed down by its colonial stigma and narrow interest, the city-state model of the Shanghai International Settlement is neither sustainable nor replicable.
The tortuous path of Chinese industrialization in the nineteenth through twentieth centuries questions the fundamental compatibility of its traditional institutions with modern economic growth. While this call forth a larger research agenda, this article draws attention to potential methodological problems inherent in comparative studies that pair economic regions with independent nation states. Situated within the political structure of a centralized empire, economic regions such as the Lower Yangzi encountered constraints to institutional change far more severe than would independent nation-states such as Britain or Japan. As shown above, the rise of Shanghai first as a trading port in the latter half of the nineteenth century and then as an industrial metropolis was largely determined in the large context of political changes in the Chinese empire. Within China's centralized power structure, elements for change from the bottom were perennially short of political space and often survived precariously at the empire's fringe. It is no surprise that institutional breakthroughs in modern East Asia came from new political structures created outside the empire: the rise of a nation-state of Meiji Japan after 1868 and the formation of a breakaway city of Shanghai after the turn of the twentieth century.
The lessons on the diffusion of the Industrial Revolution in East Asia also shed light on the ongoing debate on the origin of the Industrial Revolution. The absence of coal deposits in the Lower Yangzi, as emphasized by Pomeranz for the eighteenth century, did not become a major constraint to Shanghai-based industrialization. Shanghai industrialization, as noted by Rhodes Murphey, was an anomaly by Western standards, characterized by a local absence of most of the essential materials for manufacturing, especially coal. In the mid-nineteenth century when the city was opened as a treaty port, coal arrived from faraway England, then from Japan during the late nineteenth century, and finally from North China in the twentieth century following the completion of railroads.Footnote 58
Similarly, the much-written-about favorable geography of Shanghai—its central position on the coast of East Asia and the Lower Yangzi hinterland—seems more the endogenous outcome of geo-political changes as acutely observed by one Chinese resident of the International Settlement:
That this place was chosen as the “Settlement” precisely shows these (Western) barbarians have a vision. It is a global vision. Within the shooting range of (Western) military gunboats on the Huangpu river, the Settlement came under effective (Western) naval protection. . .. From a closed perspective, this is a piece of muddy swamp with little value other than some defense against enemies from outside the city wall. But from an open perspective, this is the point of entry to China's richest region and the departure to the world.Footnote 59
Appendix: Net Domestic Product by Sector of Origin for China and the Jiang-Zhe Provinces in 1933
AGRICULTURE
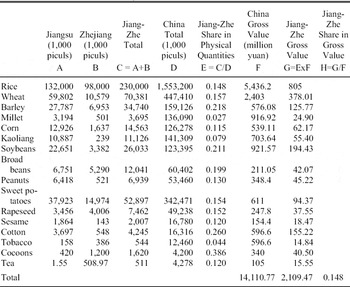
The agricultural share of the Jiang-Zhe province is calculated through two steps. The first step is to use the provincial level data (1931–1937 averages) in the Crop Reports published by the National Agricultural Research Bureau (NARB) added with the Manchurian output data to calculate the Jiang-Zhe share in physical units for each commodity. The results are presented in columns A through E of Appendix Table 1. The second step is to multiply the 1933 unit prices of each agricultural commodity by the 1933 agricultural output in physical units to arrive at a total agricultural gross value for China. This Chinese agricultural output value is then multiplied by the Jiang-Zhe share to arrive at the Jiang-Zhe agricultural gross output value in column C. The final share of Jiang-Zhe provinces in agricultural value-added is then calculated as the ratio of Jiang-Zhe gross value to that of China shown as 0.148 in column H.
Note that the Jiang-Zhe share in physical output units is calculated based on the 1931–1937 averages, but the Jiang-zhe share in gross value for 1933 is based on Liu and Yeh price and output data, Economy, p. 140. Their gross value for Chinese agriculture in 1933 amounts to 21,170 million yuan (p. 140). Because the gross value of Chinese agricultural products covered in this study sums to 14,110.77 million yuan (column F), this indicates the coverage of products included in this study amounts to 67 percent of the total agricultural gross output for China.
MODERN FACTORY
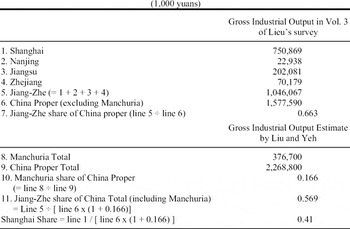
The coverage of modern factory output is the most complete thanks to the 1933 survey conducted under the able leadership of D. K. Lieu. However, the survey covered only the so-called “China Proper,” which is equivalent to the current Chinese territory but without the Japanese-controlled Manchuria, roughly equivalent to today's Northeast provinces of Heilongjiang, Changchun, and Jilin. From Appendix Table 2, I derive the Jiang-Zhe Share of China Proper as 0.663. Then I calculate the Japanese controlled Manchuria share of 0.166 in China Proper from Liu and Yeh's estimate. These two results enable me to calculate the Jiang-Zhe share of China total (including Manchuria) as 0.569.
A new estimate by Kubo and Makino gives a higher Manchuria share of China Proper's industrial output at 0.266 (table 13, p. 41). Using their estimates would have a negligible impact on my result (Jiang-Zhe share of modern industry would be 0.549 instead of 0.569). In view of the preliminary nature of their revision, I have stayed with the Liu and Yeh figure.
CHINESE AND JIANG-ZHE PROVINCIAL AGRICULTURAL GROSS OUTPUT (IN 1931–1937 AVERAGE) AND GROSS VALUE IN 1933 PRICE

Sources:
Sources: For gross output in physical quantities, rice output is from Liu and Yeh, Economy, p. 290; tea is from Ou et al. eds., Zhongguo Guomin Suode, (vol. 2), p. 11; cocoons are for the early 1920s from Perkins, Agricultural Development, p. 286; and the rest are the 1931–1937 averages (1,000 piculs) from the various issues of Crop Reports by NARB summed up in Shina Nongyou Kisou Tokei Shiryou, vol. 2 published by Toa Kenkyujyou. Note that the original Crop Reports only covered 22 provinces, the Shina Nongyou Kisou Tokei Shiryou added the Manchuria agricultural output to make to the China total, which is used here. Although the national agricultural output given by the Crop Reports, which I used for calculating the regional GVO ratio, are known to be under-estimates corrected by Perkins (Agricultural Development) and Liu and Yeh, Economy, this will not affect my regional ratio as long as the national and regional estimates in the Crop Reports are both downward biased.
Column F for China gross value is the product of 1933 commodity prices and output. Price and output data are from Liu and Yeh, Economy, p. 136 and p. 300, respectively. Cocoon price is from Perkins, Agricultural Development, p. 288.
HANDICRAFT
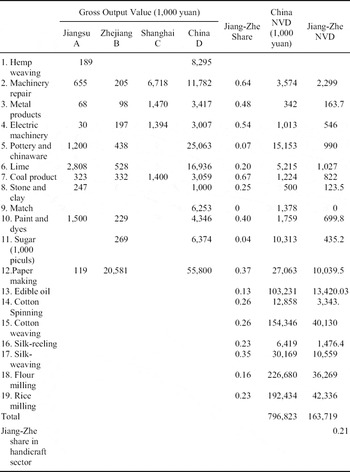
For calculating the share of Jiang-Zhe provinces in Handicraft value added, I use the provincial level handicraft gross output value data in Volume 2 of Ou, Baosan et al.'s book, Zhongguo Guomin Suode, to calculate the Jiang-Zhe share for 12 products.
CHINA'S GROSS OUTPUT VALUE BY MODERN FACTORY

Source:
The gross industrial output in vol. 3 of D. K. Lieu's survey is summarized in Kubo and Makino, table 2, p. 29. Makino and Kubo's table also listed provincial level industrial output data from Vol. 2 of Lieu's survey. Vol. 2 data would give the Jiang-Zhe a higher share of 0.596 in China's total (including Manchuria). I have opted for the vol. 3 figure because it had a wider coverage of factories than vol. 2. The gross industrial output estimate by Liu and Yeh is from Economy, p. 428, table F-1.
Unfortunately, there is no solid provincial-level data for most other handicraft products including some of the most important items such as flour and rice milling, cotton and silk goods, or oil products. I make rough estimates of these shares based on a variety of sources with different cross-checks. In particular, as most of these handicraft productions are highly localized, agricultural sideline activities, I use provincial shares of agricultural raw materials as proxies for shares of handicraft output. In Appendix Table 3, columns A through E derive the Jiang-Zhe shares of each of these 19 items. Then I multiply this Jiang-Zhe share to the total Chinese Net Value-added (NVD) to derive the Jiang-Zhe NVD in column G. China Net Value-added in column F is from Ou et al, Zhongguo Guomin Suode, vol. 1, pp. 65–66. The final Jiang-Zhe share in national handicraft NVD is 0.21. This ratio matches surprisingly well with a government survey in 1936 showing that the Jiang-Zhe share in total agricultural by-products is 0.22 (cited in Wang Jin-yu, Jindai Zhongguo Zhiben Zhuyi, p. 101).
Note that as the total net value added of China's handicraft product amounts to 1,340,078 thousand yuan (Ou et al, Zhongguo Guomin Suode, vol. 1, p. 66), the 19 products included here (with total net value added summed to 796,823) would constitute about 60 percent of total handicraft NVD in China.
JIANG-ZHE PROVINCES HANDICRAFT NET VALUE-ADDED FOR THE 1930S

Source and derivation notes for the 19 handicraft items:
1. Hemp weaving: Ou et al., Zhongguo Guomin Suode, vol. 2, pp. 113–14.
2. Machinery repair: ibid., pp. 37–40.
3. Metal products: ibid., p. 36.
4. Electric machinery: ibid., vol. 2, p. 47.
5. Pottery and chinaware: ibid., vol. 2, p. 60.
6. Lime: ibid., pp. 61–63.
7. and 8. Coal products, Stone and clay: ibid., pp. 64–65.
9. Match: ibid., p. 74.
10. Paint and dyes: ibid., p. 82.
11. Sugar: ibid., pp. 138–39.
12. Paper making: ibid., pp. 152–55
13. Oil: ibid., p. 145, provides national estimates of seven types of edible oil products but no provincial-level data. As traditional oil processing was highly localized, I use share of raw agricultural materials to gauge Jiang-Zhe's share of edible oil products in national output. The two most important oil items are soybean and peanut oil. Jiang-zhe share in soybeans production in national agricultural output is 0.14. Perkins's book, Agricultural Development, provides provincial-level acreage statistics for soybeans, rapeseed, sesame, peanuts, and cotton (for cotton oil) (pp. 258–61). The Jiang-Zhe shares of acreage in these five items are 0.11, 0.13, 0.11, 0.09 and 0.21. I give an overall Jiang-Zhe share of 0.12 for oil products.
14. Cotton-spinning: there is no provincial level hand-spun cotton yarn data. It is however reasonable to assume a close geographical relationship between local cotton cultivation and hand-spun cotton yarn production. So I use 0.26, which is the Jiang-Zhe share of raw cotton production to proxy for its share of hand-spun yarn.
15. Cotton-weaving; there is no provincial level hand-woven cotton cloth data. I the 0.26 Jiang-Zhe share of cotton production in national total as a proxy for its share of hand-woven cloth output with the following two independent cross-checks:
Xu Xinwu, Jiangnan Tubushi, p. 215, shows that the Jiangsu share of hand-woven cloth output amount to 27 percent of the national total around 1860.
Yan Zhong-ping, Zhongguo Miafang Zhi Shigao, pp. 241–51, provides a survey of regional distribution of hand-weaving production in selected provinces in China. The relative importance across difference provinces in hand-weaving production ranked in his survey matches the ranking in provincial-level cotton acreage statistics for 1931–1937 listed in Perkins's data, Agricultural Development, p. 261, with Hebei province having the highest output, followed by Shandong and Jiangsu. This is a confirmation of the relationship between local cotton cultivation and hand-weaving production. Both these two cross-checks are far from perfect, but they offer support that the 0.26 share I chose is possibly within reasonable bounds of accuracy.
16. Silk-reeling: using data compiled by Japanese scholar Shigemi Uehara, Ou et al., Zhongguo Guomin Suode, vol. 2, pp. 102–03, shows that total raw silk output figures (both machine and hand-reeled) for Jiangsu, Zhejiang, and China proper (excluding the Japanese occupied Manchuria) were 36,405, 106,230 and 300,788 piculs respectively for 1927. Ou et al., ibid., p. 102, shows the total raw silk output for both China total (including Manchuria) and Manchuria as well as prices for Zhejiang and Manchuria raw silk in 1933. Based on this, I calculate the Manchuria share in China's total gross output value as 18 percent. From this, I derive the Jiang-Zhe share in China's total raw silk output as equal to 0.40 [= (36,405 + 106,230) / (300,788 * 1.18)ü. To calculate the Jiang-Zhe share in hand-reeled raw silk, I use the information (Ou et al., ibid., p. 102) that machine-reeled raw silk was about 41 percent of total raw silk output and the Jiang-Zhe share of machine-reeled raw silk output was 65 percent of China (ibid., p. 101, table 5) to derive the ratio of 0.23 [= (0.40 – 0.41 * 0.65) / (1 – 0.41)ü for Jiang-Zhe share of hand-reeled raw silk in China's total.
17. Silk-weaving: the Lower Yangzi region has traditionally been the premium producing region. Ou et al, ibid., p. 104, shows that the Jiang-Zhe share of machine-woven silk goods amounts to more than 70 percent of the national total. Clearly, the Jiang-Zhe share of hand-woven silk products would not be as dominant but could be higher than its 0.23 share for hand-reeled raw silk. I choose 0.35 as the final share for Jiang-Zhe share.
18. Flour-milling: I use the Jiang-Zhe share of wheat output, 0.16, for its share of handicraft flouring milling in China.
19. Rice-milling: Ou et al., ibid., p. 126, shows the Jiang-Zhe share in rice milled in modern factories is 0.28 of the national total. However, rice output in Jiang-Zhe is equal to 0.16 of the national total. As Jiang-Zhe provinces have long been rice-deficit region and rice imported from other regions are likely go through additional milling, I give 0.22 for the Jiang-Zhe share.
THE SERVICE SECTOR
Finance
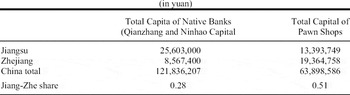
For finance, one estimate claims that Shanghai's total capital including deposits, convertible notes and retained earnings of banks, Native Banks (Qiangzhong), Trust Corp. was about 47.8 percent of China in 1936 (Zhang, Zhong-Li, Jindai Shanghai Chengshi Yanjiu, p. 313). Rawski, Economic Growth, estimates that deposits of native banks in Shanghai account for 30 percent of the national total in 1935 (p. 390). Ou et al., Zhongguo Guomin Suode, also provides some provincial level figures for native banks and pawn shops as follows. It is not very clear whether Ou et al.'s data of native banks and pawn shops included Shanghai. In my estimate, I use a 48 percent share of the national total for Shanghai and add another 17 percent for Jiangsu and Zhejiang provinces to sum up to 0.65 for the Jiang-Zhe share of financial services. See Appendix Table 4.
TOTAL CAPITAL OF NATIVE BANKS (QIANZHANG AND NINHAO) AND PAWN SHOPS

Source:
Ou et al., Zhongguo Guomin Suode, vol. 2, p. 275, for native banks and p. 276 for pawn shops.
Utilities
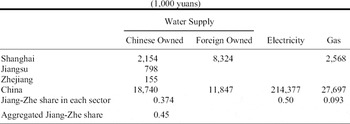
The utilities share of Jiang-Zhe, 0.57, is calculated as the average of water, electricity and gas weighted by the gross value of each sector in China's total output. The steps of calculation are shown in Appendix Table 5.
GROSS OUTPUT VALUES OF UTILITIES

Source Notes:
Gross value of water supply is from Ou et al., Zhongguo Guomin Suode, vol. 2, pp. 68–70, gas is from ibid., pp. 65–68. Ou et al.'s book does not have separate provincial level data for electricity. I use his gross value data (ibid., vol. 2, p. 70) and calculate from Shenbao Nianjian (p. 569) the share of Jiangsu and Zhejiang in China's total as equal to 0.46. As the Shenbao figure does not include electricity generated by factories, I round the figure up to 0.5.
Modern Transportation and Communication
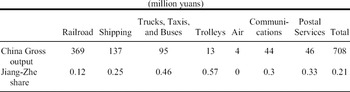
Appendix Table 6 presents both China's gross value output of transportation and communication services for seven sectors from Liu and Yeh, Economy, p. 590. The derivation of Jiang-Zhe share in national total for these seven sectors is presented in the detailed footnotes to Appendix Table 6. Multiplying these individual sectoral shares with the weights derived from the gross value output, I obtain the sectoral share weighted Lower Yangzi share of 21 percent in the national total.
GROSS VALUE OUTPUT

Notes:
For railroads, Ou et al. (Zhongguo Guomin Suode, vol. 2. table 3, p. 189) has gross income for all the railroads. The share of Jiang-Zhe in the national railway income is about 14 percent. However, some of the railroads covered mileage outside Jiang-Zhe. In this case, I give 12 percent for the Jiang-Zhe share to equalize it with its population share.
For shipping, I used the number of junks (Minchuan) in Jiang-Zhe as a proxy for their gross value. Jiang-Zhe had about a 22 percent share (Ou et al, ibid., p.181). For steam ships, I used gross receipts of shipping companies located in the Jiang-Zhe. There were two major shipping companies (Minshen and Zaosanqu) which plied the entire Lower Yangzi river but with a significant share in Jiang-Zhe. Including them in Jiang-Zhe would give a Jiang-Zhe share of 55 percent and excluding them would yield 28 percent, I take the intermediate number 40 percent (Ou et al., ibid., pp. 176–77). Averaging the ships and boats using their weights in total net value added gives a Jiang-Zhe share of 0.25 (weights equal to 0.86 for native boats and 0.14 for modern ships, calculated from Ou et al., vol.2, table 9, p.185).
For trucks, taxis, buses, I used the number of vehicles in the Jiang-Zhe provinces as a proxy for the share which is 46 percent (Ou et al., ibid., p. 202).
For Trolleys in the Jiang-Zhe provinces, they were only operating in Shanghai whose net income was about 57 percent of the national total (Ou et al., ibid., p. 202).
Air was very small. I just assumed it to be zero for Jiang-Zhe.
For modern communication, I calculate the NVD share of the Jiang-Zhe provinces for the two largest items, local phone and wire telegraph. They add up to over 70 percent of the net income for modern communication (Ou et al., ibid., table 18, p. 241). For local phone, the Jiang-Zhe share is 36 percent in gross income (Ou et al., ibid., table 10, p. 235) and for wire telegraph, the share is 24 percent (Ou et al., ibid., table 8, p. 232). The weighted average is 30 percent (weights for phone and telegraph are 0.39 and 0.61 respectively). Ou et al.'s provincial data for phone and telegraph did not include Manchuria. I use Ou et al.'s table 18 (ibid., p. 241) to calculate Manchuria share being 28 percent. So the China total for both phone and telegraph in Ou et al.'s data was multiplied by 1.28.
The Postal Services share for the Jiang-Zhe share in net income is calculated as 33 percent (Ou et al., ibid., table 2, p. 245).
Trade (Commerce)
Ou et al.'s calculation (Zhongguo Guomin Suode, vol. 2, pp. 247–58) is based on the total number of retail stores and restaurants and the peddlers. Based on Ou et al.'s data, I calculate that the number of stores (and restaurants) per 1,000 in Jiang-Zhe equal to 2.7 times that of China. Multiplying 2.7 to 0.12 (the L.Y. population share) gives 32 percent for the L.Y. share.
For peddlers, there is no good national survey. Ou et al.'s calculation is based largely on the Jiangsu data (Ou et al., Zhongguo Guomin Suode, vol. 1, pp. 107–08). I just assume here the Jiang-Zhe share here is equal to its population share of 0.12. Averaging the two sums by value added weights gives a final Jiang-Zhe share of 28 percent (the value-added weights for stores and peddlers are 0.79 and 0.21 respectively, Ou et al., Zhongguo Guomin Suode, vol. 1, pp. 106 and 107).
Government Administration
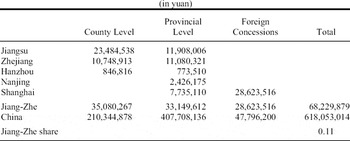
Appendix 6 in Ou et al., Zhongguo Guomin Suode, vol. 2, pp. 277–96, has provincial level government administration expenses for counties, provinces, central government, and foreign concessions. Appendix Table 7 shows that government administration expenses (excluding the central government) in Jiang-Zhe are about 11 percent of the total. With the capital located in Nanjing city, I round the Jiang-Zhe share to be 12 percent. The central government expenses are equal to 484,525,780 with almost three-fourth of it spent on military expenditures (p. 294).
GOVERNMENT EXPENDITURES IN THE JIANG-ZHE PROVINCES

Source:
County- and provincial-level and foreign concessions data from Ou et al., Zhongguo Guomin Suode, vol. 2, pp. 287, 292, and 295, respectively.
Construction
For Construction, Ou et al. defined it as the building and repair of residential and business housing, factories, canals and rivers, railroads, roads, ports, and transportation infrastructure (Zhongguo Guomin Suode, vol. 1, p. 77). Unfortunately, there were no provincial-level data in Ou et al.'s volume. The national data was based on the amount of construction materials used such as stone, cement, lime, bricks, iron and steel, and lumber. Considering the Jiang-Zhe provinces had a share of 57 percent in modern factories and 21 percent in handicraft production, the products of which correlate highly with these construction materials, I assign a rather conservative share of 30 percent for construction in the Jiang-Zhe provinces.
Old-Fashioned Transportation, Personal Services, Residential Rents
There are no regional data on these three sectors, I used 0.24, a number that is about the simple average of Jiang-Zhe shares in trade and modern transportation communication and twice the national per capita average.