





1. Introduction
Turbulent liquid flows often involve a free surface as an upper boundary; consider, for instance, the ocean upper layer separated from the atmosphere by the air–sea interface, or the surface in liquid mixing vessels used in many industrial processes. To understand the flow physics common to such situations, it is useful to consider the archetypical case in which the free surface bounds an otherwise homogeneous and isotropic region of zero-mean-flow turbulence. While this has been extensively investigated, our understating of this fundamental and highly relevant class of flows is still incomplete. With no ambition to provide a full account of the literature, below we briefly describe the problem, summarize the picture painted by some key studies and single out important open questions that motivate the present work.
1.1. Description of the problem
So long as gravity or surface tensions keeps the deformation of the surface to a minimum, the surface-normal (vertical) motions vanish approaching the surface. For this reason, many aspects of the situation resemble zero-mean-flow turbulence adjacent to a solid boundary (Perot & Moin Reference Perot and Moin1995). Unlike a solid wall, however, a clean free surface imposes a shear-free boundary condition at the surface, which allows surface-parallel (horizontal) velocities to persist. In their hallmark study, Hunt & Graham (Reference Hunt and Graham1978) invoked rapid distortion theory (RDT) to predict the behaviour of an otherwise homogeneous isotropic turbulent flow adjacent to a flat plate. Their analysis, as well as several successive studies (e.g. Brumley & Jirka Reference Brumley and Jirka1987; Shen et al. Reference Shen, Zhang, Yue and Triantafyllou1999; Teixeira & Belcher Reference Teixeira and Belcher2002; Magnaudet Reference Magnaudet2003), distinguished between two layers beneath the surface  $z=0$ (where
 $z$ is the vertical upward coordinate).
The so-called source layer or blockage layer, extending to a depth  $z\sim -L_\infty$ (where
 $L_\infty$ is the integral scale of the turbulence far from the surface) represents the region in which the kinematic (no-penetration) boundary condition is felt. In this region, the contribution to turbulent kinetic energy (TKE) from vertical velocity fluctuations,
 $\overline {u_z^2}$, with overlines denoting averages in time, decays to zero. As upwards-moving fluid travels towards the surface through the source layer (upwellings or splats), the no-permeability condition induces an inter-component transfer of energy from vertical to horizontal motions and the contribution to TKE from horizontal velocity fluctuations,
 $\overline {u_x^2}$, is enhanced. This energy is partly transferred back to vertical TKE when regions of surface-tangential flow converge and are redirected downwards (downwellings or anti-splats); see Perot & Moin (Reference Perot and Moin1995). While TKE
 $\overline {\boldsymbol {u} \boldsymbol {\cdot } \boldsymbol {u}}$ is a scalar quantity, for simplicity from hereon we refer to
 $\overline {u_x^2} \approx \overline {u_y^2}$ and
 $\overline {u_z^2}$ as horizontal and vertical TKE, respectively, and the re-partitioning of energy between
 $\overline {u_x^2}$ and
 $\overline {u_z^2}$ as inter-component energy transfer.
The dynamic boundary condition affects a shallower viscous layer,  $z>-\delta _\nu = -L_\infty {Re}_{T}^{-1/2}$, where the velocity gradients are modified to satisfy the zero-shear-stress condition at the surface. The problem is parametrized with the bulk Reynolds number
 \begin{equation} {Re}_{T}= \frac{2 u'_\infty L_\infty}{\nu}, \end{equation}
where  $\nu$ is the fluid kinematic viscosity. Here, and in the following, the prime indicates the root mean square (r.m.s.) of the fluctuations around the mean and the subscript
 $\infty$ indicates quantities averaged over the homogeneous bulk. With a purely flat surface and shear-free interface,
 ${Re}_{T}$ fully defines the problem when the turbulence in the bulk is homogeneous and isotropic and its spatial decay (absent surface-induced effects) is negligible. In practice, the surface is deformable to the extent that gravity and surface tension cannot suppress turbulent fluctuations. We will focus on regimes in which the effect of surface deformation on the flow is small.
1.2. Previous studies
Early experiments investigated the interaction of turbulence with a solid boundary imposing no mean shear on the flow. Uzkan & Reynolds (Reference Uzkan and Reynolds1967) and Thomas & Hancock (Reference Thomas and Hancock1977) considered grid turbulence interacting with a flow-parallel wall travelling at the fluid's mean velocity, finding an increase in the horizontal TKE at the expense of the vertical TKE near the surface. More recently, Johnson & Cowen (Reference Johnson and Cowen2018) investigated zero-mean-flow turbulence generated by a randomly actuated jet array opposite a solid wall, finding similar behaviour of the TKE partitioning. Those studies found that the depth of the layer influenced by the surface was  $O(L_\infty )$, in agreement with the prediction of Hunt & Graham (Reference Hunt and Graham1978).
Seminal experiments on zero-mean-flow turbulence below a free surface were conducted by Brumley & Jirka (Reference Brumley and Jirka1987) up to  ${Re}_{T} \sim 370$, who used an oscillating grid and observed an increase in horizontal TKE at the expense of vertical TKE as the surface was approached, in agreement with Hunt & Graham (Reference Hunt and Graham1978). Similar results were reported at much larger
 ${Re}_{T}$ by Variano & Cowen (Reference Variano and Cowen2013) using a random-jet-array system similar to that of Johnson & Cowen (Reference Johnson and Cowen2018). They additionally found a decrease of horizontal TKE just beneath the surface, which was attributed to unavoidable surface contamination by surfactants, inhibiting surface dilatational motions (Shen, Yue & Triantafyllou Reference Shen, Yue and Triantafyllou2004). Herlina & Jirka (Reference Herlina and Jirka2008), on the other hand, did not observe an increase in horizontal TKE, and attributed the disagreement with the Hunt & Graham (Reference Hunt and Graham1978) theory to its simplifying assumptions, in particular its inviscid nature.
Mechanisms controlling the TKE budget were analysed in the numerical study by Perot & Moin (Reference Perot and Moin1995), who considered various types of boundary conditions. Comparison with a solid wall boundary suggested that the extent of inter-component transfer of energy is due to the imbalance between up- and downwellings. Their simulations, as well as those by Guo & Shen (Reference Guo and Shen2010) and Herlina & Wissink (Reference Herlina and Wissink2019), suggested that upwellings are more energetic than downwellings, pointing to an important role of their imbalance in determining the free-surface flow dynamics. Numerical simulations by Walker, Leighton & Garza-Rios (Reference Walker, Leighton and Garza-Rios1996) and Teixeira & Belcher (Reference Teixeira and Belcher2002) highlighted how the dynamic boundary condition induces a smaller dissipation rate at the surface, while it does not significantly alter the surface-normal vorticity.
1.3. Open questions and motivation for the present study
The applicability of the Hunt & Graham (Reference Hunt and Graham1978) theory to sub-surface turbulence was debated in several experimental, numerical and theoretical studies, as reviewed in Magnaudet (Reference Magnaudet2003). While there is substantial evidence that such a theory is in qualitative agreement with the observations, quantitative comparisons have been limited, in particular concerning its predictions on the gradients and correlation scales in the near-surface region. Verification of the theory has been complicated by the way sub-surface turbulence is introduced. In some configurations, this is forced several integral length scales away from the free surface, and any effect of the latter is superimposed on the spatial decay of the turbulence (e.g. Walker et al. Reference Walker, Leighton and Garza-Rios1996). In others, homogeneous turbulence is generated as an initial condition before the surface is suddenly introduced, yielding an inherently transient behaviour (Perot & Moin Reference Perot and Moin1995). Moreover, as RDT is essentially inviscid, its predictions are expected to apply in the limit of high  ${Re}_{T}$. Systematic studies of Reynolds number effects, however, have not been conducted.
The presence of the surface profoundly transforms the nature of the turbulence in its immediate proximity. Already, Eckhardt & Schumacher (Reference Eckhardt and Schumacher2001) showed with numerical simulations that intermittency in the sub-surface velocity increases near the surface. Cressman et al. (Reference Cressman, Davoudi, Goldburg and Schumacher2004) paired these findings with experimental data showing that floating tracers disperse less rapidly than is the case in sub-surface turbulence, attributing this to the two-dimensionality imposed by the free-surface boundary condition. Perot & Moin (Reference Perot and Moin1995) similarly suggested that, along the surface, the two-dimensional (2-D) nature of the flow alters the direct energy cascade expected in three-dimensional (3-D) flows. While this view was supported by simulations of open-channel flows (Pan & Banerjee Reference Pan and Banerjee1995; Lovecchio, Zonta & Soldati Reference Lovecchio, Zonta and Soldati2015), the majority of studies on homogeneous turbulence under a free surface argued that the flow is essentially three-dimensional, in that the boundary condition does not impede vortex stretching and the associated down-scale energy transfer (Walker et al. Reference Walker, Leighton and Garza-Rios1996; Shen et al. Reference Shen, Zhang, Yue and Triantafyllou1999; Guo & Shen Reference Guo and Shen2010).
As mentioned, the complex sub-surface dynamics is heavily influenced by the balance between upwellings and downwellings. These act as building blocks of the near-surface flow, and their properties are critical to the renewal of the free surface (and thus the associated gas transfer) (Kermani & Shen Reference Kermani and Shen2009; Guo & Shen Reference Guo and Shen2010; Variano & Cowen Reference Variano and Cowen2013; Herlina & Wissink Reference Herlina and Wissink2014). Gas transfer rates have been directly linked to the free-surface divergence  $\beta =-\partial u_z / \partial z$ (with the velocity gradient evaluated at
 $z = 0$), whose sign and magnitude depends on the upwelling/downwelling state of the sub-surface flow (Jähne & Haußecker Reference Jähne and Haußecker1998; McKenna & McGillis Reference McKenna and McGillis2004; Turney & Banerjee Reference Turney and Banerjee2013). In particular, recent work (Babiker et al. Reference Babiker, Bjerkebæk, Xuan, Shen and Ellingsen2023) suggests that near-surface mixing can be quantified by observations of minuscule deformations to the surface; such an approach, clearly, requires an understanding of the connection between the characteristics of the surface divergence evidenced by the deformations and the turbulence. However, the spatial and velocity scales of upward and downward motions have been examined mostly in numerical studies at limited
 ${Re}_{T}$, and therefore their extent and strength in regimes relevant to environmental and industrial settings have not been established.
Motivated by these considerations, here we analyse the results of an extensive measurement campaign focused on the effects of a quasi-flat free surface on an otherwise homogeneous turbulent flow. Unlike previous studies, we consider a system in which high- ${Re}_{T}$ turbulence is steadily forced in the vicinity of the surface, minimizing spatial variations unrelated to the effect of the surface. By means of high-resolution particle image velocimetry (PIV) and laser-induced fluorescence (LIF), we characterize the turbulence structure from the bulk region to the free surface, resolving from the dissipative to the integral scales of the flow. The paper is organized as follows. In § 2, we present the experimental facility, the imaging methodology and the flow statistics that define the regime under consideration. In § 3, we analyse the structure and evolution of the turbulence between the bulk and the surface, systematically comparing our observations with RDT predictions and exploring the inter-scale energy transfer. In § 4, we focus on the respective roles of upwellings and downwellings in the transport of energy in space and across scales. We summarize the main findings and draw conclusions in § 5.
2. Experimental methodology and flow regime
2.1. Apparatus and measurement approach
The experimental apparatus is illustrated in figure 1(a). Turbulence is created in a  ${2}\ {\rm m}^{3}$ water tank by two opposing
 $8 \times 8$ arrays of submerged pumps. Within each array, the pumps are separated by 10 cm in the horizontal and vertical directions and intermittently emit turbulent jets according to the ‘sunbathing’ algorithm proposed by Variano & Cowen (Reference Variano and Cowen2013). The magnitude of the fluctuating velocity, and consequently the bulk Reynolds number
 ${Re}_{T}$, is changed by modulating the power supplied to each pump. This is controlled by programmable logic circuits, dictating a pulse-width-modulation scheme for each pump (Chan et al. Reference Chan, Blay Esteban, Huisman, Shrimpton and Ganapathisubramani2021). On average, 12.5 % of pumps are turned on at a given time and each jet emission lasts 3 s. The water level is approximately 5 cm above the axis of the jets in the top row of the array. The relatively small distance between the forcing region and the surface distinguishes the present set-up from the majority of previous experimental efforts, which employed oscillating grids or actuated jets placed several integral scales below the surface (e.g. Brumley & Jirka Reference Brumley and Jirka1987; McKenna & McGillis Reference McKenna and McGillis2004; Herlina & Jirka Reference Herlina and Jirka2008; Variano & Cowen Reference Variano and Cowen2008, Reference Variano and Cowen2013). Savelsberg & Van De Water (Reference Savelsberg and Van De Water2009) also forced turbulence close to the surface with an active grid in an open channel flow, but did not investigate the influence of the surface on the turbulence underneath. The surface tension of the water
 $\sigma$ is measured via a Du Noüy ring at various points in time, yielding no significant variations around the standard value of
 ${0.07}\ {\rm N}\ {\rm m}^{-1}$.
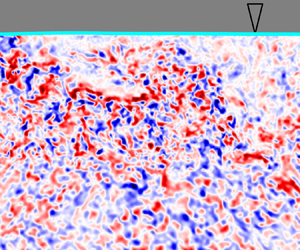
(a) The turbulence tank and imaging system. Pumps on either side of the tank emit jets of water (blue) randomly. The three PIV cameras coloured red, green and purple each resolve the fields of view indicated within the laser sheet (green). A fourth camera (coloured cyan) resolves the surface position using LIF. (b,c) Snapshots of the out-of-plane vorticity fields at the lowest and highest Reynolds numbers, respectively. As the Reynolds number increases, the magnitude of the vorticity increases and its spatial scale decreases.

The velocity field in the centre of the tank is measured by PIV. A 532 nm laser beam (Nd:YAG,  ${200}\ {\rm mJ}\ {\rm pulse}^{-1}$) is converted into a thin diverging sheet and shone vertically through the glass bottom surface of the tank, illuminating a region within the plane
 $y=0$ (see figure 1a). We denote with
 $x$ the horizontal direction parallel to the jet axes, and
 $z$ the vertical upwards direction, with the origin at the water surface. As is sketched in figure 1(a), three synchronized cameras (CMOS, 25 Megapixels) are used to image two side-by-side regions just below the surface, as well as a larger region beneath. The tracers are
 ${10}\ {\mathrm {\mu }}{\rm m}$ hollow glass sphere particles, and the inter-frame timing is varied with
 ${Re}_{T}$ to ensure their maximum typical displacement is approximately 5 pixels, optimal for zero-mean-flow turbulence facilities of this kind (Carter et al. Reference Carter, Petersen, Amili and Coletti2016). In total, the field of view resolved by the cameras extends approximately 20 cm in the horizontal direction and approximately 25 cm below the free surface, centred on the midpoint between the two arrays of pumps. Between 4000 and 6000 instantaneous velocity fields are obtained for each condition at a rate of 1 Hz using an iterative cross-correlation algorithm (Thielicke & Stamhuis Reference Thielicke and Stamhuis2014). Velocity components
 $U_x$ and
 $U_z$ from the three cameras are interpolated onto a uniform grid with spacing 0.53 mm, which is comparable to the vector spacing obtained with the higher-resolution cameras resolving the region just beneath the surface. Such vector spacing is the result of an interrogation window size of approximately 1 mm (which defines the PIV spatial resolution) followed by a standard 50 % overlap between adjacent windows. The PIV resolution deeper into the bulk is coarser, with an interrogation window size of approximately 2 mm.
A small amount (less than  $3\times 10^{-7}$ in volume) of uranine dye is added to the water to capture the instantaneous position of the water surface
 $\eta (x)$ by LIF. To this end, a fourth CMOS 25 megapixel camera synchronized with the laser pulse is outfitted with a band-stop filter to block the bright laser light and positioned above the water surface, angled down by approximately
 ${30}^{\circ }$. It captures the fluorescence of the dye, with the uppermost part of the bright region demarking the water surface position.
Snapshots of the vorticity field and surface position are shown in figures 1(b) and 1(c) at the lowest and highest Reynolds numbers investigated, respectively, highlighting the finer structures at the higher turbulence intensity. Animations of the vorticity fields from each case (recorded at a faster frame rate for the purpose of visualization) are provided as a supplementary movie available at https://doi.org/10.1017/jfm.2024.1017.
2.2. Turbulence properties in the bulk
The turbulence statistics are impacted by the presence of the free surface within approximately one bulk longitudinal integral scale  $L_\infty$ from the free surface (Hunt & Graham Reference Hunt and Graham1978). As described below,
 $L_\infty \approx {10}\ {\rm cm}$; as such, in this section we show results spatially averaged over
 $z< {-15}\ {\rm cm}$, where the flow statistics vary marginally with depth.
In both the horizontal (surface-parallel) direction ( $i = x$) and the vertical (surface-normal) direction (
 $i = z$), the turbulent velocity field is Reynolds decomposed as
 $U_i (x,z,t)= \overline {U_i} (x,z) + u_i (x,z,t)$, where
 $\overline {U_i}$ is the local mean and
 $u_i$ is the instantaneous fluctuation. Figure 2(a) shows the components of the fluctuating velocity in the bulk,
 $u'_{i,\infty }$, for each case, displaying a level of large-scale anisotropy typical of similar set-ups (Esteban, Shrimpton & Ganapathisubramani Reference Esteban, Shrimpton and Ganapathisubramani2019).
Conditions in the bulk at each Reynolds number: (a) the components of the r.m.s. velocity fluctuations and (b) the longitudinal and transverse integral length scales.

The four available components of the spatial autocorrelation tensor can be calculated as
 \begin{equation} \rho_i^s{(r)} = \frac{ \overline{u_i(\boldsymbol{x}) u_i(\boldsymbol{x} + r \boldsymbol{e}_{i,s})} }{u'_i(\boldsymbol{x})^2}, \end{equation}
where  $s$ signifies whether a longitudinal (
 $s={L}$) or transverse (
 $s={T}$) correlation is considered and
 $i$ signifies the component (
 $x$ or
 $z$) of the velocity considered. Thus,
 $\boldsymbol {e}_{i,{L}} = \boldsymbol {e}_i$ in order to obtain a longitudinal correlation, and
 $\boldsymbol {e}_{i,{T}}$ is orthogonal to
 $\boldsymbol {e}_i$ in order to obtain a transverse one (specifically, using
 $\boldsymbol {e}_{x,{T}}=-\boldsymbol {e}_z$ and
 $\boldsymbol {e}_{z,{T}}= \boldsymbol {e}_x$). Horizontal homogeneity warrants independence from the generic position
 $\boldsymbol {x}$ in the measurement plane and enables replacing
 $\boldsymbol {e}_x$ with
 $-\boldsymbol {e}_x$.
Figure 2(b) shows the four integral length scales in the bulk,  $L_{i,\infty }^s$, at each Reynolds number, found by identifying the
 $1/e$ crossing of the corresponding component of (2.1) (or with integration in the case of
 $L_{z,\infty }^{T}$, given its quick convergence). As these length scales are associated with the width attained by the jets in the homogeneous turbulence region at the centre of the tank, they are weakly sensitive to the power supplied to the pumps (Carter et al. Reference Carter, Petersen, Amili and Coletti2016). To more easily assess the isotropy, the integral scales based on the transverse autocorrelations are shown multiplied by two according to the relation for homogeneous isotropic turbulence,
 $L_{i,\infty }^{L} = 2 L_{i,\infty }^{T}$ (Pope Reference Pope2000). The jet-driven forcing causes the horizontal velocity fluctuations to remain correlated over larger distances (both longitudinal and transverse) compared with the vertical fluctuations (Carter & Coletti Reference Carter and Coletti2017; Esteban et al. Reference Esteban, Shrimpton and Ganapathisubramani2019).
Additional PIV measurements are performed along a horizontal plane at  $z={-20}\ {\rm cm}$, using similar hardware and achieving similar resolution as in the near-surface vertical planes. Figure 2(a) shows, with the dashed lines, the values of
 $u'_{x,\infty }$ and
 $u'_{y,\infty }$ calculated from the 2000 snapshots per condition taken during these measurements; comparison between
 $u'_{y,\infty }$ and
 $u'_{z,\infty }$ confirms that velocity statistics in the
 $y$-direction are quantitatively similar to those in the
 $z$-direction far from the surface. Given the similarity of the velocity statistics in these two directions, for some statistical vectorial quantity
 $p_i$ in the bulk we assume
 $p_y \approx p_z$ and define a characteristic scalar value as
 \begin{equation} p = \sqrt{\frac{p_x^2 + 2 p_z^2}{3}}. \end{equation}
At the present levels of anisotropy, alternative strategies of directional averaging (such as taking an algebraic average or neglecting the anisotropy altogether) yield marginally different values (Carter et al. Reference Carter, Petersen, Amili and Coletti2016).
We further compute the  $n$th-order structure function as
 \begin{equation} D_{n,i}^s (r,z) = \overline{ \left( u_i(\boldsymbol{x}+r \boldsymbol{e}_{i,s}) - u_i (\boldsymbol{x}) \right)^n }, \end{equation}
with  $s$ used as in (2.1). The second-order structure functions based on horizontal separations in the bulk are shown in figure 3, comparing with Kolmogorov (Reference Kolmogorov1941) predictions in the inertial sub-range,
 $D_{2,x,\infty }^{L} = C_2 (\epsilon _\infty r)^{2/3}$ and
 $D_{2,{z},\infty }^{T} = (4/3) C_2 (\epsilon _\infty r)^{2/3}$, with
 $\epsilon _\infty =0.5 u^{'3}_{\infty} /L_\infty$ and
 $C_2=2.0$, which holds for the present range of Reynolds numbers (Burattini, Lavoie & Antonia Reference Burattini, Lavoie and Antonia2005; Carter et al. Reference Carter, Petersen, Amili and Coletti2016; Carter & Coletti Reference Carter and Coletti2017; Carter et al. Reference Carter, Hassaini, Eshraghi, Vlachos and Coletti2020). The Kolmogorov scale in the bulk,
 $l_{K}=(\nu ^3/\epsilon _\infty )^{1/4}$, is marked in the abscissa of each plot. The curves exhibit the scaling
 $D_2 \propto r^2$ in the dissipation range, suggesting that the fine scales of the flow are appropriately captured.
Longitudinal (a) and transverse (b) structure functions for horizontal separations in the bulk for each Reynolds number. Solid thick lines give the inertial range scaling given  $\epsilon _\infty$, and dotted lines give the
 $\propto r^2$ scaling.

Table 1 summarizes the main properties of the turbulence in the bulk for the considered cases. As confirmed by figure 3, for all cases the Taylor-scale Reynolds number  ${Re}_\lambda =L_{\lambda,\infty } u'_\infty /\nu$ (with
 $L_{\lambda,\infty }=u'_\infty \sqrt {15\nu /\epsilon _\infty }$ the Taylor length scale) is sufficiently large to develop an inertial sub-range. The Kolmogorov scales are under-resolved by PIV in the most intense turbulence, but this will not affect the conclusions. For comparison, the bulk turbulence properties of selected previous experimental studies are also listed.
Properties of the turbulence in the bulk with the forcing conditions employed. Values from selected previous experimental studies are also listed. When not reported, the properties in those studies are deduced from the presented information.

Compared with oscillating-grid systems featured in most previous experimental studies of sub-surface turbulence, the present set-up produces substantially smaller mean recirculation and inhomogeneities over a larger region (McKenna & McGillis Reference McKenna and McGillis2004; Blum et al. Reference Blum, Kunwar, Johnson and Voth2010; Bellani & Variano Reference Bellani and Variano2014; Carter et al. Reference Carter, Petersen, Amili and Coletti2016). Various metrics to characterize the approximation to zero-mean-flow homogeneous turbulence are presented in figure 4. In particular, following Carter et al. (Reference Carter, Petersen, Amili and Coletti2016) and Esteban et al. (Reference Esteban, Shrimpton and Ganapathisubramani2019), we calculate: the mean-flow factor, which is the magnitude of the mean flow relative to the turbulent fluctuations; the normalized Reynolds shear stress ( $\overline {u_x u_z}$), which is 0 in isotropic turbulence; and the mean strain-rate factor, which compares the strain rate of the mean flow and the turbulent strain rates. These quantities are defined with
 $$\begin{gather} \textrm{mean-flow factor} = \frac{\sqrt{\overline{U_x}^2 + 2 \overline{U_z}^2}}{ \sqrt{ {u'_x}^2 + 2 {u'_z}^2 }}, \end{gather}$$
 $$\begin{gather}\textrm{normalized Reynolds shear stress} = \frac{| \overline{u_x u_z} | }{ \overline{u_x^2} + 2\overline{u_z^2}}, \end{gather}$$
 $$\begin{gather}\textrm{mean strain-rate factor} = \frac{\sqrt{(\partial \overline{U_x} / \partial x)^2 + 2 (\partial \overline{U_z} / \partial z)^2}} { \sqrt{ \overline{(\partial u_x / \partial x)^2} + 2\overline{(\partial u_z / \partial z)^2} }}, \end{gather}$$
with all quantities first computed locally and then spatially averaged over the bulk region  $z<{-15}\ {\rm cm}$. The latter quantity is especially important to distinguish the canonical case of homogeneous turbulence from situations in which mean velocity gradients are significant (as in open-channel flows and shallow riverine environments, Nezu & Nakagawa Reference Nezu and Nakagawa1993). Further, we quantify the homogeneity deviation throughout the bulk region by dividing the standard deviation of the local values of
 $u'$ by the characteristic
 $u'_\infty$ (i.e. the average of all such local
 $u'$ values),
 \begin{equation} \textrm{homogeneity deviation} = \mathrm{std}(u')_\infty / u'_\infty. \end{equation}

We find values of the  $\textrm {mean strain-rate factor} < 0.02$, indicating that nearly all the dissipation occurring is turbulent, the
 $\textrm {homogeneity deviation} < 0.05$, indicating good spatial homogeneity, and the
 $\textrm {normalized Reynolds shear stress} < 0.03$. With the exception of the lowest
 ${Re}_{T}$ case, the mean flow is also relatively weak,
 $\mathrm {MFF} < 0.2$. It is worth stressing that those qualities, in particular homogeneity, are obtained over a region larger than the integral scale of the turbulence, which is essential for establishing the natural energy cascade (Bellani & Variano Reference Bellani and Variano2014; Carter et al. Reference Carter, Petersen, Amili and Coletti2016).
2.3. Free-surface deformation
Figure 5(a) shows probability density functions (p.d.f.s) of the surface elevation  $\eta$ obtained by LIF for each condition. The scale of the surface disturbances, estimated as
 $2\eta '$, increases with
 ${Re}_{T}$ and is limited to approximately 3 mm in the most intense turbulence. Further, figure 5(b) plots the bulk Weber number
 ${We}_\infty = \rho u^{'2}_{\infty } L_\infty / \sigma$ and the bulk Froude number
 ${Fr}_\infty =u'_\infty /\sqrt {g L_\infty }$ (with
 $g$ the gravitational acceleration), which characterize the ability of the large-scale turbulent motions to deform the surface against the restoring action of surface tension and gravity, respectively. Even at the larger
 ${Re}_{T}$, while turbulence is strong enough to counteract surface tension (
 ${We}_\infty > 1$), the large spatial scales guarantee
 ${Fr}_\infty < 1$. In this regime of ‘gravity-dominated turbulence’ (Brocchini & Peregrine Reference Brocchini and Peregrine2001b), the surface is expected to display small deformations, coherent with the distributions shown in figure 5(a).
Deformations to the free surface. (a) Distributions of the surface elevation at each condition. (b) Weber and Froude numbers calculated with values from the bulk at each condition.

In § 3.1 we show that, below a thin near-surface layer barely resolved by the imaging system, the orbital velocities induced by gravity–capillary waves are small compared with the turbulent velocities we measure. Nonetheless, the surface information obtained from the LIF images is critical in the experimental data processing, as it enables us to mask out the noisy region of the PIV images above the surface.
3. Turbulence modulation by the free surface
3.1. Vertical fluctuations
Consistent with previous works, we observe marked changes in the statistics of the turbulence within the blockage layer,  $z>-L_\infty$. Figure 6(a) shows a snapshot of the normalized vertical velocity fluctuation field,
 $u_z/u'_{z,\infty }$, at
 ${Re}_{T}=12\,400$. Here and in the rest of the paper, when results are shown for only one case, this
 ${Re}_{T}$ will be used as representative unless otherwise specified. Near the surface, the magnitude of vertical fluctuations decays, as does the horizontal length scale of the vertical velocity structures. This is evident in figure 6(b), which shows the vertical profiles of
 $u'_z(z)/u'_{z,\infty }$ and
 $L_z^{T}(z) / L_{z,\infty}^{T}$, both quantities decreasing by an order of magnitude across the source layer. The increase of
 $L_z^{T}$ for
 $z > -0.01 L_\infty$ signals the presence of the viscous sublayer and possibly the influence of surface deformation, as described below.
Structure of the vertical velocity fluctuations. (a) Vertical velocity field at one instant in time. (b) Profiles of the vertical fluctuation velocity scale (solid line) and horizontal correlation length of vertical velocity (dashed line) as functions of depth, normalized by their values in the bulk.

The decay of the vertical velocity fluctuation is shown for all turbulence intensities in figure 7(a). With increasing  ${Re}_{T}$ the trends agree increasingly well with the RDT prediction of Hunt & Graham (Reference Hunt and Graham1978), in particular displaying the scaling
 $u'_z / u'_{z,\infty } \propto (-z/L_\infty )^{1/3}$. (For this and the following comparisons with their results, we numerically calculate the one-dimensional single-point energy spectra in the source layer according to their (2.53)–(2.55), employing the von Kármán spectrum in their (2.63).) This provides strong evidence that the applicability of RDT depends on the turbulence Reynolds number (Magnaudet Reference Magnaudet2003).
Decay of the velocity fluctuation scale within the source layer. (a) The vertical velocity fluctuation scale, normalized by its value in the bulk, as a function of depth, normalized by the integral scale in the bulk, for each  ${Re}_{T}$. The dashed line shows the prediction of RDT (Hunt & Graham Reference Hunt and Graham1978). (b–d) The dimensionless positions of the viscous sublayer, intermittency layer and
 $-z_{orb}$, the depth above which the modelled orbital velocity scale exceeds the measured vertical velocity scale.

Beside  ${Re}_{T}$ effects, other factors contribute to the deviation from the power-law relation very close to the surface. First, turbulence statistics change within the viscous sublayer, whose depth is marked in figure 7(b) using the estimate
 $\delta _\nu = {Re}_{T}^{-1/2} L_\infty$ (Brumley & Jirka Reference Brumley and Jirka1987). Second, surface deformation results in a so-called ‘intermittency layer’ over which the surface elevation varies in time and space. Following Guo & Shen (Reference Guo and Shen2010), we define this layer as extending to a depth
 $2 \eta '$ below the mean water level, marked in figure 7(c). Third, small surface undulations generated by the flow propagate along the surface as capillary–gravity waves (as evidenced by temporally resolved measurements of
 $\eta (x,y)$, not reported here, which will be the focus of later work), which induce an irrotational orbital velocity
 $\boldsymbol{u}_{orb}$. To gauge the depth
 $-z_{orb}$ over which this is comparable to the turbulent fluctuations, we compute it in a manner inspired by Thais & Magnaudet (Reference Thais and Magnaudet1995). Briefly, each instantaneous surface elevation field is represented by its spatial Fourier transform, and the contribution of each mode to the sub-surface velocity field is computed according to linear wave theory and the gravity–capillary dispersion relation. We define the depth
 $-z_{orb}$ (shown in figure 7d) as the height below which
 $u'_z(z) > {u'}_{{orb},z}(z)$. For the representative case
 ${Re}_{T}=12\,400$, all three types of near-surface layers have thickness
 $O(10^{-2} L_\infty )$. In figure 7(a) and in the rest of the paper, we display data at
 $z < -2\eta '$, which does not affect our conclusions.
The constraint imposed by the surface on the vertical motions is also manifested in their horizontal structure. This is evident in figure 8(a), in which the transverse structure functions  $D_{2,z}^{T}$ are plotted at various depths. The circles denote values for
 $r=-z$, i.e. horizontal separations equal to the depth at which
 $D_{2,z}^{T}$ is calculated. At all depths, the turbulence approximately retains the structure of the bulk at scales
 $r \leqslant |-z|$, while the magnitude of the vertical velocity fluctuations is reduced at larger separation. This behaviour is faithfully captured by the Hunt & Graham (Reference Hunt and Graham1978) theory, according to which the transverse spectrum of the vertical velocity component (which carries the same information as
 $D_{2,z}^{T}$) is reduced and flattened at wavenumbers below
 $|{z}|^{-1}$.
The spatial structure of vertical motions near the surface. The transverse structure functions (a) and transverse spatial autocorrelations (b) of vertical velocity for various depths with  ${Re}_{T} = {12\,400}$. The grey curves give the corresponding values in the bulk. (c) The transverse integral length scale, giving the horizontal footprint of vertical motions, as functions of depth for each Reynolds number. The dashed red curve gives the RDT predictions of Hunt & Graham (Reference Hunt and Graham1978), multiplied by
 $L_{z,\infty }^{T} / (L_\infty /2)$ as a first-order accounting of the anisotropy in the bulk.

The above suggests that, near the surface, the vertical velocity fluctuations are weakly correlated beyond horizontal scales comparable to the local depth. This is confirmed by figure 8(b), where the data are recast in the form of transverse autocorrelations  $\rho _z^{T}$. Those decay faster approaching the surface, which corresponds to the decreased
 $L_z^\mathrm {T}$ shown for all Reynolds numbers in figure 8(c). These compare favourably with the prediction of Hunt & Graham (Reference Hunt and Graham1978), shown as the dashed red line.
3.2. Horizontal fluctuations
Rapid distortion theory predicts an increase in energy in horizontal motions at the expense of that in vertical motions. This has been observed in several experiments on zero-mean-shear flows adjacent to solid boundaries (Thomas & Hancock Reference Thomas and Hancock1977; Johnson & Cowen Reference Johnson and Cowen2018) and free-surface turbulence simulations (Guo & Shen Reference Guo and Shen2010; Herlina & Wissink Reference Herlina and Wissink2014; Flores, Riley & Horner-Devine Reference Flores, Riley and Horner-Devine2017; Herlina & Wissink Reference Herlina and Wissink2019) and experiments (Brumley & Jirka Reference Brumley and Jirka1987; Variano & Cowen Reference Variano and Cowen2013). It was not observed, however, in the long-time statistics of the decaying turbulence simulations by Perot & Moin (Reference Perot and Moin1995) nor in the experiments by Aronson, Johansson & Löfdahl (Reference Aronson, Johansson and Löfdahl1997) and by Herlina & Jirka (Reference Herlina and Jirka2008). We hypothesize that the disagreement is due to study-specific characteristics of the bulk turbulence. On one hand, the inviscid RDT analysis assumes a high Reynolds number, which complicated the comparison, especially with early simulations. According to Magnaudet (Reference Magnaudet2003), the relatively low  ${Re}_{T}$ (resulting in the viscous layer accounting for a significant fraction of the integral scale) was the reason Perot & Moin (Reference Perot and Moin1995) did not observe a near-surface peak of
 $u_x'{(z)}$ at late times of their decaying turbulence simulations. On the other hand, as mentioned, most experimental studies have applied the forcing to generate the turbulence at distances from the surface much larger than
 $L_\infty$ (e.g. McKenna & McGillis Reference McKenna and McGillis2004; Variano & Cowen Reference Variano and Cowen2013). In those systems, any change of turbulent energy approaching the surface is superposed on the spatial decay away from the forcing region. Finally, the ideal conditions of bulk homogeneity, isotropy and zero mean shear cannot be fully achieved in experiments, possibly clouding the effect of the surface.
In the present set-up, the distance between the water surface and the axis of the upper-most jets forcing the turbulence is  $O(L_\infty )$; thus, the natural spatial decay of energy between the forcing region and the surface is expected to be marginal. Moreover, we are able to assess the influence of the Reynolds number by spanning almost a decade in
 ${Re}_{T}$. Figure 9(a) shows profiles of
 $u'_x$, indicating how the horizontal energy increase emerges at
 ${Re}_{T} > \sim 10\,000$, while for weaker forcing it is obscured by spatial inhomogeneities. We remark that this cannot be taken as a general threshold, due to the abovementioned difficulty of comparing different systems. In fact, near-surface amplification of
 $u'_x$ has been reported in experiments at
 ${Re}_{T} < 1000$ by Brumley & Jirka (Reference Brumley and Jirka1987), although with significant scatter.
The change in the horizontal velocity fluctuation scale near the surface. (a) Profiles of horizontal r.m.s. velocity fluctuations as functions of depth for each condition, where the dashed line shows the value in the bulk. (b) The same data for the highest- ${Re}_{T}$ case, non-dimensionalized and compared with the amplification predicted by RDT (red, dashed line).

Figure 9(b) displays the vertical profiles of  $u'_x/u'_{x,\infty }$ for the highest Reynolds number,
 ${Re}_{T} = {22\,800}$, along with the theory of Hunt & Graham (Reference Hunt and Graham1978). The amplification of horizontal energy in our experiments occurs over a greater depth, but the peak is in close agreement with the prediction,
 $u'_x/u'_{x,\infty } = \sqrt {3/2}$. This is significantly lower than what was observed in numerical studies (Walker et al. Reference Walker, Leighton and Garza-Rios1996; Guo & Shen Reference Guo and Shen2010), and at least two factors may be responsible. First, in our experiments
 $u'_x$ decreases in the immediate vicinity of the surface due to the small amount of surfactant (which is practically unavoidable in such configurations Variano & Cowen Reference Variano and Cowen2013). Thus, the peak might be higher in the limit of perfectly clean water. Second, numerical simulations have been conducted at much lower
 ${Re}_{T}$. For reference, Guo & Shen (Reference Guo and Shen2010) considered
 ${Re}_{T} =123$, while the most massive simulations to date for this configuration are the ones of Herlina & Wissink (Reference Herlina and Wissink2019) at
 ${Re}_{T} = 1856$.
Having confirmed that, for sufficiently intense turbulence, the horizontal TKE is augmented in the source layer, we explore its scale-to-scale distribution. This is characterized by the horizontal energy density
 \begin{equation} {E_x (r, z)= \frac{\partial}{\partial r} \left( D_{2,x}^{L}(r, z) \right),} \end{equation}
which is the scale-space analogue of the energy spectrum at depth  $z$ (in that
 $E_x(r,z) \Delta r$ represents the contributions to the horizontal TKE from structures with size between
 $r$ and
 $r+\Delta r$). Figure 10(a) shows
 $E_x(r,z)$ at the same depths for which the transverse structure functions are shown in figure 8(a). It is apparent that the spectrum of horizontal energy exceeds the Kolmogorov scaling
 $E_x \propto r^{-1/3}$ for
 $r > -z$. Thus, the comparison with figure 8(a) demonstrates how both the augmentation of horizontal energy and the attenuation of vertical energy occur for scales exceeding the local depth. It is notable that the large-scale
 $E_x (r)$ amplification is evident at all considered
 ${Re}_{T}$ – even those for which figure 9(a) shows no appreciable amplification of
 $u'_x(z)$ near the surface.
Structure of surface-parallel velocity. (a) The energy density (the radial derivative of the second-order longitudinal structure function) normalized by its value at  $r = 0.03 L_\infty$. This normalization accounts for the inhomogeneous forcing with depth: such inhomogeneities impact the energy density at all scales, while the surface-induced changes occur solely at scales larger than the local depth. Curves are shown for various
 $z$, indicating the increased energy density for large scales
 $r > -z$. The dashed line shows the Kolmogorov scaling. (b) The longitudinal autocorrelation at various depths. Note that the spatial separations on the horizontal axis are normalized by the characteristic integral scale
 $L_\infty$ which is shorter than
 $L^L_{x,\infty}$ due to the anisotropies in the bulk. (c) The longitudinal integral scale normalized by its bulk value for each Reynolds number as a function of depth. The dashed red line gives the predictions of RDT (Hunt & Graham Reference Hunt and Graham1978), showing that the near-surface amplification we observe experimentally is not captured by this theory.

The amplification of horizontal energy at the large scales results in a significant increase in the surface-parallel footprint of the near-surface  $u_x$ structures. This is demonstrated by the longitudinal autocorrelations
 $\rho _x^{L}$ in figure 10(b), which decay more slowly as the surface is approached and result in the evolution of the integral scale
 $L_x^{L} (z)$ in figure 10(c). While there is uncertainty due to the limited range over which the employed exponential fit to the autocorrelations can be performed, there is a substantial increase throughout the source layer, especially at the larger
 ${Re}_{T}$. That is in stark contrast with the theory of Hunt & Graham (Reference Hunt and Graham1978), which predicts a decrease of the correlation length, following
 $L_x^{L} / L_{x,\infty }^{L} = ({u'_x}^2 / u^{'2}_{x,\infty })^{-1}$. Herlina & Wissink (Reference Herlina and Wissink2014) also observed an increase of
 $L_x^{L}$ approaching the surface, attributing it to the growth of the integral scale as the turbulence decays away from the forcing region (Pope Reference Pope2000; Davidson Reference Davidson2004). This explanation is less convincing here, as the forcing is applied throughout the sub-surface volume. An alternative explanation is to be found in the way the surface affects the inter-scale transfer of energy, which is discussed in § 3.4.
3.3. Velocity gradients
The free surface modifies the velocity gradients due to both the kinematic and the dynamic boundary conditions. In figure 11(a), we plot vertical profiles of the r.m.s. fluctuations for the measured components of the velocity gradients. Here, we consider the data for the lowest Reynolds number,  ${Re}_{T} = 3000$, for which the velocity gradients are best resolved by PIV. The values in the bulk approximately follow the relations for homogeneous isotropic turbulence,
 $(\partial u_x / \partial {x})' = (\partial u_z / \partial z)' = \sqrt {2} (\partial u_x / \partial z)' = \sqrt {2} (\partial u_z / \partial x)'$ (Monin & Yaglom Reference Monin and Yaglom1975). Despite the forcing being applied relatively close to the surface, the r.m.s. velocity gradients still display a weak decay away from the bulk. This is consistent with the fact that small-scale quantities decay faster than large-scale ones, according to established relations for freely decaying turbulence:
 $\overline {u_i^2} \sim \zeta ^{-m}$ and
 $\overline {(\partial u_i / \partial x_j)^2} \sim \zeta ^{-(m+1)}$, where
 $\zeta$ is the distance from the virtual origin of the forcing and
 $m = 1{-}1.4$ (Hearst & Lavoie Reference Hearst and Lavoie2014; Sinhuber, Bodenschatz & Bewley Reference Sinhuber, Bodenschatz and Bewley2015).
Change in the velocity gradients near the surface for the case with  ${Re}_{T} = 3000$. (a) The r.m.s. of the four measured components of the velocity gradient tensor. (b) Comparison with the RDT predictions of Magnaudet (Reference Magnaudet2003) for the behaviour of the variance of the transverse gradients.

Approaching the surface,  $(\partial u_x / \partial x)'$ declines and
 $(\partial u_z / \partial z)'$ grows. As the viscous layer is approached, they closely approximate the ratio
 $(\partial u_z / \partial z)'/(\partial u_x / \partial x)' = \sqrt {2}$ predicted by RDT (Guo & Shen Reference Guo and Shen2010). The sharp decrease of
 $(\partial u_z / \partial x)'$ to negligibly low levels reflects the zero-shear boundary condition, while the increase of
 $(\partial u_x / \partial z)'$ follows the augmentation of the horizontal fluctuations described above. Overall, the trends are compatible with those reported by Guo & Shen (Reference Guo and Shen2010). However, as the present
 ${Re}_{T}$ is two orders of magnitude larger, the relative thickness of the viscous layer is one order of magnitude smaller, with
 $\delta _\nu \sim 0.01 L_\infty$ here vs
 $\delta _\nu \sim 0.1 L_\infty$ in their study. Indeed, the effect of the zero-shear boundary condition (expected to quench
 $(\partial u_x / \partial z)'$ at the surface) is not reflected by the measurements. Along with imaging limitations, this is due to residual contamination, which permits shear stress at the surface, and surface deformations, which permit enhanced motion along
 $z=0$.
In figure 11(b) our results on the transverse gradients are compared with RDT predictions as obtained by Magnaudet (Reference Magnaudet2003), which involve an increase in  $(\partial u_x / \partial z)'$ and a decrease in
 $(\partial u_z / \partial x)'$. The measured changes in transverse r.m.s. velocity gradients within the source layer align qualitatively with the theory, although the depth of the affected region and magnitude of the change is underpredicted. The qualitative agreement confirms the significance of the interaction between the fine scales of the turbulence and the large-scale flow modifications imposed by the surface.
3.4. Inter-scale energy transfer
So far, we have shown a marked change in the density of TKE present at various scales and distances from the free surface, as well as a near-surface change in the dynamics of the small-scale structures. Here, we explore how such surface-induced changes are reflected in the transport of energy across scales.
We denote with
 \begin{align} q_i(\boldsymbol{x},\boldsymbol{r}) &= (u_i(\boldsymbol{x}+\boldsymbol{r}) - u_i(\boldsymbol{x}))^2, \end{align}
 \begin{align} &= \left(\Delta u_i (\boldsymbol{x},\boldsymbol{r})\right)^2, \end{align}
the TKE associated with the  $i$-component of the velocity difference between a point
 $\boldsymbol {x}$ and a point
 $\boldsymbol {r}$ away, noting that
 $\overline {q_i}(\boldsymbol {x},\boldsymbol {r}\rightarrow \boldsymbol {\infty }) \rightarrow 2 \overline {u_i^2}$ in a homogeneous flow. With this notation, the rate at which energetic motions are compressed or extended by the local relative motion is
 $q_i(\boldsymbol {x},\boldsymbol {r}) \boldsymbol {\Delta u} (\boldsymbol {x},\boldsymbol {r})$. Averaging in time and along the homogeneous
 $x$-direction, we obtain with
 $\overline {q_i \boldsymbol {\Delta u}}(z,\boldsymbol {r})$ the depth-dependent rate at which TKE due to
 $i$-direction fluctuations over a separation
 $\boldsymbol {r}$ is transported between scales. The approach builds on the generalized Kármán–Howarth equation (von Kármán & Howarth Reference von Kármán and Howarth1938; Monin & Yaglom Reference Monin and Yaglom1975; Hill Reference Hill2002). Even for inhomogeneous and anisotropic flows for which only selected velocity components are captured, this framework provides insight on the magnitude and direction of the energy cascade at the various scales of the turbulence (Gomes-Fernandes, Ganapathisubramani & Vassilicos Reference Gomes-Fernandes, Ganapathisubramani and Vassilicos2015; Alves Portela, Papadakis & Vassilicos Reference Alves Portela, Papadakis and Vassilicos2020; Carter & Coletti Reference Carter and Coletti2018).
With  $\Delta x$ and
 $\Delta z$ giving the horizontal and vertical components of
 $\boldsymbol {r}$, figure 12(a) shows
 $\overline {q_i \boldsymbol {\Delta u}}(z,\boldsymbol {r})$ evaluated in the bulk (averaged in the range
 $-1.6 \leqslant z/L_\infty \leqslant -1$), whereas figure 12(b) shows the same quantity just beneath the surface, evaluated at
 $z/L_\infty = -0.1$. The left and right parts of both contour plots refer to the horizontal TKE (
 $q_x$) and vertical TKE (
 $q_z$), respectively. The colour and direction of the arrows indicate the magnitude and scale-space direction of transport, respectively. Inwards-/outwards-pointing arrows thus indicate compression/extension of the energetic motions, i.e. energy being passed to smaller scales (a direct cascade) or to larger ones (an inverse cascade); see Davidson (Reference Davidson2004) and Vassilicos (Reference Vassilicos2015).
The inter-scale transfer of energy at various depths with  ${Re}_{T} = 12\,400$. (a,b) The vector transfer of energy between scales
 $\overline {q_i \boldsymbol {\Delta u}}(z,\boldsymbol {r})$ in the bulk (a) and at
 $z/L_\infty =-0.1$ (b). In each map, the left and right sides give the inter-scale transfer of horizontal and vertical TKE, respectively. The colour gives the magnitude of the transfer and the arrow gives its direction in scale space. Dashed circles trace scales of constant
 $|\boldsymbol {r}| = \sqrt {(\Delta x)^2 + (\Delta z)^2}$. (c,d) The radial component of the horizontal transfer of horizontal (c) and vertical (d) TKE at various depths, indicating a reduction (or even reversal in direction) of the transfer near the surface. (e) Vertical profiles of the inter-scale transfer of contributions to TKE for the separation scale
 $\Delta x / L_\infty = 0.40$.

In the bulk (figure 12a), TKE from both horizontal and vertical fluctuations is primarily transferred inwards – that is, in a direct cascade from larger to smaller scales. However, the large-scale anisotropy in the flow causes departures from the purely down-scale energy flux (Carter & Coletti Reference Carter and Coletti2017). The inter-scale transport of  $u_x^2$ is greater than that of
 $u_z^2$, largely because of the greater amount of horizontal TKE available to be transferred, as discussed in detail below. The horizontal compression of both TKE contributions is larger for the same reason, mirroring results from previous studies focused on flows exhibiting comparable large-scale anisotropy (Gomes-Fernandes et al. Reference Gomes-Fernandes, Ganapathisubramani and Vassilicos2015; Carter & Coletti Reference Carter and Coletti2018). Further, the anisotropy yields a relatively small energy cascade over vertical separations, consistent with the findings of Carter & Coletti (Reference Carter and Coletti2018) in a jet-stirred turbulence chamber similar to the present one.
Near the surface (figure 12b), the inter-scale transfer is radically different. The magnitude of the horizontal compression of  $u_x^2$ is significantly reduced, and strikingly, the arrows denoting the transfer of
 $u_z^2$ point outwards for horizontal separations. This indicates that, beneath the surface, there is an inverse cascade of vertical energy: fluid regions of intense vertical velocity fluctuations are, on average, stretched horizontally such that vertical energy is transferred to larger scales.
These surface-induced modifications to the inter-scale energy transfer are made even more apparent in figures 12(c)–12(e), which show the inwards horizontal transfer of horizontal and vertical TKE at various depths. The term giving the stretching of horizontal TKE,  $\overline {q_x \Delta u_x}$, amounts to the longitudinal third-order structure function
 $D_{3,x}^{L}$, whose negative slope is proportional to the inter-scale TKE transfer in the inertial range (Davidson Reference Davidson2004; Vassilicos Reference Vassilicos2015). As seen in figure 12(c), such negative slope is reduced as the surface is approached, signalling a hindering of the direct cascade. For the stretching of vertical TKE
 $\overline {q_z \Delta u_x}$ the trend is even stronger (figure 12d): as the surface is approached, the sign of this quantity (and the slope of the curve over an intermediate range of horizontal separations) becomes positive, indicating that the vertical TKE is, on average, transferred to larger scales. Figure 12(e) plots vertical profiles of
 $\overline {q_i \Delta u_x}(z)$ at the representative separation
 $\Delta x/L_\infty = 0.4$ and indicates that, while the general trend of energy transfer reduction is seen across the source layer, it becomes sharper in the upper stratum of depth
 $O(0.1 L_\infty )$. Here, the direct cascade of horizontal energy is quenched and the cascade of vertical energy is inverted.
To understand the origins of this behaviour, it is instructive to Reynolds decompose both  $q_i$ and
 $\Delta u_x$ and write the horizontal inter-scale transfer as
 \begin{equation} \overline{q_i \Delta u_x} = q'_i (\Delta u_x)' k_i, \end{equation}
where  $k_i = \overline {q_i \Delta u_x} / (q_i' (\Delta u_x)')$ represents the correlation between
 $q_i$ and
 $\Delta u_x$. In other words, the presence of the surface changes the inter-scale energy transfer rate because it affects (i) the turbulent energy available to be transferred
 $q_i$, (ii) the horizontal extension/compression
 $\Delta u_x$ and (iii) the correlation between both quantities
 $k_i$. (Note that
 $k_x$ contains the same information as the skewness of
 $\Delta u_x$.) To isolate the effect of the free surface, we express each factor in (3.4) as the sum of its bulk value and a depth-dependent deviation (denoted with a tilde)
 \begin{equation} \overline{q_i \Delta u_x} = \left( q'_{i,\infty} + \widetilde{q'_i}(z) \right) \left( (\Delta u_x)'_\infty + \widetilde{(\Delta u_x)'}(z) \right) \left( k_{i,\infty} + \widetilde{k_i}(z) \right), \end{equation}
where the first, second and third terms on the right-hand side quantify the effect of the changes in (i), (ii) and (iii), respectively, with depth.
These three contributions and their combined effect on the inter-scale transfer are depicted in figure 13 as a function of  $\Delta x$ and
 $z$, for the horizontal transfer of
 $q_x$ (panels a–d) and
 $q_z$ (e–h). As discussed in § 3.1, the horizontal TKE is increased near the surface, especially at large scales. This increase in the amount of TKE available to be transferred through scales causes the down-scale transfer of
 $q_x$ to become more negative; see figure 13(a). Figure 13(e) and § 3.2 show the opposite is the case for
 $q_z$. This change in the magnitude of the TKE present, however, is sub-dominant compared with the decreased coupling between TKE and horizontal extension/compression (figure 13c, f) which effectively determines the behaviour of the inter-scale transfer for both components (figure 13d,h). In both cases, the decreased coupling makes
 $\overline {q_i \Delta u_x}$ less negative, hindering the cascade. The surface also induces a somewhat larger magnitude of
 $\Delta u_x$ (figure 13b,e), although this effect is moderate.
Terms relating to the modification of inter-scale energy transfer near the surface for horizontal (a–d) and vertical (e–h) TKE for  ${Re}_{T} = 12\,400$. Orange values indicate an enhancement of the cascade (i.e. making the transfer more negative), while purple values indicate a reduction of the cascade. Panels (a,e) show the effect of the change in energy available to be transferred; panels (b, f) indicate the effect of the change in the scale of the velocity differences; panels (c,g) indicate the change due to the decorrelation between the energetic structures and horizontal compression. Panels (d,h) show the total change in transfer relative to the bulk value. Given that the most pronounced changes occur in the upper half of the source layer and that our results are influenced by forcing-induced anisotropies in the bulk, we take the ‘bulk’ to be
 $z/L_\infty = -0.4$ for the purpose of this analysis.

So far, we have illustrated the inter-scale energy transfer for the case  ${Re}_{T} = 12\,400$. The dynamics of the near-surface cascade of
 $u_x^2$, however, is sensitive to the degree to which the horizontal TKE accumulates near the surface, which becomes more pronounced with more intense forcing (see figure 9). Figure 14 illustrates how, for
 ${Re}_{T} = 22\,800$, the increase in the horizontal energy available to be transferred overcomes the decreased correlation between energetic events and compression. As a result, the net down-scale transfer of horizontal TKE is enhanced near the surface. Still, the behaviour of the vertical TKE transfer (not shown) is qualitatively similar to what is displayed under less intense forcings, with a sizeable backscatter of energy to large scales.
As in figure 13, but with  ${Re}_{T}=22\,800$ and showing only the change in the transfer of horizontal TKE. In this case, the increase in
 $q_x$ near the surface overcomes the decreased
 $k_x$, such that the total down-scale energy transfer (d) is enhanced.

Taken together, the results of this section demonstrate how, along horizontal separations, the surface hinders the direct cascade of horizontal TKE and causes an inverse cascade of vertical TKE. (Isolating the surface-induced changes to the inter-scale energy transfer along vertical separations is more challenging, as those are overwhelmed by the spatial non-homogeneity in this direction.) The hindrance of the direct cascade, we have shown, stems from the decorrelation between compressive velocity structures and energetic events near the surface. This limits the rate at which large-scale energetic structures break down into smaller eddies and results in the increase of  $L_x^{L}$ approaching the surface seen in figure 10(c). That the same effect is not observed for
 $L_z^{T}$ is likely due to the kinematic boundary condition: this imposes that the horizontal footprint of the vertical fluctuations must approach the one of the surface divergence, whose extent is discussed in the following section.
4. Role of upwellings and downwellings
We turn to the dynamics of upwellings and downwellings, critical to the transfer of mass and energy between the surface and the bulk (Perot & Moin Reference Perot and Moin1995). Here, we address questions about their magnitude and spatial extent, quantities that are connected to the surface divergence and in turn to the various processes to which the latter is relevant (McKenna & McGillis Reference McKenna and McGillis2004; Magnaudet & Calmet Reference Magnaudet and Calmet2006; Kermani & Shen Reference Kermani and Shen2009; Turney & Banerjee Reference Turney and Banerjee2013; Herlina & Wissink Reference Herlina and Wissink2014). We then analyse the role of upwellings and downwellings in the intercomponent energy transfer near the surface, illustrating how the imbalance between both types of events contributes to the inter-scale energy transfer discussed in § 3.4.
4.1. Topology and magnitude
The no-penetration condition at the free surface implies that, for small  $z$ and an approximately flat surface,
 $u_z \sim z \partial u_z / \partial z$ (McKenna & McGillis Reference McKenna and McGillis2004). This amounts to a positive correlation between the surface divergence
 $\beta = \partial u_x / \partial x + \partial u_y / \partial y = - \partial u_z / \partial z$ (with the gradients evaluated at the surface) and the sub-surface vertical velocity, making
 $\beta$ a natural metric to gauge the local state of upwelling/downwelling (Guo & Shen Reference Guo and Shen2010). Figures 15(a) and 15(c) show instantaneous fields of
 $u_z$ and
 $\partial u_z / \partial z$, respectively, with the depth normalized by both
 $L_\infty$ and
 $L_\lambda$. Within a distance
 $O(L_\lambda )$ of the surface, there is a resemblance between the two fields. At larger depths the coherence is gradually lost.
The coupling between vertical velocity and its vertical gradient near the surface. (a,c) Snapshots of  $u_z$ (a) and
 $\partial u_z / \partial z$ (c) in the vicinity of the surface. (b) The transverse length scale of the vertical velocity, in black. The blue and red curves give the contributions from downwards and upwards velocities, respectively. The dotted grey line is the horizontal integral scale of
 $\partial u_z / \partial z$ structures. (d) The correlation between the surface divergence and the vertical velocity as a function of the depth, in black. The purple and green curves give the contributions to the correlation from instances of negative and positive surface divergence, respectively. As in (c), vertical axes are scaled logarithmically. (e) The joint distribution of surface divergence and sub-surface vertical velocity taken at a depth
 $z=-L_\infty /10$. Cyan lines trace constant relative occurrences and the red line gives the expected vertical velocity given a surface divergence. ( f) Standalone distributions of the two quantities, each normalized by its own standard deviation, evidencing their positive skewness.

These visual observations are supported by the flow statistics. Figure 15(b) shows how  $L_z^{T}$ (the characteristic scale of
 $u_z$ in the homogeneous
 $x$ direction, shown in black) shrinks as the surface is approached, while the characteristic scale of
 $\partial u_z / \partial z$ (based on the integral of its autocorrelation which is
 $O(L_\lambda )$), grows sightly.
The coupling of the surface divergence to the vertical velocity at various depths is quantified for the representative case  ${Re}_{T}=12\,400$ in figure 15(d), which displays in black the correlation coefficient between
 $\beta$ and
 $u_z$
 \begin{equation} C_{\beta, u_z}(z) = \frac{\overline{\beta(x) u_z(x,z)}}{ \beta' u'_z(z)}. \end{equation}
The surface divergence is approximated as  $\beta = - \partial u_z/ \partial z$ evaluated at the centre of the uppermost PIV interrogation window,
 ${\sim }{1}\ {\rm mm}$ from the surface. As this is of the order of the viscous sublayer, we expect the estimate to be appropriate to retrieve correct trends (Guo & Shen Reference Guo and Shen2010). The profiles of
 $C_{\beta, u_z}$ confirm a strong surface–depth correlation near the surface.
To compare the behaviour during upwellings and downwellings, we condition the statistics on the sign of  $\beta$, which is positive for the former and negative for the latter. Given the roughly equal occurrences of
 $\beta <0$ and
 $\beta >0$, the overall (unconditioned) correlation between
 $\beta$ and
 $u_z$ (4.1) could be approximated as the average of the two conditional correlations shown, with
 \begin{equation} \frac{1}{2} \left( \frac{\overline{\beta(\boldsymbol{x}) u_z(\boldsymbol{x} + z \boldsymbol{e}_z) }^-}{\beta' u'_z(z)} + \frac{\overline{\beta(\boldsymbol{x}) u_z(\boldsymbol{x} + z \boldsymbol{e}_z)}^+}{\beta' u'_z(z)} \right) \approx C_{\beta,u_z}(z), \end{equation}
where the superscripts indicate the sign of  $\beta$ on which the averaging is conditioned. The coloured curves in figure 15(d), each corresponding to one term on the left-hand side of (4.2), indicate that the surface-parallel flow is correlated to the vertical motion beneath over a deeper depth during upwellings than during downwellings. Likewise, conditioning the transverse covariance of
 $u_z$ on its sign yields larger values of
 $L_z^{T}$ when
 $u_z > 0$ compared with instances when
 $u_z < 0$; see figure 15(b). These results indicate that upwellings have a larger horizontal and vertical extent than downwellings.
The strong correlation between  $\beta$ and
 $u_z$ in the vicinity of the surface is not hindered by the broad distribution of either quantity. This is highlighted in their joint p.d.f. shown in figure 15(e), with
 $u_z$ taken at
 $z=-0.1 L_\infty$, where
 $C_{\beta, u_z} \sim 0.5$ (see figure 15d). The trend of
 $\langle u_z \rangle$ conditioned on
 $\beta$ indicates that upwards sub-surface velocities are more strongly tied to positive divergence than downward ones are to negative divergence. This is true particularly for anomalously large fluctuations. As shown in figure 15( f), both
 $\beta$ and
 $u_z$ are intermittent and positively skewed: near the surface, fast upwards velocities (thus strongly positive surface divergence) are more likely to occur than fast downwards velocities (and strongly negative surface divergences).
To complete the view of the flow topology, figure 16 shows the correlation between  $\beta$ and
 $u_z$ at a depth
 $z$ and offset horizontally by
 $\Delta r$. We condition again on the sign of
 $\beta$, with contributions from downwellings and upwellings shown on the left and right, respectively. As with the vertical velocity–overhead
 $\beta$ correlations shown in (4.2), the overall correlation between
 $\beta$ and the vertical velocity at some depth and horizontal offset can be approximated as
 \begin{align} &\frac{1}{2} \left(
\frac{\overline{\beta(\boldsymbol{x})
u_z(\boldsymbol{x}+\Delta r \boldsymbol{e}_x + z
\boldsymbol{e}_z) }^-}{\beta' u'_z(z)} +
\frac{\overline{\beta(\boldsymbol{x})
u_z(\boldsymbol{x}+\Delta r \boldsymbol{e}_x + z
\boldsymbol{e}_z) }^+}{\beta' u'_z(z)} \right)\nonumber\\
&\quad \approx \frac{\overline{\beta(\boldsymbol{x})
u_z(\boldsymbol{x}+\Delta r \boldsymbol{e}_x + z
\boldsymbol{e}_z) }}{\beta' u'_z(z)},
\end{align}
where the superscripts indicate the sign of  $\beta$ on which the averaging is conditioned. Further, we show with the arrows the mean sub-surface velocity field conditioned on positive/negative surface divergence, obtained by a conditional weighted average of the sub-surface velocity with
 $|\beta |$ as the weight. This approach, akin to the variable-intensity spatial averaging schemes employed by Guo & Shen (Reference Guo and Shen2010) and Khakpour, Shen & Yue (Reference Khakpour, Shen and Yue2011), suggests that coherent upwellings possess higher intensity and greater spatial extent in both vertical and lateral directions. We stress that this procedure yields a statistical representation of the transport dynamics which is not necessarily representative of instantaneous events – in particular, the averaging smooths the small-scale features of the near-surface fields, such as those pictured in figures 15(a) and 15(c). Further, with any interpretation of results relating to the size and energetics of upwellings and downwellings, one must keep in mind that, over the entire flow, there is 0 net upwards or downwards mass flux through a given surface-parallel plane.
Contribution to the correlation between  $\beta$ and
 $u_x$ by instances of
 $\beta < 0$ (left) and
 $\beta > 0$ (right). The white arrows indicate the weighted-averaged velocity field under each structure.

Because the turbulent scales change throughout the source layer, there is no immediately apparent metric to characterize the size of upwelling and downwelling structures. As they involve vertical velocity fluctuations carrying fluid to or from the surface, however, the depth at which  $C_{\beta, u_z}$ remains high embodies the reach of the surface–bulk coupling. Figure 17 shows profiles of
 $C_{\beta, u_z}$ vs
 $z$ normalized by three different length scales:
 $L_\infty$,
 $L_\lambda$ and the mixed length scale
 $(L_\lambda L_\infty )^{1/2}$. The latter incorporates the correlation lengths of both
 $\partial u_z / \partial z$ and
 $u_z$, yielding the best collapse of the data in the source layer (below the near-surface layer affected by viscous effects and surface deformation). Therefore, we conclude that this mixed scale, which involves the characteristic scales of the surface and sub-surface motions, is a viable estimate of the vertical extent of surface-attached upwellings and downwellings over the wide range of considered
 ${Re}_{T}$.
Correlations between the surface divergence and sub-surface velocity at a given depth, with the depth normalized by (a) the far-field integral scale, (b) the far-field Taylor scale and (c) a mixed length scale combining the two. Correlations less than 1 at the surface result from a combination of limited resolution near the surface, experimental error and finite Froude and Weber number effects.

In previous numerical studies, the horizontal footprint of these structures appeared to be comparable to  $L_\infty$ (Guo & Shen Reference Guo and Shen2010; Herlina & Wissink Reference Herlina and Wissink2014). One potential explanation for the discrepancy with our results is the disparate Reynolds numbers: the simulations attained
 ${Re}_{T}$ one-to-two orders of magnitude smaller than in our experiments and thus yielded marginal separation between the relevant scales, as the Taylor scale scales as
 $L_\infty /L_\lambda \propto {Re}_{T}^{1/2}$ and the mixed length scale scales as
 $L_\infty / (L_\lambda L_\infty )^{1/2} \propto {Re}_{T}^{1/4}$.
4.2. Contribution to the inter-scale energy transfer
By virtue of their different magnitude and topology, upwellings and downwellings contribute differently to the transport of energy in space and across scales. This is explored by conditioning the statistics on the sign of  $u_z$ rather than
 $\beta$, which allows us to compare the turbulence structure associated with upward and downward fluctuations throughout the source layer. We still refer to upwellings/downwellings, although we do not restrict the analysis to surface-attached structures.
Figure 18(a) presents conditional profiles of the vertical component of TKE, indicating that upward motions carry stronger surface-normal fluctuations than downward ones:  $\overline {u_z^2}^+ > \overline {u_z^2}^-$ (with superscripts indicating the sign of
 $u_z$). This is consistent with simulations by Guo & Shen (Reference Guo and Shen2010), who found the latter to have weaker surface-normal velocity than the former. The imbalance results from the spatial non-homogeneity in the source layer: downward motions carry fluid from the near-surface region where vertical TKE is lower, and vice versa for upward motions. This is reflected in the surface-normal transport of vertical TKE by the vertical fluctuations,
 $-\partial \overline {u_z^3}/\partial z$ (figure 18b). Its positive sign in the upper part of the source layer implies a net transport of turbulence towards the surface, as described in detailed by numerical simulations (Perot & Moin Reference Perot and Moin1995; Walker et al. Reference Walker, Leighton and Garza-Rios1996; Calmet & Magnaudet Reference Calmet and Magnaudet2003). The net vertical transport results from opposite contributions (from upwellings and downwellings) of comparable magnitude, with upward motions prevailing, especially at depths
 $O(0.1 L_\infty )$. This net transport has been shown to feed the net inter-component transport from vertical to horizontal energy (Walker et al. Reference Walker, Leighton and Garza-Rios1996). By comparison, the net flux of vertical TKE by the small mean flow,
 $- \partial (\overline {u_z^2} \overline {u_z}) / \partial z$, is negligible.
The role of upwards and downwards motions in the budget of vertical TKE. (a) The vertical TKE profiles during each direction of motion. (b) The vertical flux of vertical TKE during each direction of motion. The dashed grey line gives the flux due to the mean flow. (c) The horizontal inter-scale transport of vertical TKE at a depth  $z=-0.1 L_\infty$.

The differing behaviour of downwellings and upwellings is connected to the decreased correlation between  $q_z$ and
 $\Delta u_x$ near the surface, which was shown in § 3.4 to determine the reduced cascade of vertical TKE. Specifically, as illustrated in figure 16, downwellings and upwellings produce horizontal compression (
 $\overline {\Delta u_x}^- < 0$) and stretching (
 $\overline {\Delta u_x}^+ >0$) along the surface, respectively. The resulting inter-scale transfers of vertical TKE are displayed in figure 18(c) for the representative depth
 $z/L_\infty =-0.1$: downwellings compress energy to smaller scales, while upwellings extend energy to larger horizontal scales. Due to the energetic imbalance shown in figure 18(a), energetic extensions during upwellings are more effective than compressions during downwellings, ultimately resulting in the inverse cascade of vertical TKE.
While upward motions contain a larger amount of vertical TKE compared with downward ones, the opposite is true for horizontal TKE:  $\overline {u_x^2}^+ < \overline {u_x^2}^-$, as shown in figure 19(a). Indeed, downward motions near the surface carry fluid from layers rich in horizontal energy, especially at the large scales, as described in § 3.2. Moreover, in keeping with the flow topology displayed in figure 16, the horizontal TKE tends to be transferred to larger and smaller scales during upwellings and downwellings, respectively (figure 19b). While shedding light on the role each type of motion plays in transferring horizontal TKE between scales, the present analysis does not fully explain the reduced correlation between
 $q_x$ and
 $\Delta u_x$ shown in figure 13(c), motivating future work.
Characteristics of horizontal TKE during periods of downwards (blue) and upwards (red) motion. (a) The horizontal TKE during both types of motion. (b) The inter-scale horizontal transfer of horizontal TKE at  $z=-0.1 L_\infty$, evidencing an inverse cascade during upwards motions.

5. Conclusions
We have investigated the influence a free surface exerts on the turbulence underneath, using a large zero-mean-flow water tank in which homogeneous turbulence of controllable intensity is forced. Several specific features of the present set-up distinguish it from installations used in past studies, making it especially suitable for studying the problem. The turbulence in the bulk is homogeneous over a region much larger than the integral scale and has negligible mean velocity gradients; therefore, the finite size of the tank does not significantly influence the dynamics. The range of explored Reynolds numbers, up to  ${Re}_{T} = 22\,800$ and
 ${Re}_\lambda = 590$, allows for the development of an inertial range, with substantial separation between the integral and dissipative lengths of the system,
 $L_\infty / l_{K} = O(10^3)$ and
 $L_\infty / \delta _{\nu} = O(10^2)$. This is essential for establishing the power-law scalings predicted by Kolmogorov (Reference Kolmogorov1941) and Hunt & Graham (Reference Hunt and Graham1978). Moreover, the forcing is applied homogeneously in depth up to less than one integral scale from the surface. This limits the spatial decay of TKE while maintaining weak surface deformation, with wave amplitudes of the order of the viscous layer thickness. This has enabled us to address several open questions, reaching the following conclusions.
In the source layer, both the magnitude and the length scale associated with the vertical TKE decrease on approaching the surface, in line with the RDT predictions by Hunt & Graham (Reference Hunt and Graham1978). For most observables, the quantitative agreement with their theory systematically improves with increasing  ${Re}_{T}$. This is consistent with the analysis of Magnaudet (Reference Magnaudet2003) who showed how nonlinear effects from the large-scale distortion by the surface (neglected in the original analysis) vanish in the high-
 ${Re}_{T}$ limit. The blockage effect is clearly demonstrated by the energy distribution across spatial scales: the surface limits the vertical fluctuations of eddies larger than the depth at which they are located. The increase of horizontal TKE predicted by RDT is visible only at the higher turbulence intensity,
 ${Re}_{T} > \sim 10\,000$, whereas for weaker forcing the effect is mild and thus obscured by spatial inhomogeneities. The level of forcing at which the horizontal TKE enhancement emerges is expected to depend on the specific system. Overall, our results indicate that differences in
 ${Re}_{T}$ and forcing schemes were the likely cause of discrepancy between previous studies.
The growth of horizontal energy in the source layer is concentrated at the large scales, specifically those for which the vertical energy is suppressed. This results in a strong enlargement of the integral scales of horizontal fluctuations, opposite to the RDT prediction. Such an accumulation of energy at the large scales is interpreted as the consequence of a hindered TKE cascade. The latter is demonstrated in the framework of the generalized Kármán–Howarth equation, specifically focusing on the inter-scale energy transfer across horizontal scales. The proximity to the surface inhibits the forward cascade of horizontal TKE, and even causes an inverse cascade of vertical TKE. This behaviour is rooted in a loss of correlation between energetic motions and compressive states of the flow. Such correlation is a hallmark of 3-D homogeneous turbulence, associated with the prevalence of vortex stretching and strain self-amplification and classically signalled by the negative skewness of the longitudinal velocity gradients (Davidson Reference Davidson2004; Carbone & Bragg Reference Carbone and Bragg2020; Johnson Reference Johnson2021). Near the surface, the extension/compression of velocity differences is radically altered by the upwelling and downwelling structures populating the near-surface region.
To analyse the effect of upwellings and downwellings on TKE transport, we have conditioned our data on the sign of the surface divergence and sub-surface velocity. Leveraging the scale separation achieved in our set-up, we find that the vertical extent of up- and downwellings lies between the integral and the Taylor microscale, being  $O((L_\lambda L_\infty )^{1/2}) \sim {Re}_{T}^{-1/4} L_\infty$. While a firm theoretical underpinning for such scaling is not available, a mixed length is consistent with the involvement of both energetic eddies (carrying fluid up the source layer) and velocity gradients (related to the surface divergence). Statistically, we find upwellings to be more energetic, determining the net flux of vertical TKE towards the surface. Downwellings, on the other hand, carry stronger horizontal TKE. These imbalances are connected to the opposite contribution of both types of motions to the inter-scale flux of energy: upwellings carry fluid parcels towards the surface and stretch them horizontally along it, while downwellings compress and carry them towards the bulk. Therefore, it is during downwellings that surface-attached vortices can stretch (Shen et al. Reference Shen, Zhang, Yue and Triantafyllou1999), which is crucial for transferring horizontal energy to smaller scales (Davidson Reference Davidson2004; Johnson Reference Johnson2021).
The nature of the energy cascade in the vicinity of and along the free surface has been much debated, with several studies presenting evidence of a quasi-2-D turbulent dynamics (Pan & Banerjee Reference Pan and Banerjee1995; Perot & Moin Reference Perot and Moin1995; Sarpkaya Reference Sarpkaya1996; Lovecchio et al. Reference Lovecchio, Zonta and Soldati2015), and others emphasizing the fundamentally 3-D character of the flow (Walker et al. Reference Walker, Leighton and Garza-Rios1996; Shen et al. Reference Shen, Zhang, Yue and Triantafyllou1999; Guo & Shen Reference Guo and Shen2010). The present investigation represents a step to reconcile those views, as it highlights how upwellings and downwellings are not only chiefly responsible for the spatial transfer of energy, but also for the inter-scale flux at the surface. Energetic imbalances between upwellings and downwellings impact the amount of energy each type of motion extends or compresses to different scales. In the aggregate, we find that the near-surface structures modify the turbulence in such a way that the correlation between compressive and energetic structures is reduced, hindering the down-scale cascade of TKE.
The present configuration in which turbulence is forced throughout the fluid volume is of high practical relevance; e.g. for shallow rivers and oceanic fronts, in which near-surface processes generate and sustain energy fluctuations (Nezu & Nakagawa Reference Nezu and Nakagawa1993; D'Asaro et al. Reference D'Asaro, Lee, Rainville, Harcourt and Thomas2011; Franca & Brocchini Reference Franca and Brocchini2015; Taylor & Thompson Reference Taylor and Thompson2023). Other common systems, however, involve turbulence generated at depth, diffusing towards the surface before feeling its influence. The effect of the distance between the turbulence generation region and the surface has not been systematically assessed, and research is warranted on this point to identify mechanisms with a maximum degree of generality.
Other notable aspects that are outside the scope of the present work deserve attention. In particular, the essentially non-homogeneous and anisotropic character of near-surface turbulence implies that 3-D measurements are required to close the inter-scale energy budget. This is highly challenging as the Kolmogorov and integral scales need to be simultaneously resolved; it can be achieved, however, with advanced imaging approaches (Knutsen et al. Reference Knutsen, Baj, Lawson, Bodenschatz, Dawson and Worth2020). Moreover, surface contamination may play a key role in the coupling of the sub-surface velocity to the surface divergence: Marangoni stresses induced by surfactant concentration gradients alter the structure of the divergence field (McKenna & McGillis Reference McKenna and McGillis2004; Shen et al. Reference Shen, Yue and Triantafyllou2004). Dedicated experiments are required to reach a predictive understanding of such processes. Further, when the surface deformation becomes large, its dynamics is two-way coupled with the turbulence dynamics underneath (Brocchini & Peregrine Reference Brocchini and Peregrine2001a; Savelsberg & Van De Water Reference Savelsberg and Van De Water2009; Smeltzer et al. Reference Smeltzer, Rømcke, Hearst and Ellingsen2023). Future measurements involving more highly deformed surfaces will elucidate this interplay of surface energy, wave kinetic energy and turbulence energy.
Supplementary movie
A movie of the vorticity fields at each Reynolds number is available as supplementary material at https://doi.org/10.1017/jfm.2024.1017.
Funding
Funding from the Swiss National Science Foundation (project # 200021-207318) is gratefully acknowledged.
Declaration of interests
The authors report no conflict of interest.


 Open access

