


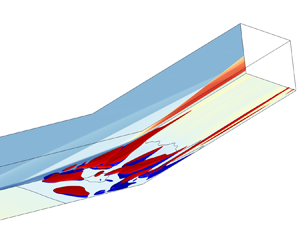



1. Introduction
Shock wave/boundary layer interaction (SBLI) is ubiquitous in high-speed flight (Babinsky & Harvey Reference Babinsky and Harvey2011). It is typically observed at body flaps, forebodies and control surfaces where canonical flows are characterized by compression ramp flows (Ganapathisubramani, Clemens & Dolling Reference Ganapathisubramani, Clemens and Dolling2009; Dwivedi et al. Reference Dwivedi, Sidharth, Nichols, Candler and Jovanović2019; Cao et al. Reference Cao, Hao, Klioutchnikov, Olivier and Wen2021a; Lugrin et al. Reference Lugrin, Beneddine, Leclercq, Garnier and Bur2021) and shock impingement on boundary layers (Pasquariello, Hickel & Adams Reference Pasquariello, Hickel and Adams2017; Chang et al. Reference Chang, Chan, McIntyre and Veeraragavan2022; Ceci et al. Reference Ceci, Palumbo, Larsson and Pirozzoli2023). The complexities of the flow environment in high-speed flight lead to intricate phenomena, such as boundary layer separation, high wall heat flux, and unsteadiness of shocks due to intense SBLI, posing significant challenges for thermal protection and flight control (Zhang Reference Zhang2020). To address these challenges, extensive experiments and numerical simulations have been conducted to investigate the transient and statistical behaviours of SBLI. Comprehensive reviews of these studies have been provided by Dolling (Reference Dolling2001), Knight et al. (Reference Knight, Yan, Panaras and Zheltovodov2003) and Clemens & Narayanaswamy (Reference Clemens and Narayanaswamy2014), and more recently by Gaitonde & Adler (Reference Gaitonde and Adler2023).
The unsteadiness evolution of high friction and heat flux streaks downstream of laminar separation SBLI, which excludes the modulation of turbulence, provides a relatively simple yet practical engineering research subject. Experimentally, the high heat flux streaks were discovered tracing back to 1971 in the von Karman Institute by Ginoux (Reference Ginoux1971) in Mach 5.3 flow, resulting in substantial spanwise variation of heat transfer, with peak values several times higher than the average. More recently, Roghelia et al. (Reference Roghelia, Olivier, Egorov and Chuvakhov2017) and Chuvakhov et al. (Reference Chuvakhov, Borovoy, Egorov, Radchenko, Olivier and Roghelia2017) conducted Mach 7.7 laminar inflow experiments in the Aachen Shock Tunnel TH2 and Central Aerohydrodynamic Institute UT-1M tunnel independently, under similar conditions of unit length Reynolds number and wall temperature, reporting similar heat flux streaks downstream of the reattachment. This pattern has also been observed by Simeonides & Haase (Reference Simeonides and Haase1995) and de la Chevalerie et al. (Reference de la Chevalerie, Fonteneau, De Luca and Cardone1997).
To quantify the observed structures, experiments and numerical simulations are employed to measure both spatial and temporal scales. The wavelengths of streaks measured via infrared imaging are found to be approximately 5.9 mm (Roghelia et al. Reference Roghelia, Olivier, Egorov and Chuvakhov2017) and 5.1 mm through the application of thermal sensitive paint (Chuvakhov et al. Reference Chuvakhov, Borovoy, Egorov, Radchenko, Olivier and Roghelia2017), specifically in Mach 7.7 laminar compression ramp flow conditions. For the same inflow conditions, based on input/output analysis, Dwivedi et al. (Reference Dwivedi, Sidharth, Nichols, Candler and Jovanović2019) found the spanwise length of steady streaks to be 3–4.5 times the displacement thickness at separation, while Cao et al. (Reference Cao, Hao, Klioutchnikov, Olivier and Wen2021a) reported a wavelength 3.3 mm through global stability analysis. For a lower Mach number case, Navarro-Martinez & Tutty (Reference Navarro-Martinez and Tutty2005) found that the reattachment streaks’ wavelength varies in the spanwise direction, ranging from 6 mm at the centreline to 3.1 mm at the sides. The above results suggest that the spanwise length can be approximately scaled with the boundary layer thickness (Ginoux Reference Ginoux1971; Roghelia et al. Reference Roghelia, Olivier, Egorov and Chuvakhov2017). Nevertheless, experimental measurements demand setting truncation values, whereas both global stability and input/output methods presume the spanwise periodicity. Compared to spatial investigations, temporal scale studies are relatively limited due to experimental techniques such as thermal sensitive paint and oil flow visualization providing time-averaged results. Kavun, Lipatov & Zapryagaev (Reference Kavun, Lipatov and Zapryagaev2019) measured pressure fluctuations of the frequencies in a Mach 6 laminar separated flow, revealing two peaks in the spectrum, with Strouhal numbers 0.65 and 3.5. Direct numerical simulations (DNS) conducted by Cao et al. (Reference Cao, Hao, Klioutchnikov, Olivier and Wen2021a) and Cao, Olivier & Schröder (Reference Cao, Olivier and Schröder2021b) show low-frequency wall Stanton number fluctuations at post-reattachment with Strouhal number 0.15.
The dynamics and formation mechanisms of the streamwise streaks at post-reattachment are primarily attributed to two major factors: one is the global (intrinsic) instability nature of the separation bubble, the other is the localized dynamics after reattachment. The global instability has been studied extensively through linear stability tools (Sansica, Sandham & Hu Reference Sansica, Sandham and Hu2016; Dwivedi et al. Reference Dwivedi, Sidharth, Nichols, Candler and Jovanović2019; Cao et al. Reference Cao, Olivier and Schröder2021b; Hao et al. Reference Hao, Cao, Wen and Olivier2021; Bugeat et al. Reference Bugeat, Robinet, Chassaing and Sagaut2022). By masking the separation bubble with the virtual boundary and using input/output analysis, Dwivedi et al. (Reference Dwivedi, Sidharth, Nichols, Candler and Jovanović2019) found that the largest amplification of streamwise vorticity reduces 5 times, and the normalized spanwise wavelength associated with the largest gain decreases from 3.0 to 2.25, indicating that both upstream disturbances and separation bubble contribute to the structures. By biglobal analysis, Cao et al. (Reference Cao, Hao, Klioutchnikov, Olivier and Wen2021a) found four unstable modes in a Mach 7.7 flow with a  $15^{\circ }$ ramp. The smallest wavelength within these modes is close to the streak scale in DNS, while the largest wavelength structures (
 $\lambda _{z}/L \approx 0.33$) were observed within the separation bubble, emphasizing the importance of bubble instabilities for downstream streaks. Sawant, Theofilis & Levin (Reference Sawant, Theofilis and Levin2022) studied Mach 7 laminar double wedge flow with rarefaction effects. They found that the laminar separation bubble sustains self-excited perturbations and leads to spanwise periodic wall striations downstream of the reattachment line. Similar unstable modes are found in various high Mach number flow configurations, including oblique SBLI (Hildebrand et al. Reference Hildebrand, Dwivedi, Nichols, Jovanović and Candler2018), and specific geometries like double wedge (Gs et al. Reference Gs, Dwivedi, Candler and Nichols2018; Sawant et al. Reference Sawant, Theofilis and Levin2022), double cone (Hao et al. Reference Hao, Fan, Cao and Wen2022) and backward step (Yu et al. Reference Yu, Hao, Wen and Xu2024), when the geometry or boundary parameters exceed critical values. At lower Mach numbers, bifurcation to three-dimensional separation structures (Robinet Reference Robinet2007) and shear layer instability (Guiho, Alizard & Robinet Reference Guiho, Alizard and Robinet2016) also induce low-frequency bubble dynamics and resultant downstream structural formations. For an incompressible laminar separation bubble, Theofilis (Reference Theofilis2011) and Rodriguez, Gennaro & Souza (Reference Rodriguez, Gennaro and Souza2021) found that a self-excited secondary instability of the separation bubble can induce streamwise vortices, explaining the origin of unsteadiness without external disturbances. However, linear instability theories assume periodic streak distribution in spanwise and exponential growth, which may not hold in the nonlinear saturation regime.
After a long time development of flow with large span width, the formation of streamwise streaks at post-reattachment is influenced by local physical interactions. Centrifugal force can generate streamwise Görtler-like vortices after reattachment if the normalized reattaching streamline curvature (Görtler number) exceeds a critical value (Navarro-Martinez & Tutty Reference Navarro-Martinez and Tutty2005; Cao, Klioutchnikov & Olivier Reference Cao, Klioutchnikov and Olivier2019). However, the reliance on empirical parameters in its definition makes it challenging to confirm the dominance. Recently, Gs et al. (Reference Gs, Dwivedi, Candler and Nichols2018) utilized wave-maker analysis in double wedge flow, revealing that the centrifugal effect may not be the sole cause of streaks even with strong mean flow curvature. Dwivedi et al. (Reference Dwivedi, Sidharth, Nichols, Candler and Jovanović2019) analysed the inviscid vorticity transport equation, and found that the baroclinic effect, denoted by pressure spanwise gradient times density normal gradient, is stronger than the centrifugal effect in the reattachment region. The strong influence of pressure spanwise gradient is also studied by Kavun et al. (Reference Kavun, Lipatov and Zapryagaev2019) and Zapryagaev, Kavun & Lipatov (Reference Zapryagaev, Kavun and Lipatov2013) in Mach 6 laminar separated flow.
The evolution and dissipation process of reattachment structures after the linear growth stage in supersonic flows remain comparatively underexplored. For incompressible wall-bounded flows, a self-sustained mechanism has been proposed. This process involves streamwise vortices generating streaks that then become unstable and yield waves that regenerate vortices and ultimately form the self-sustained process (Hamilton, Kim & Waleffe Reference Hamilton, Kim and Waleffe1995; Waleffe Reference Waleffe1997,Reference Waleffe1998; Jiménez & Pinelli Reference Jiménez and Pinelli1999; Wedin & Kerswell Reference Wedin and Kerswell2004). The self-sustained process was originally formulated mathematically for the plane Couette flow (Waleffe Reference Waleffe1997) and extended to pipe flow (Wedin & Kerswell Reference Wedin and Kerswell2004), which is confirmed through the exact coherent structures (Waleffe Reference Waleffe2001, Reference Waleffe2003; Graham & Floryan Reference Graham and Floryan2021) observed in experiment (Hof et al. Reference Hof, van Doorne, Westerweel, Nieuwstadt, Faisst, Eckhardt, Wedin, Kerswell and Waleffe2004). However, the potential application of this process to SBLI reattaching streaks has not been investigated thoroughly.
To investigate the evolution and mechanisms of the SBLI's spatio-temporal dramatic-varying reattachment structures, high-resolution numerical techniques and modal analysis methods provide high quality and profound insights. Priebe & Martín (Reference Priebe and Martín2012) studied a  $24^{\circ }$ compression ramp at a
 $Ma_{\infty }=2.9$ via DNS, and observed strong pulsations of the reattachment point, with oscillations exceeding three times the boundary layer thickness. By analysing the coherence of wall pressure spectra, they revealed an inherent instability to the low-frequency unsteadiness. The characteristic temporal scales of unsteadiness in various SBLI configurations, including oblique SBLI (Touber & Sandham Reference Touber and Sandham2009; Nichols et al. Reference Nichols, Larsson, Bernardini and Pirozzoli2017; Pasquariello et al. Reference Pasquariello, Hickel and Adams2017) and backward step flows (Deshpande & Poggie Reference Deshpande and Poggie2020; Hu, Hickel & van Oudheusden Reference Hu, Hickel and van Oudheusden2021), have been investigated rigorously through DNS and large eddy simulation. To extract the dynamics of the unsteady flow, dynamic mode decomposition (DMD) has been employed widely (Schmid Reference Schmid2010, Reference Schmid2022; Tu et al. Reference Tu, Rowley, Luchtenburg, Brunton and Kutz2014; Kutz et al. Reference Kutz, Brunton, Brunton and Proctor2016; Taira et al. Reference Taira, Brunton, Dawson, Rowley, Colonius, McKeon, Schmidt, Gordeyev, Theofilis and Ukeiley2017), including in SBLI systems (Priebe et al. Reference Priebe, Tu, Rowley and Martín2016; Nichols et al. Reference Nichols, Larsson, Bernardini and Pirozzoli2017; Pasquariello et al. Reference Pasquariello, Hickel and Adams2017; Hu et al. Reference Hu, Hickel and van Oudheusden2021; Cao et al. Reference Cao, Hao, Klioutchnikov, Olivier and Wen2021a). Cao et al. (Reference Cao, Hao, Klioutchnikov, Olivier and Wen2021a) analysed the spanwise velocity of separated SBLI flow through DMD, and obtained the interaction characteristics of the shear layer and separation bubble. Pasquariello et al. (Reference Pasquariello, Hickel and Adams2017) and Hu et al. (Reference Hu, Hickel and van Oudheusden2021) obtained the modal characteristics of the shear layer and the relationship between the Görtler-like structures and the upstream pulsation through DMD in oblique SBLI and backward step flow, respectively. In this study, we apply DMD as a global analysis tool to extract the temporal scale of reattachment unsteadiness (RU) and compare it with our local statistical approach.
This study offers three contributions. First, we propose a local statistical approach to extract the spanwise and temporal scales of RU. Second, a self-sustained mechanism is proposed to understand the dynamics of RU. Third, the temporal scale, the maximum vorticity of RU and the friction advection speed are derived within the scenario of the self-sustained mechanism. The paper is organized as follows. In § 2, numerical methods, configurations, computational settings and validations of the DNS are introduced. In § 3, spatial and temporal scales of RU are detected by a local approach associating with the local reattachment upstream movement and validated with DMD. In § 4, a self-sustained mechanism is discussed in detail to understand RU. In § 5, we derive the temporal scale, the maximum vorticity and the friction advection speed. In § 6, we end with a conclusion.
2. Numerical simulations
2.1. Governing equations and numerical methods
DNS are utilized to investigate the unsteadiness of SBLI ramp flows. The non-dimensionalized conservative forms of the continuity, momentum and energy equations in curvilinear coordinates are considered:
 \begin{equation} \frac{\partial Q}{\partial t}+\frac{\partial (F-F_{\nu})}{\partial \xi}+\frac{\partial (G-G_{\nu})}{\partial \eta} +\frac{\partial (H-H_{\nu})}{\partial \zeta} =0, \end{equation}
where  $Q =J\{\rho, \rho u, \rho v, \rho w, \rho e\}$ denotes the conservative vector flux, with
 $\rho$ the density,
 $e$ the energy per volume,
 $(u,v,w)$ velocity components of horizontal, vertical and spanwise directions, respectively. Here,
 $J$ is the Jacobian matrix transforming Cartesian coordinates
 $(x,y,z)$ into computational coordinates
 $(\xi, \eta, \zeta )$. The inviscid flux
 $F$ and the viscous flux
 $F_{v}$ are defined as
 \begin{equation} F=
J\left[\begin{array}{@{}c@{}} \rho U^{*} \\ \rho uU^{*}+ p
\xi_{x}\\ \rho vU^{*} + p \xi_{y} \\ \rho wU^{*} + p
\xi_{z} \\ (\rho e+p) U^{*} \end{array}\right],\quad F_{v}=
J \left[\begin{array}{@{}c@{}} 0 \\ \sigma_{11} \xi_x +
\sigma_{21} \xi_{y} + \sigma_{31} \xi_{z} \\ \sigma_{12}
\xi_x + \sigma_{22} \xi_{y} + \sigma_{32} \xi_{z} \\
\sigma_{13} \xi_x + \sigma_{23} \xi_{y} + \sigma_{33}
\xi_{z} \\ S_{1} \xi_{x} + S_{2} \xi_{y} + S_{3} \xi_{z}
\end{array}\right],
\end{equation}
where
 \begin{equation} \left. \begin{gathered} U^{*}=(u \xi_{x}+v \xi_{y} + w \xi_{z})/\sqrt{\xi_{x}^2 + \xi_{y}^{2} + \xi_{z}^{2}},\\ \sigma_{i j}=2 \mu \left[ {\frac{1}{2}\left( {\frac{{\partial {u_i}}}{{\partial {x_j}}} + \frac{{\partial {u_j}}}{{\partial {x_i}}}} \right) - \frac{1}{3}\,\frac{{\partial {u_k}}}{{\partial {x_k}}}\,{\delta _{ij}}} \right],\\ {S_i} = \sigma_{ij}u_{j} - \frac{\mu }{{Pr\,(\gamma - 1) M_\infty ^2}}\,\frac{{\partial T}}{{\partial {x_i}}}. \end{gathered} \right\} \end{equation}
The flux terms  $G,G_{v},H,H_{v}$ in the
 $\eta$ and
 $\zeta$ directions have forms similar to those of
 $F$ and
 $F_{v}$. The pressure
 $p$ and temperature
 $T$ fulfil
 $p = \rho T / (\gamma Ma_{\infty }^{2})$, where the ratio of specific heat
 $\gamma$ is set to 1.4, and
 $Ma_{\infty }$ denotes the inflow Mach number. The subscript
 $\infty$ denotes the free-stream conditions. Quantities such as
 $\rho, u, v, p, T$ are normalized using their respective free-stream values. The Reynolds number per metre (
 $\textrm {m}^{-1}$)
 $Re_{\infty }$ and the Prandtl number
 $Pr$ are also employed. Viscosity
 $\mu$ follows the Sutherland law
 $\mu =({1}/{Re_{\infty }}) ({T^{3 / 2}(1+T_{s} / T_{\infty })}/({T+T_{s} / T_{\infty }}))$, with
 $T_{s} = 110.4\ \textrm {K}$ and
 $T_{\infty }=125\ \textrm {K}$.
The simulations are conducted using the in-house code OPENCFD-SC (Li, Fu & Ma Reference Li, Fu and Ma2008; Li et al. Reference Li, Fu, Ma and Liang2010). Inviscid flux terms are treated with Steger–Warming splitting and solved via the WENO-SYMBO method (Martín et al. Reference Martín, Taylor, Wu and Weirs2006; Wu & Martin Reference Wu and Martin2007), employing a nine-point central stencil and fourth-order accuracy. Viscous flux terms are calculated with an eighth-order central difference scheme. A third-order TVD-type Runge–Kutta method is used for time advance (Gottlieb & Shu Reference Gottlieb and Shu1998). More information about the numerical methodology can be found in Li et al. (Reference Li, Fu and Ma2008, Reference Li, Fu, Ma and Liang2010) and Martín et al. (Reference Martín, Taylor, Wu and Weirs2006). The code has been validated extensively and applied successfully in various cases, especially for compression ramp flows (Li et al. Reference Li, Fu and Ma2008, Reference Li, Fu, Ma and Liang2010; Hu et al. Reference Hu, Bi, Li and She2017, Reference Hu, Zhou, Wang, Yang and Tang2020a; Tong et al. Reference Tong, Tang, Yu, Zhu and Li2017; Zhou et al. Reference Zhou, Hu, Tang, Wang, Fang and Yang2021).
2.2. Configurations, computational set-up, mesh resolution and run time
In this study, two DNS cases with different ramp curvatures are conducted. The compression ramp configuration of the first case (denoted as DCR) pertains to the Aachen shock tube TH2 experimental set-up (Roghelia et al. Reference Roghelia, Olivier, Egorov and Chuvakhov2017), which consists of a flat plate with a sharp leading edge, and a tilted plate with angle  $\varphi = 15^\circ$. Both the flat plate and the tilted plate are
 $100\ \textrm {mm}$ in length (
 $L$). The configuration of the second case (denoted as CCR28) is akin to the first, but with a key difference: the sharp corner is replaced by a rounded one. The arc is tangent to both the flat plate and the tilted plate, starting at
 $x/L=0.72$, indicating that the radius of curvature is
 $r_{c}/L=(L-x)/\tan (\varphi /2)=2.13$. We can observe great reduction of the RU for the CCR28 case in § 2.4.
The Reynolds number based on the flat plate is  $Re_{L}=4.2\times 10^{5}$, and
 $Ma_{\infty }$ and
 $Pr$ are 7.7 and 0.7, respectively. The no-slip isothermal wall temperature
 $T_{w}=293$ K leads to
 $T_{w}/T_{\infty }=2.344$. The inflow is uniform and parallel to the plate, with non-dimensional velocity
 $U_{\infty }=1$ and density
 $\rho _{\infty }=1$, initiating at
 $x/L=-0.04$. The upper boundary is non-reflective, and the spanwise boundaries are periodic.
Both cases employ a computational mesh of  $1021 \times 251 \times 200$ nodes in the horizontal (
 $x$), vertical (
 $y$) and spanwise (
 $z$) directions. The physical domain measures
 $2.04L$ in length,
 $0.25L$ in height, and
 $L_{z}=0.3L$ in width. The grid for the DCR case is shown in figure 1. The choice of spanwise width has been considered about the flow's intrinsic instability (Gs et al. Reference Gs, Dwivedi, Candler and Nichols2018; Cao et al. Reference Cao, Hao, Klioutchnikov, Olivier and Wen2021a, Reference Cao, Hao, Klioutchnikov, Wen, Olivier and Heufer2022), as the largest wavelength of the unstable mode is approximately
 $0.3L$ (Cao et al. Reference Cao, Hao, Klioutchnikov, Olivier and Wen2021a). A sufficiently wide spanwise region, which is common in real flow, can stimulate all unstable modes. This is important in order to investigate the characteristics of the reattachment structures’ long-term unsteady evolution (after nonlinear saturation). The grid distribution consists of a uniform streamwise spacing with
 $\Delta x = 2 \times 10^{-3}L$, a uniform spanwise spacing
 $\Delta z = 1.5 \times 10^{-3}L$, and a clustered wall-normal grid near the wall with the first grid height set to
 $\Delta y= 8\times 10^{-5}L$. This configuration leads to DCR separation occurring at
 $x/L = 0.50$. Prior to separation, the flow remains steady laminar, with boundary layer thickness
 $\delta _{99}=0.01485L$ at
 $x/L=0.4985$, containing 95 nodes. The mesh resolution is adequate to resolve the boundary layer in the normal direction.
Computational grid for the DCR case (each 10th point in all dimensions is shown).

The dimensionless time step is set to  $\textrm {d}t\,U_{\infty }/L=1.5\times 10^{-4}$. The initial flow fields are generated by replicating the convergent two-dimensional flow of the corresponding
 $X$–
 $Y$ configuration in the spanwise direction. Statistics for the subsequent analysis are collected after the flows have fully developed. Some key parameters are summarized in table 1.
Flow parameters of DNS.

2.3. Cases validation
We validate the grid arrangements in both horizontal and vertical directions through the shock wave configuration, velocity, temperature profiles and pressure distributions. Figure 2 shows the density distributions for DCR and CCR28. The separation angle  $\theta _{s}$, angles of separation shock
 $\beta _{s}$ and reattachment shock
 $\beta _{r}$ show good agreement with the minimum viscous dissipation principle's prediction (Hu et al. Reference Hu, Zhou, Yang and Tang2020b). Figure 3(a) shows the velocity and temperature profiles at
 $x/L=0.36$ before interaction in the DCR case, which closely align with the similarity solution of compressible laminar boundary layer obtained through the Lees–Dorodnitsyn transformation (Anderson Reference Anderson2019) with the Chapman–Rubesin parameter set to 1. A slight deviation in temperature in
 $\eta = 1.5\unicode{x2013} 2$ may be attributed to the upstream viscous interaction and downstream separation disturbances.
Density distributions of (a) DCR, (b) CCR28. The separation angle  $\theta _{s}$, angle of separation shock
 $\beta _{s}$, and reattachment shock
 $\beta _{r}$ predicted by the minimum viscous dissipation principle (Hu et al. Reference Hu, Zhou, Yang and Tang2020b) are labelled.

(a) Velocity and temperature normal profiles of DCR at  $x/L=0.36$. The lines are DNS results, and the symbols are theory. (b) The
 $C_{p}$ distributions of DNS are compared with numerical (Cao et al. Reference Cao, Hao, Klioutchnikov, Olivier and Wen2021a) and experiment (Roghelia et al. Reference Roghelia, Olivier, Egorov and Chuvakhov2017) data, and inviscid
 $C_{p}$ values.

Pressure coefficient  $C_p$, skin friction coefficient
 $C_f$, and Stanton number
 $St$ are defined as
 \begin{equation} C_{p} = \frac{p_{w}-p_{\infty}}{0.5\rho_{\infty} U_{\infty}^2}, \quad C_{f}=\frac{\tau_{w}}{0.5\rho U_{\infty}^2}, \quad St= \frac{q_{w}}{\rho_{\infty} U_{\infty}(T_{aw}-T_{w})}, \end{equation}
where subscript  $w$ denotes the wall quantity,
 $\tau _{w}=\mu ({\partial u_{s}}/{\partial y_{n}})|_{y_{n}=0}$ is the wall friction,
 $u_{s}$ is the velocity streamwise projection,
 $y_{n}$ is the wall normal height,
 $q_{w}$ is the wall heat flux,
 $T_{aw}=T_{\infty }(1+r\,Ma_{\infty }^2\,(\gamma -1)/2)$ is the adiabatic wall temperature, and
 $r=\sqrt {Pr}$ is the recover factor (White Reference White2006). Here,
 $C_{p}$ of the inviscid pressure rise is calculated by
 $C_{p\_inv}=({4}/({\gamma +1}))(\sin ^{2}(\beta _{r}+\theta _{s})-{1}/{Ma^{2}_{\infty }})$. Figure 3(b) shows the distribution of
 $C_p$. The
 $C_{p}$ of DCR case is in good agreement with both numerical (Cao et al. Reference Cao, Hao, Klioutchnikov, Olivier and Wen2021a) and experimental (Roghelia et al. Reference Roghelia, Olivier, Egorov and Chuvakhov2017) data, accurately capturing features such as the length of the separation bubble and pressure rise at separation and reattachment. The deviation observed at the leading edge may be caused by the limited experimental resolution for small pressure differences, as reported by Cao et al. (Reference Cao, Hao, Klioutchnikov, Olivier and Wen2021a).
2.4. Unsteadiness and inhomogeneity of friction and heat flux
Figure 4(a) presents the spanwise-averaged distributions of  $C_{f}$ and
 $St$ for the DCR case. The black lines represent the time-averages over the entire post-development period, whereas the red and blue lines represent the upper and lower bounds of the instantaneous distributions, respectively. The distributions collapse before separation, revealing a steady inflow laminar boundary layer. However, as the flow progresses along the tilted plate, discrepancies begin to manifest, with the maximum
 $C_{f}$ deviation post-reattachment exceeding 26 %, and
 $St$ exceeding 20 %. In contrast, for the CCR28 case shown in figure 4(b), all distributions collapse once the flow is fully developed, suggesting that the unsteadiness is weak.
Spanwise-averaged  $C_{f}$ and
 $St$ distributions: (a) DCR, (b) CCR28. Black lines represent time-averaged results, red lines represent upper bound, and blue lines represent lower bound.

The unsteadiness of reattachment is accompanied by notable spanwise inhomogeneity. Figure 5 illustrates the streamwise velocity distributions near the  $X$–
 $Z$ bottom plane (at a height
 $y_{n}/L=8\times 10^{-5}$) along with the reattachment lines. Figure 5(a) reveals that the reattachment line for DCR is non-uniform across the span, with variations exceeding 0.24
 $L$, and the emergence of high-speed streaks downstream of the reattachment. To assess whether this inhomogeneity could be influenced by the spanwise boundary conditions, we further investigate a modified case with width
 $0.6L$, detailed in Appendix A. As a comparison, the CCR28 reattachment line, as shown in figure 5(b), exhibits a consistent uniformity across the span at
 $x=1.29L$, with no discernible structures near the reattachment.
Instantaneous streamwise velocity distributions after being fully developed on the  $X$–
 $Z$ plane at
 $y_{n}/L=8\times 10^{-5}$: (a) DCR, (b) CCR28. The white dashed line represents the reattachment line.

3. Spatial and temporal scales of RU
3.1. Overview of the typical process of RU
The RU process is closely related to high friction events. A representative RU event occurs in the region  $\varSigma _{(x, z)} = [1.1L,1.7L]\times [0.2L,0.25L]$ at a height
 $y_{n}/L=8\times 10^{-5}$ (close to the bottom plate). To closely examine its evolution, we zoom in on this area. Figure 6(a) depicts the initial state at
 $tU_{\infty }/L=2.25$, where
 $tU_{\infty }/L=0$ is the start of the statistical time. The hot-colour regions represent high streamwise velocity
 $U_{s}$, and the white dashed line denotes the local reattachment. As the RU event initiates, the reattachment near
 $(x,z)=(1.32L,0.21L)$ moves upstream, giving rise to a new pair of node and saddle, shown in figure 6(b). The local reattachment then accelerates upstream (figure 6c), persisting briefly through the period
 $tU_{\infty }/L=3.51\unicode{x2013} 4.95$, shown as figures 6(d,e). During this period,
 $U_{s}$ increases, indicating the formation of high-speed streaks. Once these structures dissipate, the reattachment cannot resist the adverse pressure gradient and retreats downstream (figure 6f). Simultaneously, the node and saddle merge (figure 6g). This RU event thus comes to an end as the local reattachment reaches the average reattachment position. Nonetheless, the surrounding unsteadiness triggers a new unsteady process, as illustrated in figure 6(h). This typical process was also observed by Kavun et al. (Reference Kavun, Lipatov and Zapryagaev2019) in laminar compression ramp flow as reattachment line pulsation, which underscores a strong connection between RU and high friction events. Recognizing this relationship motivates a detailed quantification of their length and temporal scales, potentially illuminating the characteristics of high friction (heat flux) structures.
A typical process of RU. (a) Initial state ( $tU_{\infty }/L=2.25$). (b) Emergence of streamwise vortex generates saddle and node (
 $tU_{\infty }/L=2.40$). (c) Quasi-streamwise vortex induces high-speed streak with local reattachment forward movement (
 $tU_{\infty }/L=3.09$). (d) Local reattachment reaches the most upstream (
 $tU_{\infty }/L=3.51$). (e) Local reattachment maintains (
 $tU_{\infty }/L=4.95$). (f) Dissipation of quasi-streamwise vortex with local reattachment downward movement (
 $tU_{\infty }/L=5.31$). (g) Merger of saddle and node (
 $tU_{\infty }/L=5.88$). (h) New unsteadiness structures born beside the location of dissipated old structure (
 $tU_{\infty }/L=6.03$).

3.2. Spatio-temporal statistics based on reattaching movement
A statistical approach based on the local reattachment pulsation (LRP) (Kavun et al. Reference Kavun, Lipatov and Zapryagaev2019) is proposed without incorporating artificial threshold settings. The central idea of this approach involves identifying the spanwise location and time when local reattachment attains its most upstream position. To define the length and temporal scales, the deviation of the reattachment streamwise coordinate  $x_{r}(z,t)$ from the spanwise-time-averaged reattachment
 $\hat {x}_{r}$ is considered. This deviation is directly related to the spatio-temporal distribution of
 $x_{r}(z,t)$ (Huang & Estruch-Samper Reference Huang and Estruch-Samper2018; Wu, Meneveau & Mittal Reference Wu, Meneveau and Mittal2020; Balantrapu, Alexander & Devenport Reference Balantrapu, Alexander and Devenport2023), as illustrated by the nephogram in figure 7(a). The hot-colour regions represent the time intervals and spanwise locations where
 $x_{r}$ occurs upstream of
 $\hat x_{r}$, i.e.
 $x_{r} < \hat x_{r}$, whereas the cold-colour regions represent
 $x_{r} > \hat x_{r}$, where
 \begin{equation} {\hat x_r} = \frac{1}{T_{I}L_{z}}\int_0^{T_{I}} {\int_0^{{L_z}} {{x_r}(z,t)\,{\rm d}z\,{\rm d}t} } = 1.31L, \end{equation}
where  $T_{I} = 30L/U_{\infty }$. Highly inhomogeneous reattachment dynamics are observed, with zones
 $z_{{int}} = \{[0,0.075L] \cup [0.225L, 0.3L]\}$ clustering active reattachment movements, while
 $z_{nint}= {L_z}/{z_{{int}} } = [0.075L, 0.225L]$ is associated with inactive reattachment movement. Spatially, i.e. for a given instance
 $t$, reattachment upstream movements in
 $z_{int}$ are often accompanied by local reattachment downstream movements on either side, with comparable scales. Temporally, i.e. for a given position
 $z \in z_{int}$, this position tends to experience local reattachment upstream and then downstream movement. This may be driven by the disturbances from quasi-streamwise vortices and high-speed streaks, which generate new structures nearby. Conversely, the structures in
 $z_{nint}$ appear less organized, and
 $x_{r}$ tends to remain quasi-steady.
(a) Spatio-temporal distribution of the local reattachment  $x_{r}(z,t)$. (b) Contours of significant reattachment motion (blue lines denote the reattachment
 $x_{r}/L=1.34$ contour, orange lines denote the reattachment
 $x_{r}/L=1.28$ contour). The spanwise position and time at which reattachment reaches its most upstream (local reattachment most upstream, LRMU)
 $(z_{MU},t_{MU})$ is marked with red symbols. The bars represent the neighbourhood of
 $(z_{MU},t_{MU})$ where
 $x_{r} = \hat {x}_{r}=1.31L$.

To quantify local reattachment's spatio-temporal distribution, we propose a statistical approach based on the neighbourhood properties of LRP (Kavun et al. Reference Kavun, Lipatov and Zapryagaev2019). Figure 7(b) highlights two specified contours from figure 7(a). The orange contours, set at  $x_r= \hat {x}_{r} - 0.03L$, outline the spatio-temporal structures with notable local reattachment upstream movement. The instance and location when that reattachment reaches its most upstream (MU) position
 $x_{r\_{MU}}$ locally, corresponding to a spatio-temporal coordinate (
 $z_{MU}, t_{MU}$), is labelled by a red symbol. Although a ‘
 $0.03L$’ threshold is used to outline these structures, the determination of
 $(z_{MU},t_{MU})$ relies primarily on the local dynamics of RU rather than the threshold itself. The blue contours represent
 $x_r= \hat {x}_{r} + 0.03L$, outlining downstream movement structures similarly. These occur with higher frequency in
 $z_{int}$, with multiple
 $x_{r}(z_{MU},t_{MU})$ being observed within a single upstream movement structure, indicating a coherent pattern of emergence. In contrast,
 $z_{nint}$ experiences fewer isolated upstream and downstream movement structures, suggesting a more stochastic and less organized generation process.
The spanwise neighbourhood  $\delta _z$ of (
 $z_{MU}, t_{MU}$) is denoted by the bar in figure 7(b) and
 $z \in \delta _z$ satisfying
 \begin{equation} x_{r}(z_{MU},t_{MU}) \leq x_{r}(z,t_{MU}) \leq \hat{x}_{r}. \end{equation}
The physical significance of  $\delta _z$ lies in its representation of the local spanwise scale of RU. Specifically,
 $\delta _z$ delineates a scenario where, at any given instance when local reattachment reaches its most upstream, the reattachment at the edges of
 $\delta _z$ remains aligned with the average reattachment location. The distances from the left and right neighbourhood of
 $\delta _z$ to
 $(z_{MU},t_{MU})$ are defined as
 $r^{-}$ and
 $r^{+}$, respectively, such that
 $\delta _z= r^{-} + r^{+}$. The mean values of
 $r^{-}$ and
 $r^{+}$ in
 $z_{int}$ and
 $z_{nint}$ are illustrated in figure 8(a), revealing no substantial difference between these two zones. We define the overall spanwise scale
 $\lambda _{LRP}$ by computing the average of
 $r^{-}$ and
 $r^{+}$ across the entire sample
 $N_{MU}$:
 \begin{equation} \left. \begin{gathered} r_{m}^{-} =\frac{1}{N_{MU}}\sum r^{-} = 0.0153L,\quad r_{m}^{+} =\frac{1}{N_{MU}}\sum r^{+} = 0.0163L,\\ \lambda_{LRP} = r_{m}^{-} + r_{m}^{+} = 0.0317L. \end{gathered} \right\} \end{equation}
(a) The distributions of  $r_{m}^{+}$ and
 $r_{m}^{-}$. (b) The
 $\delta _{z}$ scaling to different penetration lengths
 $L_{r}$ for ensembles
 $E_{1}$ and
 $E_{2}$.

As a comparison, the wavelength of heat flux streaks measured by experiments (corresponding to twice the length scale defined here) ranges from  $0.04L$ to
 $0.06L$ (Chuvakhov et al. Reference Chuvakhov, Borovoy, Egorov, Radchenko, Olivier and Roghelia2017; Roghelia et al. Reference Roghelia, Olivier, Egorov and Chuvakhov2017). From global stability analysis and DNS observations (Cao et al. Reference Cao, Hao, Klioutchnikov, Olivier and Wen2021a, Reference Cao, Hao, Klioutchnikov, Wen, Olivier and Heufer2022), the wavelengths observed are
 $0.033L$ (in the early stage) to
 $0.04L$ (in the later stage). The spanwise scale obtained by the LRP statistic
 $\lambda _{LRP}$ is consistent with the experimental and numerical measurements, and this approach is advantageous as it does not rely on any predefined threshold.
We further explore the relationship between  $\delta _z$ and the penetration length of LRP
 $L_{r} = \hat {x}_{r} - x_{r}(z_{MU},t_{MU})$. As discussed previously, the induced features in
 $z_{int}$ and
 $z_{nint}$ are different (see figure 7). To analyse these differences quantitatively, we categorize the samples into two ensembles: structures within
 $z_{int}$ as ensemble
 $E_{1}$, and those in
 $z_{nint}$ as ensemble
 $E_{2}$. We find that for
 $E_{1}$,
 $\delta _{z}$ increases with
 $L_{r}$, approximately following a power law
 \begin{equation} \delta_{z\_E1}/L = 0.106 (L_r/ L)^{0.476}, \end{equation}
where the exponent 0.476 is fitted from data. However, for  $E_{2}$, the relationship between
 $\delta _{z}$ and
 $L_{r}$ is not evident (figure 8).The positive correlation between spanwise and longitudinal scales of the LRP in
 $E_{1}$ indicates that a determinate mechanism should exist for the formation of structures in
 $E_{1}$. Conversely, the absence of a clear correlation in
 $E_{2}$ hints that the observed ‘structures’ could predominantly be attributable to random fluctuations in local reattachment, potentially caused by weak inflow disturbances.
The local temporal scale of RU can be quantified by measuring the intervals between events within the span defined by  $\lambda _{LRP}$. A local temporal scale
 $\tau _{MU}(z)$ in a certain spatio-temporal region
 $\varOmega _{TZ} = [0,T] \times [z-\lambda _{LRP}/2, z+\lambda _{LRP}/2]$ is the average duration of the lag between two events for which reattachment reaches its most upstream
 $\Delta t_{MU}(i|z)$:
 \begin{equation} \tau_{MU}(z) = \frac{1}{n_{MU}(z)-1} \sum_{i}^{n_{MU}(z)-1} \Delta t_{MU}(i|z), \end{equation}
where  $i$ is the index of the lag, and
 $n_{MU}(z)$ is the total count of reattachment at the most upstream in
 $\varOmega _{TZ}$. The intermittence of the unsteadiness
 $\tau _{MU\_rms}(z)$ is defined as
 \begin{equation} \tau_{MU\_rms}(z) = \sqrt{\frac{1}{n_{MU}(z)-2} \sum_{i}^{n_{MU}(z)-1} \left( \Delta t_{MU}(i|z) - \tau_{MU}(z) \right)^2}. \end{equation}
Figure 9 shows the distributions of  $\tau _{MU}(z)$ and
 $\tau _{MU\_rms}(z)$ at different
 $z/L$. The local temporal scales within
 $z_{int}$ generally range from
 $3L/U_{\infty }$ to
 $7L/U_{\infty }$. This shorter temporal scale signifies a more active RU process, suggesting frequent reattachment movements. On the other hand, in
 $z_{nint}$, the observed temporal scales typically exceed
 $10L/U_{\infty }$, pointing to less frequent and more sparse RU movements. For instance, in the middle section of
 $z_{nint}$, specifically for
 $z \in [0.1L, 0.15L]$, few reattachment movement events occur, resulting in scattered distributions and large
 $\tau _{MU}$. This dynamic is underscored by the intermittence measure
 $\tau _{MU\_{rms}}(z)$, which shows smaller intermittence in
 $z_{int}$ compared to the larger values observed in
 $z_{nint}$. To capture the overall temporal scale characteristics, we exclude outliers with
 $n_{Mu}(z) \leq 1$, and define the RU characteristic temporal scale as the mean of
 $\tau _{MU}(z)$:
 \begin{equation} \tau_{LRP} = \frac{U_{\infty}}{L}\,\frac{1}{N_{MU1}L_{z1}} \int_{\varOmega_{z0} } \sum_{i}^{n_{MU}(z)-1} \Delta t_{MU}(i|z) \,{\rm d}z = 5.22, \end{equation}
where  $\varOmega _{z0}=L_{z}/\varOmega _{z}(n_{MU}(z)=0)$ is the region excluding outliers,
 $L_{z1} = \int _{\varOmega _{z0}} 1 \,\textrm {d}z$ and
 $N_{MU1} = ({1}/{L_{z1}}) \int _{\varOmega _{z0}} (n_{MU}(z)-1) \,\textrm {d}z$. The RU characteristic intermittence temporal scale
 $\tau _{MU\_rms}$ is defined as the root mean square (r.m.s.) of
 $\tau _{MU}(z)$:
 \begin{align} \tau_{LRP\_rms} = \frac{U_{\infty}}{L}\sqrt{ \frac{1}{(N_{MU1}-1)L_{z1}} \int_{\varOmega_{z0} } \sum_{i}^{n_{MU}(z)-1} \left( \Delta t_{MU}(i|z) - \frac{L}{U_{\infty}}\,\tau_{LRP} \right)^2 {\rm d}z }= 3.96. \end{align}
(a) The RU characteristic temporal scale  $\tau _{MU}(z)$. (b) The the intermittence
 $\tau _{MU\_rms}(z)$ distribution. Colours represent the sample count, with lighter shades indicating a higher number of samples. The dashed lines represent the spanwise average values.

Equations (3.7) and (3.8) can be understood as conditional average and r.m.s. values for the region where  $n_{MU}(z)>1$. Cao et al. (Reference Cao, Hao, Klioutchnikov, Olivier and Wen2021a) observed broad-band low-frequency features of the Stanton number far beyond reattachment in a similar case, revealing a dominant temporal scale at approximately
 $6.66L/U_{\infty }$ at the centreline of their configuration, with notable spanwise variations. The temporal scale and spanwise dependency obtained through the LRP in this study align with the observations by Cao et al. (Reference Cao, Hao, Klioutchnikov, Olivier and Wen2021a). We note that a smaller temporal scale
 $1.54L/U_{\infty }$ (i.e. higher frequency) was detected by Kavun et al. (Reference Kavun, Lipatov and Zapryagaev2019) in Mach 6 laminar ramp flow, from the pressure fluctuation power spectrum density observed after reattachment. The higher Reynolds number in their cases may be the primary reason for the emergence of higher-frequency structures. Employing the statistical approach of LRP, the characteristic length and temporal scales
 $\lambda _{LRP}$ and
 $\tau _{LRP}$, respectively, are determined directly from the motion of coherent structures, without the imposition of any arbitrary thresholds. This approach is robust if the statistical period under consideration is sufficiently extended, ensuring that the derived scales are reflective of the inherent dynamics of the flow.
3.3. Temporal scale detection of RU based on DMD
We employed a global and problem-universal method, sparse promoted DMD (spDMD) (Jovanović, Schmid & Nichols Reference Jovanović, Schmid and Nichols2014), to examine the temporal scale obtained through the statistics of LRP. The fundamental principle of DMD involves constructing a linear dynamical evolution  $X_{i+1}=AX_i$, which effectively models the dynamical system with multiple observable snapshots
 $X_i$ (
 $i=1,\ldots,n$). Here,
 $A$ denotes the evolution coefficient matrix. Despite its inherent assumption of linearity, DMD demonstrates significant versatility. This adaptability makes it apt for handling nonlinear growth stages, and it is suitable to analyse the long-term development of structures in our study. To extract the most significant modes, spDMD (Jovanović et al. Reference Jovanović, Schmid and Nichols2014) is employed, which introduces a penalty factor to balance the reconstruction accuracy and the number of modes. In this study, we sample 1000 sequential slices with a sampling frequency
 $f_{s}L/U_{\infty }=100/3$, resulting in Strouhal numbers of the lowest and highest frequencies
 $Sr_{L,min}=1/30$ and
 $Sr_{L,max}=50/3$, respectively.
Figure 10(a) shows the eigenvalue distribution of  $U_{s}$ at the height
 $y_{n}/L=8\times 10^{-5}$ near the wall for the DCR case, where most of the eigenvalues distribute around the unit circle, indicating statistical stationarity. The sparse picking modes, labelled with red pluses, prefer low frequency and low decay rate, shown in figure 10(b).
(a) The DMD eigenvalues distribution of  $U_{s}$ at the height
 $y_{n}/L=8\times 10^{-5}$. (b) The DMD eigenvectors’ amplitudes at different frequencies and different growth/decay rates (inset). The selected modes by spDMD are labelled by red plus markers.

Figure 11 shows the real part of the modes selected by spDMD. The streaky structures appear at  $x/L \in [1.25, 1.96]$ for each non-zero
 $Sr$, indicating that spDMD captures broadband reattachment unsteady structures. Strong structures cluster in
 $z_{int}$, which is consistent with the structures captured by LRP results in figure 7. Low-frequency modes (e.g. figures 11b–d) exhibit mirror symmetry with the axis
 $z/L=0.15$, while high-frequency modes (figures 11e–h) do not exhibit such symmetry. The absence of strong structures near the separation bubble's wall indicates that the near-wall structures of the separation bubble do not directly trigger the reattachment structures. We may infer that generation of the reattachment high friction streak should be due to local self-induction at the reattachment or the perturbation transport through the reattaching shear layer. We will delve into this further in § 4.
The DMD mode eigenfunctions of  $U_{s}$.

The temporal scale of RU is determined by comparing dominant spDMD modes with two different penalty factors. The primary oscillation mode is characterized by the lowest growth/decay rate, large amplitude and a non-zero frequency. With a small penalty, 17 modes (including 8 conjugate modes) are selected, with mode 13 (figure 11h) exhibiting the lowest growth/decay rate with  $Sr_L=0.3737$, corresponding to a temporal scale
 $t_{DMD\_low}U_{\infty }/L=1/Sr_L=2.676$. A larger penalty selects 5 modes (two conjugate modes), retaining modes 0, 1 and 7 (figures 11a,b,h). Among these, mode 7 has the lowest growth/decay rate, and its temporal scale aligns with the dominant frequency obtained by Cao et al. (Reference Cao, Hao, Klioutchnikov, Olivier and Wen2021a) using power spectrum density,
 $t_{DMD\_up}U_{\infty }/L=1/Sr_L=5.935$. Despite a tendency for spDMD to favour low frequencies, it consistently retains mode 7 but not modes 3 and 5, indicating the robustness of mode 7's unsteady characteristic. We thus consider the temporal scale of RU to be within the interval
 $[t_{DMD\_low},t_{DMD\_up}]$, i.e.
 $t_{DMD}U_{\infty }/L\in [2.676,5.935]$. The consistency between
 $\tau _{LRP}$ and this interval highlights the agreement between these two methods in capturing the dynamics of RU.
It is important to note that while both power spectrum density and DMD are systematic methods for extracting dominant frequencies from time series data, they require adequate data and sampling frequency to avoid aliasing. The frequencies identified through these methods require further physical interpretation. In contrast, our approach, derived from statistical analysis of the spatio-temporal distributions, is problem-specific, and reveals directly the physical processes associated with its characteristic scale.
4. Self-sustained mechanism of RU
By observing the typical process of RU (figure 6) and the spatio-temporal distribution of the reattachment location (figure 7), it becomes evident that the RU process is intricately linked to the evolution of high friction structures. We propose a self-sustained mechanism to explain this process, and decompose it into four stages: (i) the instability of the separation bubble triggers primitive inhomogeneity in reattachment and the advection of vorticity; (ii) the baroclinic effect generates unsteady quasi-streamwise vortices; (iii) quasi-streamwise vortices induce high-speed streaks and reattachment upstream movement; (iv) quasi-streamwise vortices dissipation induces reattachment downstream movement and disturbances.
4.1. Stage 0: instability induced by the sharp corner
We focus on the primitive disturbance responsible for inhomogeneity in reattachment by comparing the structures in separation regions of DCR and CCR28. Figure 12 shows structures inside the separation bubble of the  $Y$–
 $Z$ plane at
 $x/L=1$, coloured by spanwise velocity
 $w$. The black dashed line
 $U_s=0.85$ is utilized to characterize the shear layer separating the separation bubble from the outflow. Configuration DCR exhibits a pair of vortices within the separation bubble (Cao et al. Reference Cao, Hao, Klioutchnikov, Olivier and Wen2021a), contrasted with CCR28, which exhibits no large structures but only weak disturbance near the shear layer. We note that the upstream conditions for DCR and CCR28 are identical before separation (shown in figure 2). These observations suggest that a weak upstream disturbance is insufficient to generate the strong RU shown in figure 5(a), whereas the coherent structures within the separation bubble play an important role.
Instantaneous  $w$ structures within the separation bubble at
 $x/L=1.0$: (a) DCR, (b) CCR28. The dashed line is the
 $0.85U_{\infty }$ contour to separate outer flow and the separation bubble. The green lines represent the streamlines in the
 $Y$–
 $Z$ plane.

Further detailed observations of the structures within the separation bubbles of DCR and CCR28 are illustrated by three-dimensional instantaneous visualizations, shown in figure 13. The side view displays a nephogram of  $p/p_{\infty }$ to illustrate the shock and separation, while the bottom view presents a
 $U_{s}$ nephogram highlighting the separation and reattachment lines. Structures are extracted via a threshold
 $w= \pm 0.02$ and are coloured by binary values depending on whether
 $U_{s} > 0$ or
 $U_{s} < 0$. Configuration DCR exhibits abundant structures within the separation bubble, contrasting with the absence of coherent structures within the CCR28 case. The instability prompted by the large curvature of the sharp corner (Ren & Fu Reference Ren and Fu2015; Chen, Huang & Lee Reference Chen, Huang and Lee2019; Hao Reference Hao2023) is thus closely connected to the structures inside the separation, which have been investigated by Gs et al. (Reference Gs, Dwivedi, Candler and Nichols2018) and Hildebrand et al. (Reference Hildebrand, Dwivedi, Nichols, Jovanović and Candler2018). These structures disturb the reattachment line, leading to spatial inhomogeneity and wrinkling, which is a key factor in the development of the downstream baroclinic mechanism (Zapryagaev et al. Reference Zapryagaev, Kavun and Lipatov2013; Dwivedi et al. Reference Dwivedi, Sidharth, Nichols, Candler and Jovanović2019).
Three-dimensional visualizations of  $w$ structures within the separation bubble: (a) DCR, (b) CCR28. The side view is the pressure nephogram. The bottom view is the
 $U_{s}$ nephogram with the separation and reattachment lines labelled by black lines. The structures are extracted by the threshold value
 $w= \pm 0.015$, and coloured using binary values for positive (red) and negative (blue)
 $U_{s}$.

4.2. Stage I: a generation mechanism of quasi-streamwise vortices – baroclinic effect
The generation of quasi-streamwise vortices initiates the RU process. We investigate the generation mechanism of quasi-streamwise vortices by analysing the leading-order terms of the inviscid streamwise vorticity perturbation equation (Dwivedi et al. Reference Dwivedi, Sidharth, Nichols, Candler and Jovanović2019):
 \begin{equation} \frac{{\partial {\omega _s}}}{{\partial t}} = \frac{{\partial \omega_{s}'}}{\partial t} \approx \underbrace { - {{\bar u}_s}\,\frac{{\partial \omega_{s}'}}{{\partial s}}}_{{advection}}\underbrace {{}- \frac{{\partial w'}}{{\partial s}}\,\frac{{\partial {{\bar u}_s}}}{{\partial n}}}_{{vortex \ tilting}} + \underbrace {\frac{1}{{{{\bar \rho }^2}}}\left(\frac{{\partial \bar \rho }}{{\partial n}}\,\frac{{\partial p'}}{{\partial z}}\right)}_{{baroclinic}}\underbrace {{}- 2\,\frac{{\bar u}_s}{R}\,\frac{{\partial u'_s}}{{\partial z}}}_{{centrifugal}}, \end{equation}
where  $s,n$ are the streamwise and normal components, quantity
 $\phi (s,n,z,t)$ is decomposed into a time-averaged part
 $\bar \phi (s,n,z) = \int {\phi (x,y,z,t)} \,\textrm {d}t$ and a perturbed part
 $\phi '=\phi -\bar \phi$, and
 $R$ is the local radius of curvature. According to (4.1),
 $\omega _{s}'$ can arise through three mechanisms: vortex tilt
 $P_{VT}= - ({{\partial w'}}/{{\partial s}})({{\partial {{\bar u}_s}}}/{{\partial n}})$, baroclinic
 $P_{BC}=({1}/{{{{\bar \rho }^2}}})(({{\partial \bar \rho }}/{{\partial n}})({{\partial p'}}/{{\partial z}}))$ and centrifugal
 $P_{cen}= - 2({{\bar u}_s}/{R})({{\partial u'_s}}/{{\partial z}})$, whereas the latter two have been frequently discussed in literature for the dominance (Zapryagaev et al. Reference Zapryagaev, Kavun and Lipatov2013; Gs et al. Reference Gs, Dwivedi, Candler and Nichols2018; Cao et al. Reference Cao, Klioutchnikov and Olivier2019, Reference Cao, Hao, Klioutchnikov, Olivier and Wen2021a; Dwivedi et al. Reference Dwivedi, Sidharth, Nichols, Candler and Jovanović2019; Kavun et al. Reference Kavun, Lipatov and Zapryagaev2019). We ascertain their dominance using DNS data.
For  $P_{cen}$, we extract the separation-reattachment streamline
 $\ell :y=y_{sr}(x)$, where the local radius of curvature
 $r_{sr}=(1+y'^2_{sr})^{3/2}/| y_{sr}''|$ reaches its local minimum in the neighbourhood of separation and reattachment, and
 $r_{sr} \sim O(2L)$. The corresponding Görtler number is
 $Go=\sqrt {L/(r_{sr} U_n /U_s}) \sim 4$, in agreement with Dwivedi et al. (Reference Dwivedi, Sidharth, Nichols, Candler and Jovanović2019). In the vicinity of the bottom plate,
 ${\bar U_s}/U_{\infty } \sim {U'_s}/U_{\infty } \sim O(10^{-1})$ (see figure 5a) and
 $z\sim L_{z}=0.3L$, we get
 \begin{equation} P_{cen} \sim O(10^{{-}1}\unicode{x2013}10^{{-}2})\,U^2_{\infty}/L^2. \end{equation}
For  $P_{BC}$,
 $\partial p'/\partial z$ is closely related to
 $w'$, as shown in Appendix B. We observe that the temporal scale of the initial stage of RU is approximately
 $L/U_{\infty }$ (figures 6a–d), and the variation of
 $w'$ is approximately
 $10^{-1}U_{\infty }$ (see figure 24 below). Combining the perturbed
 $w'$ equation (Gs et al. Reference Gs, Dwivedi, Candler and Nichols2018) with DNS data for magnitude analysis, we can get
 \begin{equation} \frac{\partial w'}{\partial t} \sim - \frac{1}{\bar{\rho}}\,\frac{\partial p'}{\partial z}, \end{equation}
thus
 \begin{equation} \frac{1}{\bar{\rho}}\,\frac{{\partial p'}}{{\partial z}} \approx \frac{{ \Delta w'}}{{\Delta t}} \sim \frac{10^{{-}1}U_{\infty}}{L/U_{\infty}} \sim O({10^{ - 1}}U^{2}_{\infty}/L). \end{equation}
The balance is consistent with the analysis by Gs et al. (Reference Gs, Dwivedi, Candler and Nichols2018), indicating that during the initial stage of RU,  $w'$ drives
 $\partial p'/\partial z$, thereby contributing to the baroclinic. In the near-wall region of reattachment, the scale of vortices correlates with the boundary layer thickness
 $O(L/10^{2})$, thus
 $({1}/{\bar \rho })({{\partial \bar \rho }}/{{\partial n}})\sim O(1/(L/10^{2}))\sim O(10^{2}/L)$. We obtain
 \begin{equation} {P_{BC}} =\left( \frac{1}{{\bar \rho }}\,\frac{\partial \bar \rho }{\partial n}\right)\left( \frac{1}{{\bar \rho }}\,\frac{\partial p'}{\partial z}\right) \sim (10^{2}/L) ({10^{ - 1}}U^{2}_{\infty}/L) \sim O\left(10\,\frac{U^{2}_{\infty}}{L^2}\right). \end{equation}
Comparing (4.2) and (4.5) indicates that baroclinic provides a stronger influence than centrifugal to generate quasi-streamwise vortices near the reattachment. Another observation is that both DCR and CCR28 exhibit nearly identical reattachment positions and reattachment/separation angles (shown in figure 2). Consequently, their reattachment streamline curvatures are virtually identical. However, DCR displays intense RU, in contrast to CCR28. This implies that the local baroclinic resulting from DCR's distinctive spanwise inhomogeneity plays a more pivotal role in triggering local vortices formation, as opposed to the similar centrifugal effect present in both cases. This result is consistent with the input/output analysis conducted by Dwivedi et al. (Reference Dwivedi, Sidharth, Nichols, Candler and Jovanović2019), which is in similar flow conditions with higher  $T_{w}/T_{\infty }$. We note that it is essential to distinguish between two types of ‘Görtler mechanism’ in the current flow study. One involves the instability associated with the large curvature of a sharp corner, as discussed in § 4.1, which is found within the separation bubble. The other arises near the reattachment point, potentially leading to Görtler instability due to the curvature of the reattachment streamline. As outlined in § 4.1, the former instability is significant in initiating the unsteady process. As for the latter type, combining with an order-of-magnitude analysis suggests that its role is less critical than that of the baroclinic (Dwivedi et al. Reference Dwivedi, Sidharth, Nichols, Candler and Jovanović2019) in contributing to the RU, at least in the present cases.
For the unsteady term in (4.1),  ${\omega _{s}'}\sim O(10U_{\infty }/L)$ (figure 14 and figure 15) when unsteadiness occurs, thus
 ${{\partial \omega _{s}'}}/{{\partial t}}\sim O(10({U_{\infty }}/{L})/(L/U_{\infty })) \sim O(10 U_{\infty }^2/{L^2})$, matching the magnitude of
 $P_{BC}$. This suggests that at the early stage of quasi-streamwise vortices generation, a dominant balance can be reduced as
 \begin{equation} \frac{\partial \omega_{s}'}{\partial t} \sim \frac{1}{{\bar \rho }^2}\,\frac{\partial \bar \rho}{\partial n}\,\frac{\partial p'}{\partial z}. \end{equation}
Instantaneous near-wall  $\omega _{s}$ distribution: (a) before the formation of the saddle and node at
 $tU_{\infty }/L=2.25$; (b) soon after the saddle and node formation at
 $tU_{\infty }/L=2.4$; (c) long after the saddle and node generation at
 $tU_{\infty }/L=3.09$.

Time series of  $U_{HSS}$,
 $\omega _{-}$,
 $U_{LSS}$ and
 $\omega _{+}$. (a) The arrangement of
 $U_{HSS}$,
 $\omega _{-}$,
 $U_{LSS}$ and
 $\omega _{+}$. The width of spanwise integral region
 $\varOmega _{z}$ is
 $0.01L$. (b) In span
 $z/L \in [0.2,0.24]$. (c) In span
 $z/L \in [0.19,0.23]$.

The formation of quasi-streamwise vortices is characterized by the dynamics of saddle–node pairs forming near the wall. In the initial stage of the local reattachment upstream movement, no saddles or nodes are observable (figures 6(a) and 14(a)). Once the reattachment progresses to a critical position, a saddle–node pair emerges at the root of the reattachment bulge due to the baroclinic effect (figure 14b). This formation adhering to the topological constraint that the numbers of saddles  $\varSigma _{S}$ and nodes
 $\varSigma _{N}$ must satisfy
 $\varSigma _{N}- \varSigma _{S}=2$ (Lighthill Reference Lighthill1953; Tobak & Peake Reference Tobak and Peake1982) for the limiting streamlines of three-dimensional flows. Following their formation, the node then moves towards the reattachment bulge, while the saddle remains relatively stationary (figure 14c). The behaviour of saddle–node pairs marks the dynamics of the quasi-streamwise vortices, i.e. the ejection of quasi-streamwise vortices contributes to the formation of saddles, and the sweep actions of these vortices result in the creation of nodes (Kavun et al. Reference Kavun, Lipatov and Zapryagaev2019).
4.3. Stage II: generation of high-speed streaks
The formation of high-speed streaks (high friction regions) is supposed to be closely related to the emergence of quasi-streamwise vortices (Waleffe Reference Waleffe1997; Wedin & Kerswell Reference Wedin and Kerswell2004). To investigate this correlation, we analyse the time series of local vorticity and velocity. As the coherent structures have spanwise drift, a narrow region average of negative vorticity structures  $\omega _{-}$ situated downstream of the reattachment bulge is defined as
 \begin{equation} \omega_{-} = \frac{\iint_{\varOmega_-}\omega_{s} \,{\rm d}\kern0.06em x\,{\rm d}z}{\iint_{\varOmega_-}1 \,{\rm d}\kern0.06em x\,{\rm d}z}, \end{equation}
where  $\varOmega _{-}=\varOmega _{x}\times \varOmega _{z-}$ is the integration region dominated by negative vorticity. We specify
 $\varOmega _{x} = [1.4L,1.6L]$, positioned downstream of the reattachment bugle, to characterize the development of vorticity or velocity, while minimizing contamination from other effects. The width of
 $\varOmega _{z-}$ is set at
 $0.01L$. The high-speed streaks velocity
 $U_{HSS}$, positive vorticity
 $\omega _{+}$ and low-speed streaks velocity
 $U_{LSS}$ are defined similarly.
Time series of  $\omega _{-},\omega _{+},U_{HSS},U_{LSS}$ in two characteristic regions are shown in figure 15. Figure 15(b) shows the data from
 $tU_{\infty }/L=2.4\unicode{x2013} 4.95$ with span
 $z/L \in [0.2,0.24]$, and figure 15(c) shows the data from
 $tU_{\infty }/L=21.9\unicode{x2013} 24.99$ with span
 $z/L \in [0.19,0.23]$. Key moments such as the onset, reaching most upstream and the end of the RU are labelled. The signs of
 $\omega _{+}$ (
 $\omega _{-}$) remain positive (negative) throughout the process, indicating their temporal stability. At the early stage of RU, the concurrent growth of
 $U_{HSS}$ and
 $\omega _{+}$ suggests a synchronous evolution. Specifically, when
 $\omega _{+}$ reaches its peak,
 $U_{HSS}$ is also at its maximum and the local reattachment is positioned at its most upstream. The correlation between quasi-streamwise vortices and high-speed streaks aligns with the scenario of wall-normal sweeps by quasi-streamwise vortices to generate streaks (Hamilton et al. Reference Hamilton, Kim and Waleffe1995; Waleffe Reference Waleffe1997; Jiménez & Pinelli Reference Jiménez and Pinelli1999; Graham & Floryan Reference Graham and Floryan2021).
The induction mechanism of high-speed streaks by quasi-streamwise vortices prompts further exploration into how vorticity correlates with the unsteady movement of reattachment. Figure 16 shows the time series of  $x_r$ at
 $z/L=0.2$ and
 $0.22$ alongside
 $\omega _{\varOmega }$ at
 $\varOmega =\varOmega _{x}\times \varOmega _{zi} (i=1,2)$, where
 $\varOmega _{x} = [1.4L, 1.6L]$,
 $\varOmega _{z1}=[0.2L, 0.21L]$ and
 $\varOmega _{z2}=[0.21L,0.22L]$, respectively. A negative correlation is apparent between
 $\omega _{\varOmega }$ and the deviation of the reattachment distance,
 $x_{r}-\hat x_r$, indicating an increase in
 $\omega _{\varOmega }$ correlates with a more marked deviation of
 $x_r$ from its mean position
 $\hat x_r$. Furthermore, stronger quasi-streamwise vortices entrain more high-speed outer flow into the near-wall region, thereby intensifying the activity of high-speed streaks and increasing wall friction, which in turn helps to resist stronger adverse pressure gradient.
Time series of  $\omega _{\varOmega }$ and reattachment streamwise locations
 $x_{r}/L$: (a)
 $\omega _{\varOmega }$ at
 $\varOmega _{x}\times \varOmega _{z}=[1.4L,1.6L]\times [0.2L,0.21L]$ and reattachment probed at
 $z=0.2L$; (b)
 $\omega _{\varOmega }$ at
 $\varOmega _{x}\times \varOmega _{z}=[1.4L,1.6L]\times [0.21L,0.22L]$ and reattachment probed at
 $z=0.22L$.

The relation between  $\omega _{\varOmega }$ and
 $x_{r}$ is quantified by the correlation coefficient
 $C_{\omega x_r}(z)$, defined as
 \begin{equation} {C_{\omega x_r}}(z) = \frac{1}{N - 1}\sum_t {\frac{(\left| {{\omega _\varOmega }(z,t)} \right| - \overline{\left| {{\omega _\varOmega }(z)} \right|})({x_r}(z,t) - \overline{{x_r}} (z))}{\sigma (\left| {{\omega _\varOmega }(z,t)} \right|)\,\sigma ({x_r}(z,t))}}, \end{equation}
where  $\varOmega =\varOmega _{x}\times \varOmega _{z}=[0.14L,0.16L]\times [z-0.00075L,z+0.00075L]$,
 $\sigma$ is standard deviation, and
 $N=1000$ is the number of statistics moments. Figure 17 illustrates spanwise distributions of
 ${C_{\omega x_r}}(z)$ and the time-averaged reattachment
 $\bar x_{r} = ({1}/{T}) \int _0^T {{x_r}(z,t)\,\textrm {d}t}$,
 $T= N/f_{s}=30L/U_{\infty }$. Within
 $z_{int}$ as defined in § 3.2,
 $x_r$ deviates significantly from
 $\bar x_r$, along with a distinct negative correlation with
 $\omega _\varOmega$. On the contrary, in the region
 $z_{nint}$,
 $x_r$ exhibits minimal variation, and the correlation between
 $\omega _\varOmega$ and
 $x_r$ is relatively weak. This observation is consistent with the spatio-temporal distribution of
 $x_r$ analysed in § 3.2, which highlighted that the presence of quasi-streamwise vortices is more abundant in
 $z_{int}$ compared to
 $z_{nint}$.
Spanwise distribution of vorticity–reattachment correlation coefficient  $C_{\omega x_r}(z)$ and the time-averaged reattachment
 $\bar {x}_{r}$.

4.4. Stage III: dissipation of quasi-streamwise vortices and high-speed streaks
After reattachment reaches the most upstream, the viscous effect become dominant, causing the dissipation of quasi-streamwise vortices. This marks the late stage of RU, as shown in figures 6(f,g). A notable feature is the substantial reduction in  $\omega _{s}$ (see figure 15), which occurs concurrently with the merging of saddle–node pairs. However, the dissipation of quasi-streamwise vortices does not conclude the RU; rather, it triggers new unsteadiness in the vicinity. Figure 18(a) shows the time series of the reattachment in
 $z_{int}$ at
 $z_{1}/L = 0.06$ and
 $z_{1} \pm 0.024$. We observe moments when the motion at
 $z_{1}$ is out of phase with the nearby motion, i.e. their directions of motion are opposite, as highlighted by grey frames. After a complete cycle of RU, which includes the generation and dissipation of quasi-streamwise vortices and high-speed streaks, reattachment continues to stimulate recurrent unsteady patterns. This pattern of behaviour is also noted at other locations, e.g.
 $z_{2}/L = 0.215$, at the middle of
 $\varOmega _{z2}$, as shown in figure 18(b). The strong correlation and quasi-periodic behaviour indicate that when the local reattachment moves downstream, it imparts momentum to both sides, generating new instability and unsteadiness.
Time evolution of  $x_{r}$ at different locations: (a) at
 $z/L=0.06L$ and
 $z/L=0.06L\pm 0.024L$; (b) at
 $z/L=0.215L$ and
 $z/L=0.215L\pm 0.024L$. The grey frames capture the time interval when the midline's
 $x_{r}$ and the values on both sides are out of phase.

This observation underscores the significance of the self-sustained process of quasi-streamwise vortices. If the reattaching flow lacked the self-sustained process, then the reattachment line would stabilize uniformly spanwise and remain steady following the initial dissipation of quasi-streamwise vortices, with no further RU observable after a sufficiently long simulation period. However, the current flow exhibits a different behaviour.
4.5. Summary of the self-sustained scenario of RU
The self-sustained scenario of RU can be summarized in figure 19. Initially, the main flow passes the corner, separating from the flat plate and reattaching on the tilted plate uniformly and steadily, thereby forming a separation bubble. As the separated flow encounters the sharp corner, instability ensues due to the large curvature, giving rise to large-scale Görtler-like vortices within the bubble. Some of this vorticity is advected downstream of the separation, while variations in  $w$ and
 $\omega _{s}$ perturb the pressure and density gradient near the reattachment. It leads to the baroclinic and inhomogeneity of the reattachment line, resulting in the formation of reattachment quasi-streamwise vortices. Pairs of quasi-streamwise vortices further sweep and generate high-speed streaks, which provide stronger adverse pressure gradient resistance and propel the reattachment line upstream. After the dissipation of quasi-streamwise vortices and high-speed streaks due to viscous effect, the reattachment moves downstream and the resultant disturbance triggers new unsteadiness nearby. This completes one cycle of the RU phenomenon.
The RU mechanism.

5. Estimation of the RU temporal scale and advection speed with self-sustained mechanism
5.1. Temporal scale analysis based on enstrophy production–dissipation
The temporal scale and vorticity magnitude scale of RU can be estimated through order of magnitude analysis of enstrophy production and dissipation within a self-sustained scenario, as follows. The full fluctuation streamwise enstrophy equation is
 \begin{align} \frac{{\partial {\omega}_s^{\prime2}}}{{\partial
t}} &=- {\bar u_s}\,\frac{{\partial {\omega}_s^{\prime2}}}{{\partial
s}} - 2\,{\omega '_s}\,\frac{{\partial
w'}}{{\partial s}}\,\frac{{\partial {{\bar
u}_s}}}{{\partial n}} + \frac{2}{{{{\bar \rho
}^2}}}\left(\frac{{\partial \bar \rho }}{{\partial
n}}\,\frac{{\partial p'}}{{\partial z}}\right){\omega '_s} \notag\\
&\quad - 4\,\frac{{{{\bar
u}_s}}}{R}\,\frac{{\partial {u'_s}}}{{\partial
z}}\,{\omega '_s} + \nu \left(\frac{{{\partial ^2}\omega '^2_s}}{{\partial
{n^2}}} - 2\left( {\frac{{\partial {\omega
'_s}}}{{\partial n}}} \right)^2\right).
\end{align}
At stage I of RU, the baroclinic effect dominates the production of enstrophy, as analysed in § 4:
 \begin{equation} \frac{{\partial \omega_s^{'2}}}{{\partial t}} \sim \frac{2}{{{{\bar{\rho}}^2}}}\left(\frac{{\partial \bar{\rho}}}{{\partial n}}\,\frac{{\partial p'}}{{\partial z}}\right){\omega^{'}_s}. \end{equation}
At stage III of RU, reattachment starts to move downstream with  ${{\partial {\omega '_s}^2}}/{{\partial t}} < 0$, shown in figure 16. The viscous effect dominates the dissipation of enstrophy:
 \begin{equation} \frac{{\partial {\omega '_s}^2}}{{\partial t}} \sim - \nu \left( {\frac{{\partial {\omega '_s}}}{{\partial n}}} \right)^2, \end{equation}
where we assume  ${\partial ^{2}\omega _{s}^{\prime 2}}/{\partial n^{2}} \approx ({\partial \omega _{s}^{\prime }}/{\partial n})^{2}$. When the reattachment maintains at the most upstream, baroclinic balances with viscous:
 \begin{equation} {-}\frac{2}{{{{\bar \rho }^2}}}\left(\frac{{\partial \bar \rho }}{{\partial n}}\,\frac{{\partial p'}}{{\partial z}}\right){\omega '_s} \sim \nu \left( {\frac{{\partial {\omega '_s}}}{{\partial n}}} \right)^2. \end{equation}
From (5.3), we estimate the temporal scale of reattachment downstream movement  $\tau _{RDM}$:
 \begin{equation} \tau_{RDM} \sim \delta^{2}_{vis}/\nu_{w}, \end{equation}
where  $\nu _{w} = \mu _{w}/\rho _{w} \sim O(10^{-6}U_{\infty }L)$, and
 $\delta _{vis}$ is the length scale dominated by the viscous effect. At the edge of
 $\delta _{vis}$, the viscous term of the momentum equation balances with the advection term:
 $\nu _{w}({U_{vis}}/{\delta ^{2}_{vis}}) \sim ({U^{2}_{vis}}/{\ell _{x}})$. As shown in figure 5(a),
 $U_{vis} \sim O(10^{-1}U_{\infty })$ and
 $\ell _{x}$ is the distance toward the reattachment line, estimated by the penetration length defined in § 3.2 as
 $\ell _{x} \sim L_{r} \sim O(10^{-1}L)$. We further obtain
 \begin{equation} \delta_{vis} = \sqrt{\frac{\nu_{w} U_{vis}}{U^{2}_{vis}/\ell_{x}}} \sim O(10^{{-}3}L). \end{equation}
We finally get
 \begin{equation} \tau_{RDM} \sim \delta^{2}_{vis}/\nu_{w} \sim O(L/U_{\infty}). \end{equation}
From (5.2)–(5.4), the temporal scale of reattachment upstream movement  $\tau _{RUM}$ is the same as
 $\tau _{RDM}$, i.e.
 $\tau _{RUM} \approx \tau _{RDM}$. The temporal scale of RU is estimated as
 \begin{equation} \tau_{theory}=2(\tau_{RUM} + \tau_{RDM}) \sim \frac{4L}{U_{\infty}}. \end{equation}
The theoretical analysis is consistent with the measurement of (3.7) in § 3.2 and figure 15. Small deviation may be caused by the enstrophy transportation from the separation bubble by the advection of vorticity, as discussed in § 4.1. We also estimate the maximum  $|\omega '_{s} |$ from (5.4) as
 \begin{equation} \left| \omega '_s \right| \sim \left|\left. \frac{2}{{\bar \rho }^2}\left(\frac{\partial \bar \rho }{\partial n}\,\frac{\partial p'}{\partial z}\right) \right/ \frac{\nu_{w}}{\delta^{2}_{vis}} \right|. \end{equation}
 \begin{equation} \left| \omega '_s \right| \sim\left. \frac{2 \times 10^{1}U_{\infty}^{2}}{L^2} \right/ \frac{U_{\infty}}{L} \sim 20\,\frac{U_{\infty}}{L}. \end{equation}
The magnitude of maximum  $|\omega '_{s} |$ is consistent with the measurements shown in figures 15 and 16.
5.2. Advection speed of wall friction
In addition to identifying the temporal and vorticity scales, we have also observed the advection of structures, manifesting as oblique stripes on the spatio-temporal map  $C_{f}(x,t)$. Figure 20 shows these maps at the locations
 $z/L=0.075$ (in
 $z_{int}$) and
 $z/L=0.15$ (in
 $z_{nint}$), with the black dash-dotted lines enclosing the separated regions. Distinct oblique lines separate high and low
 $C_{f}$ zones downstream of the reattachment, indicating a nearly constant advection speed of quasi-streamwise vortices.
The  $C_{f}$ distribution of the DCR case for different
 $tU_{\infty }/L$ and
 $x/L$ at fixed
 $z/L$: (a)
 $z/L=0.075$, (b)
 $z/L=0.15$. The theoretical estimations of advection speed are given by the green line (
 $U_{cf}=0.64$) and blue line (
 $U_{cf}=0.75$).

The advection speed  $U_{cf}$ is estimated by a model that combines laminar boundary layer theory with coherent structures based on three hypotheses.
First,  $U_{cf}$ is determined by the advection velocity of quasi-streamwise vortices embedded in the reattached boundary layer. This assumption is supported by the observation that these vortices induce high
 $C_{f}$ by generating high-speed streaks. As the vortices advect downstream, the enhanced
 $C_{f}$ disappears. Consequently,
 $U_{cf}$ can be interpreted as the streamwise velocity at the centre of quasi-streamwise vortices
 $U_{SV}(\,y=0.5h_{SV})$, i.e.
 \begin{equation} U_{cf} = U_{SV}(\,y=0.5h_{SV}), \end{equation}
where  $h_{SV}$ is the height of the quasi-streamwise vortices.
Second, quasi-streamwise vortices extend throughout the entire height  $\delta _{BL}(x)$ of the reattached boundary layer, i.e.
 $h_{SV}(x) \sim \delta _{BL}(x)$, which differs from the coherent structures in the turbulent boundary layer (Kline et al. Reference Kline, Reynolds, Schraub and Runstadler1967; Robinson Reference Robinson1991; Adrian Reference Adrian2007; Jiménez Reference Jiménez2018).
Third, in the absence of quasi-streamwise vortices, the reattached boundary layer can be treated as a compressible laminar boundary layer, with the reattachment point acting as the leading edge, i.e.  $U_{BL}/U_{\infty }=f(\,y/\delta )$. It is assumed that the emergence of a pair of quasi-streamwise vortices primarily affects the spanwise and normal velocities, with negligible modulation of the streamwise velocity, i.e.
 $U_{SV} \sim U_{BL}$. Based on the above hypotheses, we can obtain
 \begin{equation} \begin{aligned}[b] {U_{cf}} & \sim {U_{SV}}(\,y = 0.5{h_{SV}})\\ & \sim {U_{BL}}(\,y = 0.5{\delta _{BL}})\\ & \sim {U_{\infty} }\,f(\eta = 0.5\eta_{edge}), \end{aligned} \end{equation}
where  $f$ can be approximated to be a compressible Blasius type. For
 $Ma_{\infty }=7.7$, we take the heights of
 $U_{e1}=0.95U_{\infty }$ and
 $U_{e2}=0.99U_{\infty }$ as the edge of the boundary layer, and the corresponding normalized heights are
 $\eta _{edge1}=2.70$ and
 $\eta _{edge2}=3.33$, respectively. The advection velocities are
 \begin{equation} \left. \begin{gathered} U_{cf1} = {U_\infty }\,f(0.5\eta_{edge1}) = 0.64,\\ U_{cf2} = {U_\infty }\,f(0.5\eta_{edge2}) = 0.75. \end{gathered} \right\} \end{equation}
The predictions  $U_{cf1}$ (green line) and
 $U_{cf2}$ (blue line) are compared with the DNS results, shown in figure 20, for both
 $z/L=0.075$ and
 $z/L=0.15$. These predictions exhibit good agreement with the observed DNS data. A slight overestimation may be attributed to the actual lower outer flow velocity, as the inflow passes through the reattachment shock. For comparison, Cao et al. (Reference Cao, Hao, Klioutchnikov, Olivier and Wen2021a, Reference Cao, Hao, Klioutchnikov, Wen, Olivier and Heufer2022) conducted a two-point spatio-temporal correlation of fluctuation of the wall Stanton number to quantify the advection speed. Their findings indicated an advection speed range from
 $0.5U_{\infty }$ to
 $0.7U_{\infty }$. Our predictions align with their measurement. We also note that the above analysis is specific to
 $Ma_{\infty }$ and
 $T_{w}/T_{\infty }$ (to determine the compressible Blasius boundary layer). The independence of
 $Re_{x}$ and the geometry suggests that
 $U_{cf}$ remains constant for the compression ramp flows with different curvatures. This is further supported by the CCR28 case, shown in figure 21.
The  $C_{f}$ distribution of the CCR28 case for different
 $tU_{\infty }/L$ and
 $x/L$ at fixed
 $z/L$: (a)
 $z/L=0.075$, (b)
 $z/L=0.15$. The theoretical estimations of advection speed are given by the green line (
 $U_{cf}=0.64$) and blue line (
 $U_{cf}=0.75$).

6. Conclusion
This study investigates the scales and mechanism of reattachment unsteadiness (RU) in compression ramp flow with Mach 7.7 laminar inflow and different curvatures after being fully developed. DNS results for the the sharp ramp (DCR) case reveals that the reattachment line exhibits inhomogeneity, and wall friction and heat flux exhibit persistent, intense fluctuations, consistent with the experimental (Zapryagaev et al. Reference Zapryagaev, Kavun and Lipatov2013; Chuvakhov et al. Reference Chuvakhov, Borovoy, Egorov, Radchenko, Olivier and Roghelia2017; Roghelia et al. Reference Roghelia, Olivier, Egorov and Chuvakhov2017) and numerical (Kavun et al. Reference Kavun, Lipatov and Zapryagaev2019; Cao et al. Reference Cao, Hao, Klioutchnikov, Olivier and Wen2021a) observations. This contrasts with the conventional understanding of a steady, homogeneous reattachment in pure laminar compression ramp flow (Hu et al. Reference Hu, Zhou, Wang, Yang and Tang2020a; Tang et al. Reference Tang, Wang, Xie, Zhou, Hu and Yang2021; Zhou et al. Reference Zhou, Hu, Tang, Wang, Fang and Yang2021; Hu et al. Reference Hu, Zhou, Tang, Wang, Yang and Tang2024), for example, the CCR28 case in this study.
In order to illuminate the reattachment unsteady motion, a local structure-based approach is proposed to identify its spatio-temporal distribution. It is based on the local reattachment pulsation (LRP) (Kavun et al. Reference Kavun, Lipatov and Zapryagaev2019), and detects low-frequency, structural related events without reliance on artificial thresholds. It is found that the spanwise scale of RU is  $\lambda _{LRP}/L=3.17$, with a temporal scale
 $\tau _{LRP}U_{\infty }/L=5.22$ in the current case, which falls within the interval obtained from sparse promoted dynamic mode decomposition. The spatio-temporal distribution of LRP enables the differentiation between regions of strong unsteadiness
 $z_{int}$, and weak unsteadiness
 $z_{nint}$ (Cao et al. Reference Cao, Hao, Klioutchnikov, Olivier and Wen2021a), with different spanwise scaling characteristics.
A four-stage self-sustained mechanism is proposed to explain RU. First, the intrinsic instability of the separation bubble (Gs et al. Reference Gs, Dwivedi, Candler and Nichols2018; Cao et al. Reference Cao, Hao, Klioutchnikov, Olivier and Wen2021a) of the DCR case gives rise to large-scale structures inside the separation, triggering vorticity advection and inhomogeneous reattachment, while no discernible structure is observed in the CCR28 case. Second, the inhomogeneity leads to the pressure spanwise gradient and density normal gradient being non-orthogonal, resulting in a baroclinic effect that generates quasi-streamwise vortices more efficiently than a centrifugal effect (Dwivedi et al. Reference Dwivedi, Sidharth, Nichols, Candler and Jovanović2019). Third, the sweep of pairs of these vortices induces high-speed streaks, advancing the reattachment line upstream with stronger adverse pressure gradient resistance. Finally, viscous dissipation of quasi-streamwise vortices shifts the reattachment line downstream, triggering instability for the next RU cycle. This process involves the intrinsic instability of the separation bubble and the baroclinic generation and viscous dissipation of quasi-streamwise vortices.
The self-sustained scenario further supports the estimation of temporal scale and maximum vorticity magnitude with enstrophy. Upstream reattachment movement is dominated by the baroclinic generation of enstrophy, while downstream movement is due to viscous dissipation. The friction advection velocity can be estimated via the transport of quasi-streamwise vortices in the reattachment boundary layer. The estimation  $0.64 \sim 0.75 U_{\infty }$ is consistent with DNS data and previously reported correlations (Cao et al. Reference Cao, Hao, Klioutchnikov, Olivier and Wen2021a, Reference Cao, Hao, Klioutchnikov, Wen, Olivier and Heufer2022).
The above mechanism and scale analysis offer potential approaches to control the high-amplitude reattachment fluctuations, such as breakdown of the large-scale structures within the separation bubble, and manipulating reattaching inhomogeneity. Two significant issues warrant further exploration in the future. Given that multiple length scales exist in RU, such as the flat plate length  $L$, penetration scale
 $L_r$, and spanwise scale
 $\lambda _{LRP}$, it is necessary to conduct experiments and simulations with varying inflow Mach numbers and corner angles to more accurately determine the intrinsic normalizing scale. Additionally, further investigation into the separability of the baroclinic effect and the instability of the separation bubble should be pursued to deepen our understanding of this complex phenomenon.
Acknowledgements
We are grateful to Professor T. Zhu, X. Chen, L. Zhao and M.-J. Xiao for helpful discussions about the nature of the unsteadiness, and Professor X.-L. Li for his simulation code and helpful discussions. We also thank three anonymous referees for their constructive comments.
Funding
This work was supported by the National Key R&D Program of China (grant no. 2019YFA0405300) and National Nature Science (China) Fund nos 12102449 and 12302309. Y.-C.H. and G.W. acknowledge partial support by CARDC Fundamental and Frontier Technology Research Fund nos PJD 20190256 and 20190075.
Declaration of interests
The authors report no conflict of interest.
Appendix A. Validation of RU by doubling the spanwise width
The spanwise width set in § 2.2 is designed to be slightly wider than the width corresponding to the unstable wavelength under the current geometry and boundary conditions Cao et al. (Reference Cao, Hao, Klioutchnikov, Olivier and Wen2021a), and a periodic boundary condition is employed. In this appendix, we double the spanwise width to exclude the possibility that the unsteady phenomena under investigation are influenced by inappropriate spanwise boundary conditions.
For this validation, we expand the width to  $L_z = 0.6L$ and simultaneously double the number of spanwise grids, thereby maintaining the original spanwise resolution. We refer to this configuration as ‘DCR-0.6L’ to distinguish it from the previously analysed DCR case, which has width
 $0.3L$. We first examine the instantaneous spanwise inhomogeneity. As depicted in figure 22, the streamwise velocity distributions near the
 $X$–
 $Z$ bottom plane (at height
 $y_{n}/L = 8 \times 10^{-5}$) and the instantaneous reattachment for width
 $0.6L$ are similar to the observations at
 $0.3L$ (figure 5). However, the DCR-0.6L case exhibits twice as many high-speed structural regions across the span, including a set located in the middle of the flow field's span, confirming that the emergence of these structures is not dependent on the spanwise boundary conditions (once the spanwise width exceeds the unstable wavelength) but is an intrinsic characteristic of the flow.
Instantaneous streamwise velocity distributions after being fully developed on the  $X$–
 $Z$ plane at
 $y_{n}/L=8\times 10^{-5}$ with spanwise width
 $0.6L$. The white dashed line is the reattachment line.

In figure 23, we validate the impact of the spanwise width on the LRP. The spanwise-time-averaged reattachment  $\hat {x}_{r}$ for both DCR-0.6L and DCR is positioned at at
 $x=1.31L$. Similar to figure 7, the spatio-temporal distribution of local reattachment
 $x_r(z,t)$ for DCR-0.6L is shown in figure 23(a). It shows two regions of active reattachment movement (two subregions connected by the spanwise periodic boundary are considered as one region) and two regions of inactive movement, doubling what was observed in the
 $0.3L$ DCR case. In figure 23(b), we extract instances and spanwise positions where reattachment reaches its most upstream position. Similar to figure 7(b), multiple LRPs are observed within a single structure. The upstream and downstream movements of reattachment are staggered in both spanwise and temporal dimensions, indicating the self-sustained nature of RU. Utilizing the same statistical approach provided in § 3.2, the spanwise scale
 $\lambda _{LRP-0.6L}/L = 0.290$ and temporal scale
 $\tau _{LRP-0.6L}U_{\infty }/L = 4.74$ for DCR-0.6L differ by less than 10 % from the
 $0.3L$ cases. Considering that DCR-0.6L is a new realization of the flow, this consistency underscores the robustness of the statistical approach to quantify the length and temporal scales of the RU accurately.
(a) Spatio-temporal distribution of the local reattachment  $x_{r}(z,t)$ with spanwise width
 $0.6L$. (b) Contours of significant reattachment motion. The meanings of the blue lines, orange lines and red symbols are the same as in figure 7.

Appendix B. Correlation of  $\partial p'/\partial z$ and $w'$


The evolution of  $w'$ can be approximated as (Gs et al. Reference Gs, Dwivedi, Candler and Nichols2018)
 \begin{equation} \frac{{\partial w}}{{\partial t}} = \frac{{\partial w'}}{{\partial t}} =- {\bar u_j}\,\frac{{\partial w'}}{{\partial {x_j}}} - \frac{{(\rho {u_j})'}}{{\bar \rho }}\,\frac{{\partial \bar w}}{{\partial {x_j}}} - \frac{1}{{\bar \rho }}\,\frac{{\partial p'}}{{\partial z}} + \frac{\mu }{{\bar \rho }}\,\frac{{{\partial ^2}w'}}{{\partial {x_j}\,\partial {x_j}}}. \end{equation}
Figure 24(a) shows the instantaneous spatial distributions of  $\partial p'/\partial z$ and
 $w'$, indicating their correlation, i.e. the smaller
 $\partial p'/\partial z$, the larger
 $w'$, in the near-wall region. This relation is also evident in the time series of
 $\partial p'/\partial z$ and
 $w'$ at
 $(x,y,z)=(0.13L,8\times 10^{-5}L, 0.21L)$ as presented in figure 24(b).
(a i) Nephogram of  $\partial p'/\partial z$; (a ii) nephogram of
 $w'$ at
 $tU_{\infty }/L=2.64$. (b) Time series of
 $\partial p'/\partial z$ and
 $w'$ at
 $(x,y,z)=(0.13L,8\times 10^{-5}L, 0.21L)$.



