I. INTRODUCTION
Luminescent materials are generally composed of a host material and a dopant, having wide applications such as cathode ray tube, color display, field emission display, optoelectronic devices, etc. (Nikl et al., Reference Nikl, Pejchal, Mihokova, Mares, Ogino, Yoshikawa, Fukuda, Vedda and Ambrosio2006). Rare earth ions are often used as activation centers for the abundant energy level structure. Through doping with rare earth ions, some excellent luminescent materials have been found (Pidol et al., Reference Pidol, Kahn-Harari, Viana, Ferrand, Dorenbos, De Hass, Van Eijk and Virey2003). However, it is well known that low doping of rare earth ions in a compound leads to weak luminescence, while heavy doping caused “concentration quenching” of luminescence, which greatly reduced luminescence efficiency of doped rare earth ions (Dotsenko et al., Reference Dotsenko, Berezovskaya, Efryushina, Voloshinovskii and Stryganyuk2010). Thus, it is very important to explore proper host material with large doping tolerance.
Researches show that when using materials with larger anionic groups (such as BO3, B3O6, PO4, or WO4, etc.) serving as the host material, the rare earth ions will be spaced out, and the “concentration quenching” process would scarcely occur. This phenomenon provides a direction to search for new luminescent materials. Many borate compounds show nonlinear optical properties, high transmittance in the ultraviolet (UV) region, and large birefringence (He et al., Reference He, Chen, Lan, Li and Xu2001, Reference He, Chen, Okudear and Simon2005; Wu et al., Reference Wu, Chen, Li, He, Xu and Li2005; Cai et al., Reference Cai, He, Chen, Wang, Lou, Chen and Zhao2007). SmBa3B9O18, one of the isostructural borate compounds REBa3B9O18 (RE = Sm, Gd, Tb, Lu, Y etc.) (Li et al., Reference Li, Wang, Chen, Li, Jia, Wu and Du2005), adopts a centric space group P63/m with unit-cell parameters a = 7.1980 Å and c = 17.336 Å, as shown in Figure 1. Three BO3 planar groups form a planar hexagonal [B3O6]3− ring. These planar rings are parallel to each other and stack along the c-axis in the unit cell, with SmO6, BaO6, and BaO9 polyhedra in between the hexagonal [B3O6]3− rings. Owing to the parallel planar hexagonal [B3O6]3− rings in the lattices, perhaps it might act as a potential host material for a new luminescent material through activators doping.
The crystal structure of SmBa3B9O18.

In this paper, we report the synthesis and luminescence properties of europium doped SmBa3B9O18. The dependence of luminescence intensity on Eu3+ concentration shows that no concentration quenching processes occur, which implies that SmBa3B9O18 is a potential host material and europium-doped SmBa3B9O18 may find application in display and optical devices. This work will be helpful to explore new luminescent materials.
II. EXPERIMENTAL
Polycrystalline europium-doped SmBa3B9O18 powder was synthesized from analytical reagents: Sm2O3, Eu2O3, BaCO3, and H3BO3. The high-temperature sintering method was adopted to prepare the Sm(1−x)EuxBa3B9O18 (x = 0.2, 0.4, and 0.6) materials. Weighted raw materials were fully ground into powders and mixed uniformly in an agate mortar, and then they were placed in the box-type resistance heating furnace. The mixtures were preheated at 400 °C for 1 h to let BaCO3 and H3BO3 decompose slowly, and then sintered at 860 °C for 3 days with intermediate grindings.
The as-prepared samples were checked by powder X-ray diffraction (XRD), energy dispersive X-ray spectroscopy (EDS), and scanning electron microscopy (SEM, SEM-JMS6360LV). The XRD patterns were measured on an X-ray Rigaku diffractometer D/Max-2400 with CuKα radiation (40 kV, 140 mA) at room temperature. The emission and excitation spectra were recorded using a Hitachi-F4500-FL spectrofluorometer equipped with a xenon lamp.
III. RESULTS AND DISCUSSION
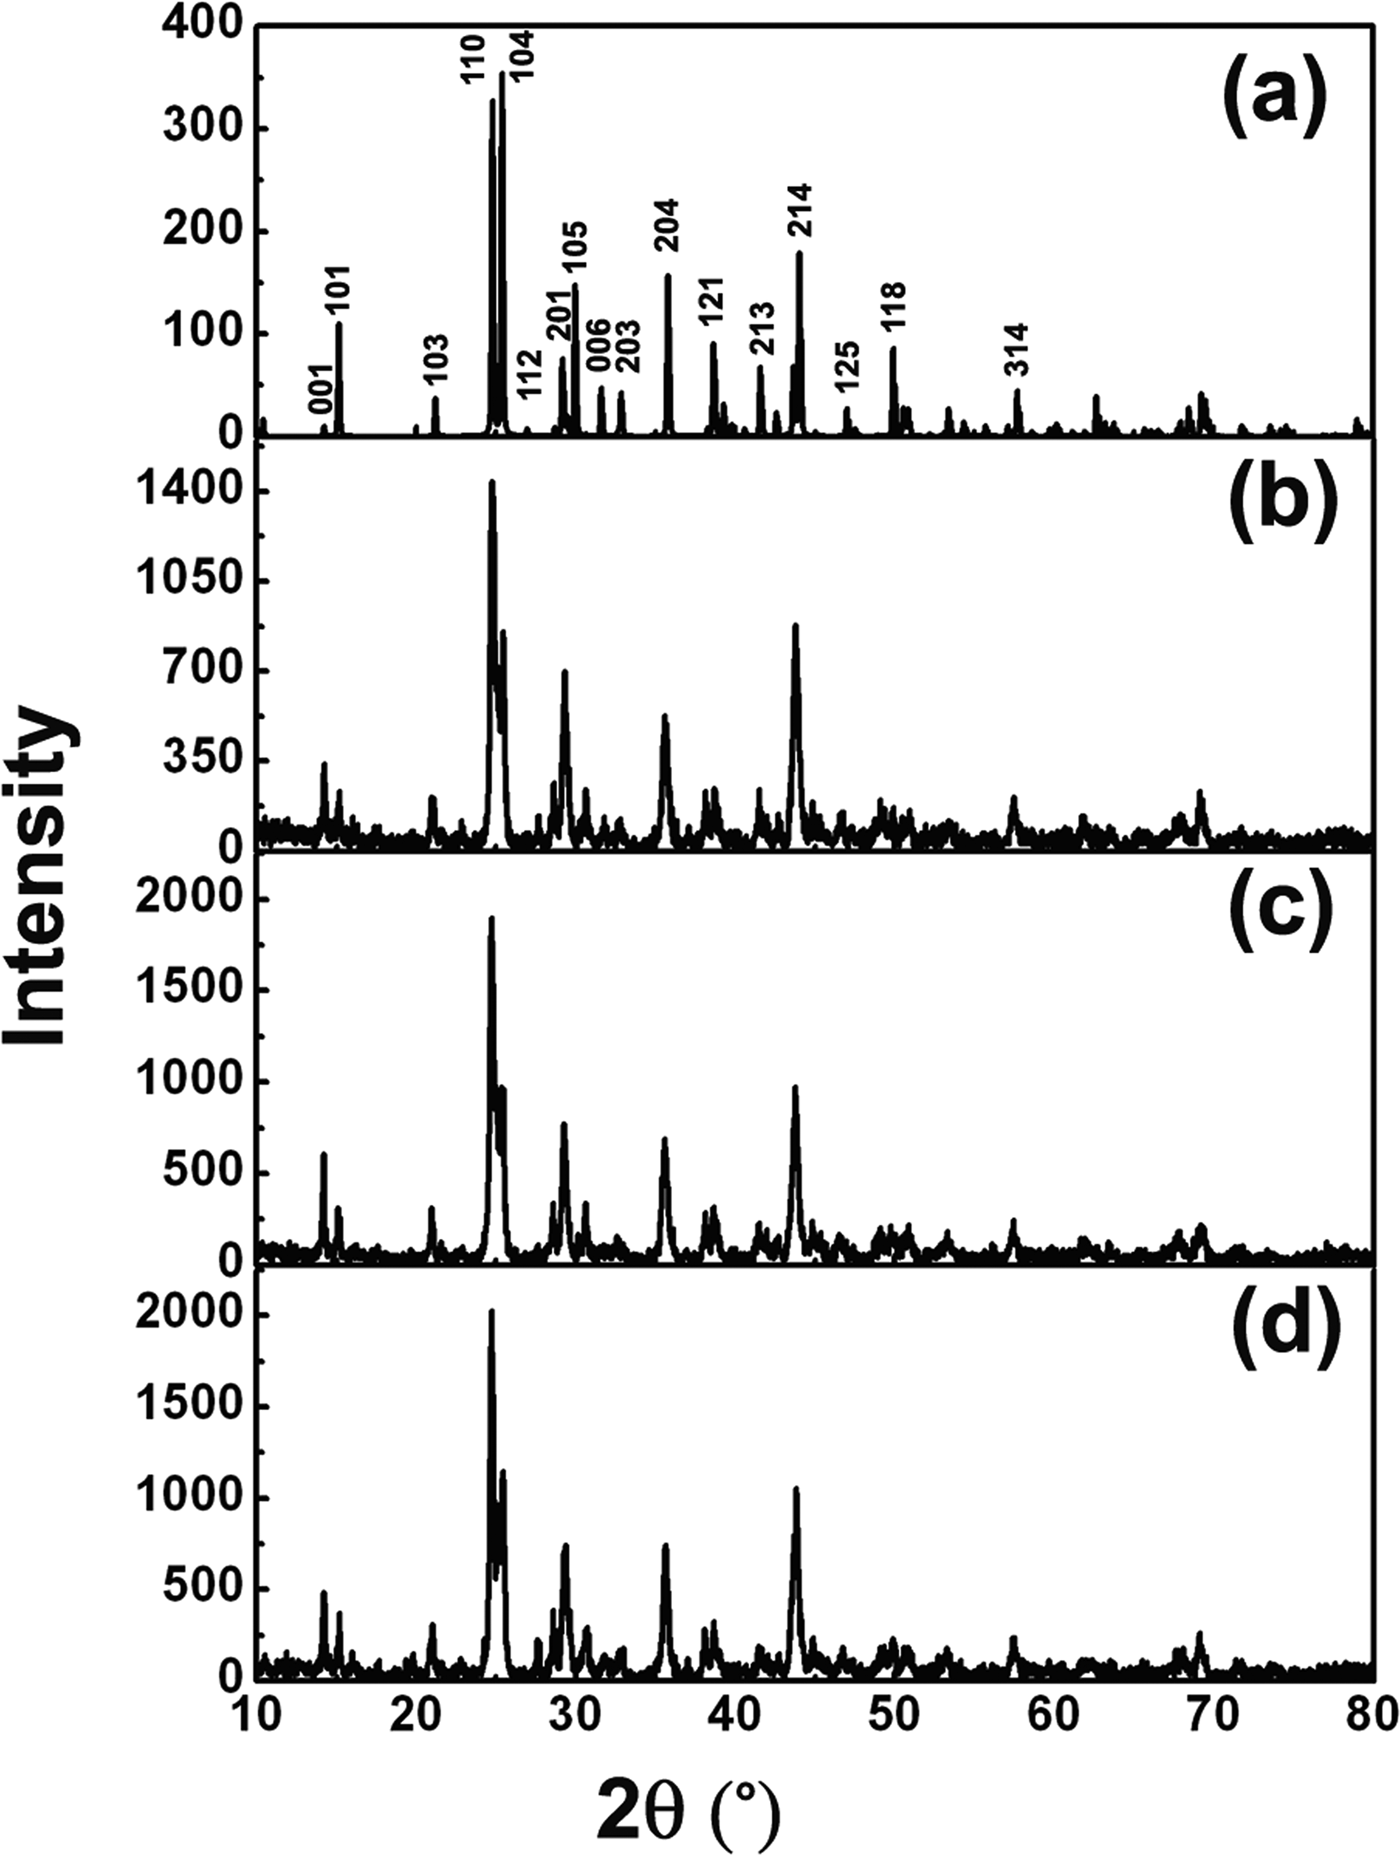
Figure 2(a) shows the simulated XRD pattern for SmBa3B9O18. Figures 2(b–d) are the selected measured XRD patterns for the synthesized Sm1−xEuxBa3B9O18 materials with Eu-doping concentrations of x = 0.2, 0.4, and 0.6, respectively. It can be found that the XRD pattern of the sintered materials agrees with the simulated pattern and no impurity phases were detected. This implies that Eu-doping does not modify the symmetry and structure of SmBa3B9O18, because Eu and Sm atoms have similar atomic radius, coordination structure, and physical–chemical properties. Continuous solid solutions are formed in the whole range (x = 0–0.6) for the Eu-doped SmBa3B9O18 system.
(a) Simulated XRD pattern of SmBa3B9O18. (b) to (d) The measured XRD patterns of Sm(1−x)EuxBa3B9O18 (x = 0.2, 0.4, and 0.6), respectively.
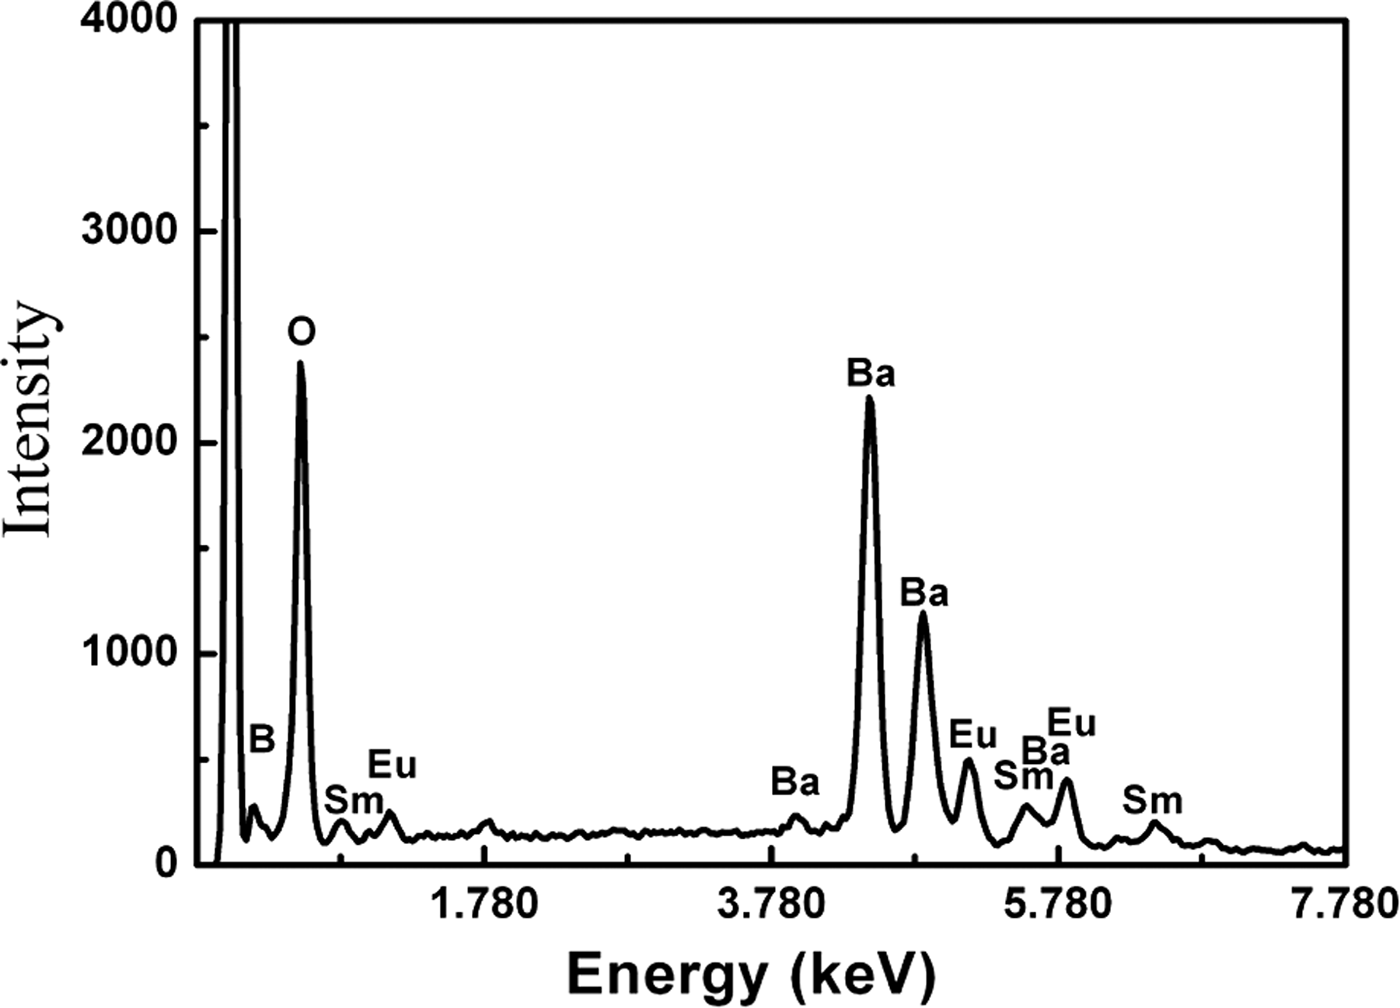
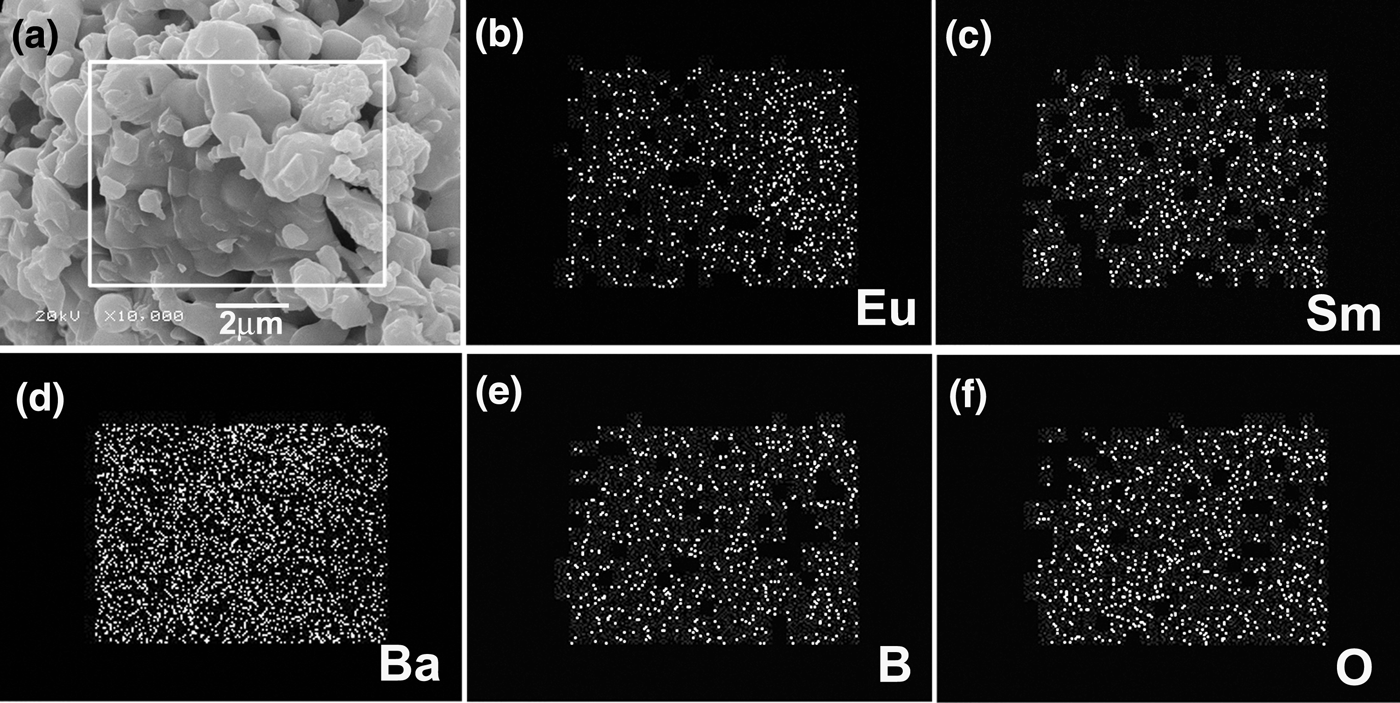
The EDS results reveal only the existence of Sm, Ba, B, O, and Eu elements in the samples, as shown in Figure 3. Figure 4(a) shows typical SEM photographs of the synthesized Sm1−xEuxBa3B9O18 (x = 0.6) materials. The layered structure was observed and the prominent characteristic of Sm1−xEuxBa3B9O18 is the serious anisotropic growth. The nucleation and crystal growth were dominated by crystal bonding dynamics and external thermodynamic driving force. The growth rate along the a–b-plane is much larger than that along the c-axis, which can be easily understood from the periodic bond chain (PBC) theory (Hartman and Perdok, Reference Hartman and Perdok1955; Hartman, Reference Hartman1956). This kind of anisotropic growth is determined by the crystal structure of SmBa3B9O18 (as shown in Figure 1). The distributions of doped Eu3+ ions are analyzed by EDS element mapping technique, as shown in Figures 4(b–f). The element maps are acquired using Eu-L α1 (Figure 4b), Sm-L α1 (Figure 4c), Ba-L α1 (Figure 4d), B-K α1,2 (Figure 4e), and O-K α1 (Figure 4f). Eu and Sm (B and O) elements are found to have similar spatial distributions, while Ba is found to be more evenly distributed through the whole investigated region. Such spatial distributions of the compositional elements agree well with the nominal composition of the compounds, indicating that the Eu3+ ions were doped into SmBa3B9O18 uniformly.
Typical EDS results, revealing the existence of Sm, Ba, B, O, and Eu in the samples.
(a) Typical SEM images of the samples, indicating the layered structures. (b) to (d) EDS elemental mappings of Eu, Sm, Ba, B, and O elements, respectively, indicating the spatial distributions of the elements.
Figure 5(a) showed a UV excitation spectrum of Eu-doped SmBa3B9O18 obtained by monitoring 5D0–7F1 at 589 nm. The main broad band at 200–300 nm originates from the charge transfer (CT) transition of O–Eu3+ (Kodaira et al., Reference Kodaira, Brito and Felinto2003). Namely, the electron delocalized from the filled 2p shell of O2− to the partially filled 4f shell of Eu3+. The wavelength of ~230 nm is the most effective excitation wavelength (Li et al., Reference Li, Chen and Lin2008; Ding et al., Reference Ding, Sun, Liu, Meng and Lu2011). Figure 5(b) presents the emission spectra (λ ex = 230 nm) for Sm1−xEuxBa3B9O18 (x = 0.2, 0.4, and 0.6), respectively. It was found that the Eu3+-doped SmBa3B9O18 samples presented the characteristic Eu3+ ion luminescence. The emission of Eu3+ ions in SmBa3B9O18 extends from 550 to 720 nm and consists mainly of several groups of lines. Several peaks are observed at 578, 589, 594, 608, 618, 652, and 680 nm for the Sm1−xEuxBa3B9O18 series. The intensities of 589 and 608 nm peaks are the most strong. The intensity of the emission peak is increasing with the increment of Eu3+ ions concentration in the main and no concentration quenching processes occur. This indicates that if we continue to improve the Eu3+ doping concentration, better luminescent materials would be obtained.
(a) Excitation spectra recorded in the range from 200 to 450 nm monitoring the emission at 589 nm. (b) Emission spectrum obtained in the range from 500 to 720 nm when excited at 230 nm.
The emission features of the title material are because of transitions from the excited state 5D0 to the ground states 7FJ (J = 0, 1, 2, 3, and 4) in the 4f6 configuration of Eu3+ ions (Aloui-Lebbou et al., Reference Aloui-Lebbou, Goutaudier, Kubota, Dujardin, Cohen-Adad, Pedrini, Florian and Massiot2001; Dotsenko et al., Reference Dotsenko, Berezovskaya, Efryushina, Voloshinovskii and Stryganyuk2010). The main lines at around 589 nm are attributed to magnetic dipole transition of 5D0–7F1 and main lines at 608 nm are because of 5D0–7F2 transition (electric dipole transition). The ratios of the red emission at 608 nm to the orange one at 589 nm (abbreviated as the R/O value) are all lower than 1.00 for different Eu3+ contents. Therefore, the orange emission is predominant and Eu3+ does occupy the inversion symmetry sites in the host lattices based on the Judd–Ofelt theory (Huang et al., Reference Huang, Zhou, Pang, Gong, Sun and Wang2009). No emission from the higher level, e.g., 5D1,2 was detected except the transition from 5D0, because the low-lying charge-transfer states skip the higher-lying 5DJ levels during the relaxation process (Fonger and Struck, Reference Fonger and Struck1970). Maximum splitting numbers of transition lines for 5D0–7FJ (J = 0, 1, and 2) are 1 (for J = 0), 3 (for J = 1), and 5 (for J = 2) for each site, as a result of 2J + 1 components for Eu3+ in a crystal field (Xie et al., Reference Xie, Huang, Qiao, Shi and Seo2010). From the emission spectrum shown in Figure 5(b), one peak at 578 nm (5D0–7F0), two lines for 5D0–7F1 (the third one is not obvious), and several lines for 5D0–7F2 are observed. It is suggested that the Eu3+ ions are doped into the SmBa3B9O18 matrix in one crystallographic site, which is consistent with the crystal structure of SmBa3B9O18.
IV. CONCLUSION
Europium (Eu3+)-doped SmBa3B9O18 were synthesized by facile solid state reaction at high temperatures. XRD, SEM, and EDX measurements indicate that Sm1−xEuxBa3B9O18 formed solid solutions in the range of x = 0–0.6. Eu3+ ions doping does not change the crystal structure of the host material SmBa3B9O18. Sm1−xEuxBa3B9O18 (x = 0.2, 0.4, and 0.6) have a strong absorption at the wavelength of ~230 nm, and show good emission performance at 589 and 608 nm under ultraviolet excitation. High luminescence efficiency is found in Eu-doped SmBa3B9O18 series with the increment of Eu3+ concentration. The results presented here indicate that Eu-doped SmBa3B9O18 may find application in phosphor.
ACKNOWLEDGEMENTS
The authors gratefully acknowledge financial support by the National Natural Science Foundation of China (Grant Nos. 50902014 and 51002017), Liaoning Province Talent Plan, LJQ2011044 and International Centre for Diffraction Data (ICDD).