


Statement of Research Significance
Research Question(s) or Topic(s): This study sought to create and validate normative data and regression-based change scores for the CERAD Word List by utilizing a large cohort of older adults that ranged in age from 60 to 100 years old. Main Findings: CERAD Word List data from 1,530 older adults diagnosed as cognitively intact, Mild Cognitive Impairment (MCI), or dementia were seen for two annual visits in a longitudinal observational study; this data was used to create normative and regression-based change scores that were validated across comparison groups. Study Contributions: This unique normative and change information allows healthcare providers and researchers to be more confident in using this learning and memory test in clinics and clinical trials.
Introduction
Word list learning and memory tests are frequently utilized by clinicians and researchers to evaluate evidence of late life cognitive disorders in older adults. Immediate and delayed memory performance for word lists demonstrate excellent sensitivity and specificity in separating healthy controls from those with Alzheimer’s disease (AD) (Belleville et al., Reference Belleville, Fouquet, Hudon, Zomahoun and Croteau2017), and comparable effect sizes as cerebral spinal fluid biomarkers (Duff et al., Reference Duff, Hammers, Koppelmans, King and Hoffman2024; Schmand et al., Reference Schmand, Huizenga and van Gool2010).
The Word List subtest of the Consortium to Establish a Registry for Alzheimer’s Disease (CERAD) neuropsychological battery is freely available and widely used to identify and track cognitive disorders (Fillenbaum & Mohs, Reference Fillenbaum and Mohs2023). It includes three learning trials of 10 words, a delayed recall trial, and a forced-choice recognition trial. Since 2018, over 100 peer-reviewed publications have utilized the CERAD Word List subtest to examine learning and memory across a range of behaviors, neurological and psychiatric disorders, and medical conditions (Fillenbaum & Mohs, Reference Fillenbaum and Mohs2023). Of the studies that reported the types of scores used in the analyses from the CERAD Word List, over 80% used raw scores or raw scores that were standardized on the original samples that were not corrected for demographic variables (e.g., age, sex, education). However, since corrections for demographic variables are encouraged in professional practice (Casaletto & Heaton, Reference Casaletto and Heaton2017), their relative absence for this learning and memory test may have led to its under-utilization in clinical settings. Furthermore, the CERAD Word List subtest is one of the memory options used in the cognitive battery of the National Alzheimer’s Coordinating Center’s Uniform Data Set Version 4 (UDS-4), which will likely increase its use in the coming years.
Several prior studies have provided normative data for the CERAD word list (Hankee et al., Reference Hankee, Preis, Piers, Beiser, Devine, Liu, Seshadri, Wolf and Au2016; Welsh et al., Reference Welsh, Butters, Mohs, Beekly, Edland, Fillenbaum and Heyman1994). Many of these findings have limitations, such as not adjusting for demographic variables, collapsing age groups within older adult samples (Hankee et al., Reference Hankee, Preis, Piers, Beiser, Devine, Liu, Seshadri, Wolf and Au2016), having sample sizes less than 300 subjects, or having aspects of the study that limit external validity (Fillenbaum & Mohs, Reference Fillenbaum and Mohs2023; Stein et al., Reference Stein, Luppa, Luck, Maier, Wagner, Daerr, van den Bussche, Zimmermann, Köhler, Bickel, Mösch, Weyerer, Kaufeler, Pentzek, Wiese, Wollny, König and Riedel-Heller2012). For example, while the CERAD has been translated and normed across several languages and demographic groups (Fillenbaum & Mohs, Reference Fillenbaum and Mohs2023), only two studies (Kirsebom et al., Reference Kirsebom, Espenes, Hessen, Waterloo, Johnsen, Gundersen, Botne Sando, Rolfseng Grøntvedt, Timón and Fladby2019; Wagle et al., Reference Wagle, Selbæk, Benth, Gjøra, Rønqvist, Bekkhus-Wetterberg, Persson and Engedal2023) presented regression-based normative data, which incorporates multiple demographic variables and likely yields more accurate corrections for those memory performances. These studies were both with Norwegian samples, and neither sample included many participants who were older than age 85 (i.e., “oldest-old”), a growing segment of the population at higher risk of cognitive impairment (Ye et al., Reference Ye, Sun, Wang, Khoo, Lim, Lu, Yu, Li, Maier and Feng2023). Overall, these unique aspects of these existing studies raise concern about how well these normative data would generalize to the larger population. As such, there appears room for additional, supplemental normative data on larger, older, and United States-represented samples that utilize regression-based methods.
Little work has been published on reliable change for the CERAD Word List despite its popularity. Using a very large sample of robustly cognitively intact older adults from Germany, Stein et al. (Reference Stein, Luppa, Luck, Maier, Wagner, Daerr, van den Bussche, Zimmermann, Köhler, Bickel, Mösch, Weyerer, Kaufeler, Pentzek, Wiese, Wollny, König and Riedel-Heller2012) provided Reliable Change Index (RCI) scores for the CERAD, including the Word List. However, these participants ranged in age from 75 to 92 years, and their education was classified as “low” or “middle/high” based on Western European standards, limiting the external validity. Although standardized regression-based (SRB) change methods have been increasingly applied and validated in older adult samples (e.g., Duff, Reference Duff2012; Reference Duff2014), no recent studies have developed or validated updated regression-based change equations for the CERAD Word List. Thus, longitudinal interpretation of CERAD Word List performance continues to rely on older RCI-based approaches.
As such, the current study sought to add to the limited literature on normative data and change scores for the CERAD Word List by utilizing a large cohort of robustly intact older adults that ranged in age from 60 to 100 years old who were tested twice with this verbal memory test across 1.3 years. In aim 1, the existing regression-based normative data of Wagle et al. (Reference Wagle, Selbæk, Benth, Gjøra, Rønqvist, Bekkhus-Wetterberg, Persson and Engedal2023) was examined in the current cohort to see if supplemental normative data was needed. If Wagle et al. (Reference Wagle, Selbæk, Benth, Gjøra, Rønqvist, Bekkhus-Wetterberg, Persson and Engedal2023) norms did not provide appropriately distributed norms in the current sample, Aim 2 involved calculating regression-based normative data and SRB change scores with a robustly intact sample. These new regression-based scores were preliminarily validated in a separate sample of cognitively impaired older adults who were also retested over time. In the normative models, it was expected that age, education, and sex would significantly predict Time 1 (i.e., baseline) scores on the Word List test. In the change models, it was hypothesized that these same demographic variables, as well as Time 1 scores, would significantly predict Time 2 (i.e., follow-up) scores on this memory test. Such normative and change information might allow healthcare providers and researchers to be more confident in using this learning and memory test in clinics and clinical trials.
Method
Participants
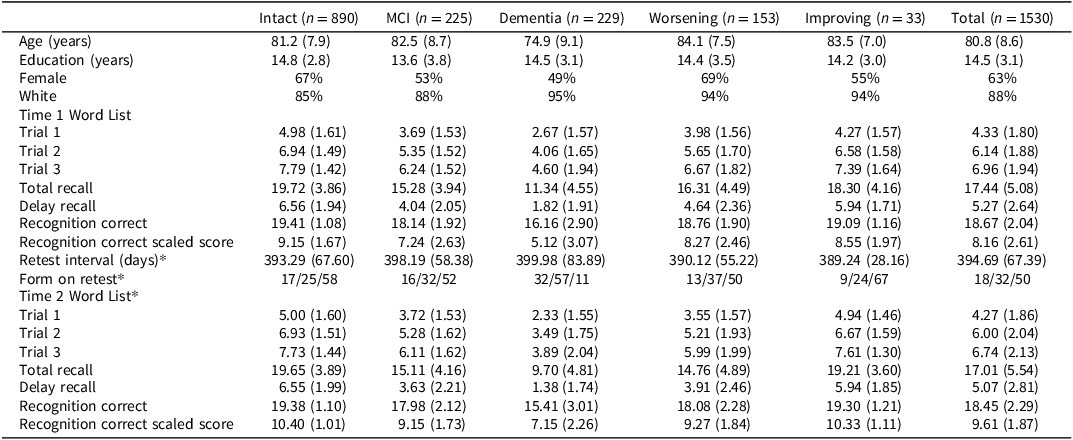
Participants included 1,530 individuals who were seen for at least two consecutive visits for research from the Oregon Alzheimer’s Disease Research Center (OADRC) Clinical Core between March of 1989 and January of 2023. These participants were classified into 1 of 5 groups: (1) cognitively intact at Time 1 and Time 2; (2) MCI at Time 1 and Time 2; (3) dementia at Time 1 and Time 2; (4) worsening status from Time 1 to Time 2 (e.g., intact to MCI, MCI to dementia); or (5) improving status from Time 1 to Time 2 (e.g., MCI to intact, dementia to MCI). Demographic variables and Time 1 and Time 2 Word List scores for each group are presented in Table 1.
Demographic variables and Word List scores at time 1 and time 2 for each group

Table 1. Long description
The table presents demographic variables and word list scores at two time points for individuals classified into five cognitive status groups: Intact, MCI, Dementia, Worsening, and Improving. The table has 15 rows and 11 columns. Column headers include Intact (n = 890), MCI (n = 225), Dementia (n = 229), Worsening (n = 153), Improving (n = 33), and Total (n = 1530). Row labels include Age (years), Education (years), Female, White, Time 1 Word List (Trial 1, Trial 2, Trial 3, Total recall, Delay recall, Recognition correct, Recognition correct scaled score, Retest interval (days), Form on retest), and Time 2 Word List (Trial 1, Trial 2, Trial 3, Total recall, Delay recall, Recognition correct, Recognition correct scaled score). Each cell contains specific values related to the row label and column group. Notable trends include variations in age, education, and gender distribution across groups, as well as differences in word list performance scores.
Note: MCI = mild cognitive impairment.
* Time 2 was on a subset of the Time 1 sample with retest intervals that ranged from 180 to 720 days (intact n = 809, MCI n = 213, dementia n = 209, worsening n = 119, improving n = 33, total n = 1,377). Form on retest = % same/% unknown/% alternate.
Procedures
All procedures were approved by the Oregon Health & Science University institutional review board before they were conducted. Each participant provided informed consent/assent to participate in this longitudinal research study, consistent with the Declaration of Helsinki and institutional guidelines.
Each participant completed at least two consecutive visits: a baseline visit and at least one follow-up visit approximately one year after the former. Each research visit consisted of a visit with a healthcare provider who conducted an interview with the participant and a knowledgeable informant, physical and neurological examinations, and completed questionnaires regarding the participant’s cognition, psychiatric symptoms, motor functioning, and daily functioning. Comprehensive neuropsychological testing, which included the CERAD Word List, was also completed. Based on all available information, including existing medical records, a multidisciplinary consensus diagnosis was made for each participant at each visit. Diagnoses typically included cognitively intact/unimpaired, MCI (all subtypes), and dementia (all causes). Additional details about the procedures associated with these diagnostic visits are found elsewhere (Besser et al., Reference Besser, Kukull, Knopman, Chui, Galasko, Weintraub, Jicha, Carlsson, Burns, Quinn, Sweet, Rascovsky, Teylan, Beekly, Thomas, Bollenbeck, Monsell, Mock, Zhou and Morris2018; Weintraub et al., Reference Weintraub, Besser, Dodge, Teylan, Ferris, Goldstein, Giordani, Kramer, Loewenstein, Marson, Mungas, Salmon, Welsh-Bohmer, Zhou, Shirk, Atri, Kukull, Phelps and Morris2018). Although most participants retained the same diagnosis at both visits (intact n = 890, MCI = 225, dementia n = 229), a smaller number of participants worsened over time (e.g., intact to MCI, MCI to dementia, n = 153) or improved over time (e.g., MCI to intact, dementia to MCI, n = 33).
Measure
The CERAD Word List consists of three learning trials, one delayed recall trial, and one recognition trial. In each of the learning trials, the participant is presented with the list of ten words, one at a time, written on cards, and instructed to read each word aloud. Following the list presentation, the participant is asked to immediately recall as many of the ten words as he/she/they can. After an interference task and a delay of about three minutes, the participant is again asked to recall as many words as he/she/they can from the list. On the recognition trial, the participant is shown a list of 20 words on individual cards, ten of which were from the original list and ten of which were not. The participant is asked to verbally identify the words that were on the original list. Six primary raw scores were considered for analysis: Trial 1, Trial 2, Trial 3, Total Recall (i.e., sum of three learning trials), Delay Recall, and Recognition Total Correct. For each score, higher values indicate better performance (Welsh et al., Reference Welsh, Butters, Mohs, Beekly, Edland, Fillenbaum and Heyman1994). Approximately 25 years ago, an alternate form of the Word List was developed at our site for use in longitudinal studies on aging (Howieson et al., Reference Howieson, Dame, Camicioli, Sexton, Payami and Kaye1997; Howieson et al., Reference Howieson, Mattek, Seeyle, Dodge, Wasserman, Zitzelberger and Jeffrey2011). In the intact participants in this sample, the two forms yield comparable means, standard deviations, and ranges (Total Recall: original = 19.71 [3.96], 8 – 30, alternate = 19.49 [3.69], 10 – 28; Delay Recall: original = 6.48 [2.03], 0 – 10, alternate = 6.76 [1.73], 0 – 10), although formal equivalency testing was never completed.
Analyses for normative data
Evaluation of existing normative data
Using the five samples in the current study, demographically-corrected z-scores of Wagle et al. (Reference Wagle, Selbæk, Benth, Gjøra, Rønqvist, Bekkhus-Wetterberg, Persson and Engedal2023) were calculated for each participant for CERAD Word List Total Recall and Delay Recall. The analyses focused on these two scores because they are commonly used in evaluating an individual’s memory functioning and limiting the number of statistical comparisons in these preliminary analyses. These z-scores were evaluated in three ways. First, group comparisons were made with one-way ANOVAs, with subsequent post-hoc comparisons. Second, following the methods outlined in Stricker et al. (Reference Stricker, Christianson, Lundt, Alden, Machulda, Fields, Kremers, Jack, Knopman, Mielke and Petersen2021), one-sample chi-square test of probabilities was calculated to compare the percentage of intact participants in the current sample who had z-scores that fell one or more standard deviations below average (i.e., z-scores≤−1) relative to the expected 16% of participants who should have had scores that low or lower based on chance alone. Third, following the methods outlined in Kirsebom et al. (Reference Kirsebom, Espenes, Hessen, Waterloo, Johnsen, Gundersen, Botne Sando, Rolfseng Grøntvedt, Timón and Fladby2019), age, education, and sex were regressed on these already-demographically-corrected z-scores among intact participants to see if these demographic variables continued to significantly explain variance.
Generation of new normative data
An initial evaluation of the raw scores of CERAD Word List in the intact participants revealed them to be largely normally distributed (e.g., skew and kurtosis = 0), excluding the Recognition Total raw score, which was not normally distributed (e.g., skew = 2.6, kurtosis = 8.6). When these scores were converted to scaled scores (M = 10, SD = 3) based on the cumulative frequency distribution of the intact sample, the normality improved, although it remained non-normal (e.g., skew = 2.2, kurtosis = 4.0). Therefore, both raw and scaled scores for Recognition Total were considered in the remaining analyses, but interpretation of these variables should be done with caution considering these non-normal scores. Linear regression models predicted raw/scaled scores from age (in years), education (in years), sex (1 = male, 2 = female), and race (1 = white, 2 = non-white) for the robustly cognitively intact subjects, with all predictor variables simultaneously entered.
Preliminary validation of new normative data
The normative equations generated in the intact participants were applied back to each individual in the entire sample (i.e., all five groups) using the unstandardized coefficients (beta weights) to generate a predicted Time 1 score. This predicted Time 1 score was subtracted from the observed Time 1 score. This difference score was divided by the standard error of the estimate of the regression model to yield a normative z-score, where values near 0 indicate that observed and predicted Time 1 scores were comparable (i.e., demographic prediction was similar to the observed score), negative values indicate that predicted Time 1 score was greater than expected (i.e., demographic prediction was higher than the observed score or the observed score fell below expectations), and positive values indicate that the predicted Time 1 score was lower than expected (i.e., demographic prediction was lower than the observed score or the observed score fell above expectations).
First, group comparisons were made with one-way ANOVAs, with subsequent post-hoc comparisons. Second, following the methods outlined in Stricker et al. (Reference Stricker, Christianson, Lundt, Alden, Machulda, Fields, Kremers, Jack, Knopman, Mielke and Petersen2021), one-sample chi-square test of probabilities was calculated to compare the percentage of intact participants in the current sample who had z-scores that fell one or more standard deviations below average (i.e., z-scores-1) relative to the expected 16% of participants who should have had scores that low or lower based on chance alone. Third, following the methods outlined in Kirsebom et al. (Reference Kirsebom, Espenes, Hessen, Waterloo, Johnsen, Gundersen, Botne Sando, Rolfseng Grøntvedt, Timón and Fladby2019), age, education, and sex were regressed on these already-demographically-corrected z-scores in the intact participants to see if these demographic variables continued to significantly explain variance.
Analyses for change data
Evaluation of existing change data
Using the RCI ranges of Stein et al. (Reference Stein, Luppa, Luck, Maier, Wagner, Daerr, van den Bussche, Zimmermann, Köhler, Bickel, Mösch, Weyerer, Kaufeler, Pentzek, Wiese, Wollny, König and Riedel-Heller2012), each participant was categorized as “decline,” “stable,” or “improve” for CERAD Word List Total Recall and Delay Recall. These RCI categories were evaluated in two ways. First, comparisons of the five groups were made with one-sample chi-square tests of the “decline/stable/improve” categories, with subsequent post-hoc pairwise comparisons. Second, following the methods outlined in Duff et al. (Reference Duff, Atkinson, Suhrie, Dalley, Schaefer and Hammers2017) one-sample chi-square test of probabilities were calculated to compare the percentage of intact participants in the current sample who were categorized as “decline/stable/improve” relative to the expected percentage of participants who should be “decline/stable/improve” based on chance alone (i.e., 5%/90%/5% based on the RCIs of Stein et al. (Reference Stein, Luppa, Luck, Maier, Wagner, Daerr, van den Bussche, Zimmermann, Köhler, Bickel, Mösch, Weyerer, Kaufeler, Pentzek, Wiese, Wollny, König and Riedel-Heller2012)).
Generation of new change data
An initial evaluation of the retest interval revealed that some individuals had their Time 2 visit relatively soon after their Time 1 visit, and others had the follow-up visit relatively late after their baseline visit. Since retest interval can affect changes on cognitive test scores, the retest interval this was limited to cases between 180 and 720 days, consistent with prior longitudinal change scores (Kiselica et al., Reference Kiselica, Kaser, Webber, Small and Benge2025). In this slightly limited sample of intact participants (n = 803), the Time 1 and Time 2 raw scores of CERAD Word List Trial 1, Trial 2, Trial 3, Total Recall, and Delay Recall were largely normally distributed (e.g., skew and kurtosis = 0). However, the Recognition Total raw score was not normally distributed (e.g., Time 1: skew = 2.5, kurtosis = 7.8; Time 2: skew = 2.7, kurtosis = 9.8). When these scores were converted to scaled scores (M = 10, SD = 3) based on the cumulative frequency distribution of the intact sample, normality improved, although it remained non-normal (e.g., Time 1: skew = 2.1, kurtosis = 3.4; Time 2: skew = 2.1, kurtosis = 4.6). Therefore, both raw and scaled scores for Recognition Total were considered in the remaining analyses, but the reader should be cautious when interpreting these variables considering these non-normal scores.
Consistent with the SRB approach (McSweeny et al., Reference McSweeny, Naugle, Chelune and Lüders1993) linear regression models predicted Time 2 raw/scaled scores from Time 1 scores, age (in years), education (in years), sex (1 = male, 2 = female), race (1 = white, 2 = non-white), retest interval (in days), and test form (0 = same form, 0.5 = unknown, 1 = alternate form) for the robustly cognitively intact subjects, with all predictor variables simultaneously entered. Separate linear regression models were run for each raw score on the CERAD Word List (Trial 1, Trial 2, Trial 3, Total Recall, Delay Recall, and Recognition Total Correct) and the scaled score for Recognition Total Correct.
Preliminary validation of new change data
Using the SRB equations generated in the intact participants, they were applied back to each individual in the entire sample using the unstandardized coefficients (beta weights) to generate a predicted Time 2 score. This predicted Time 2 score was subtracted from the observed Time 2 score. This difference score was divided by the standard error of the estimate of the regression model to yield an SRB z-score, where values near 0 indicate the expected amount of change, negative values indicate smaller-than-expected change (or actual decline), and positive values indicate larger-than-expected change (or actual improvement).
Once these SRB z-scores were calculated for each participant in each group, they were examined in two ways. First, comparisons of the five groups were made with ANOVAs, with subsequent post-hoc comparisons. Second, following the methods outlined in Duff et al. (Reference Duff, Atkinson, Suhrie, Dalley, Schaefer and Hammers2017), one-sample chi-square test of probabilities were calculated to compare the percentage of intact participants in the current sample who were categorized as “decline/stable/improve” relative to the expected percentage of participants who should be “decline/stable/improve” based on chance alone (i.e., 5%/90%/5%). Like the evaluation of the existing change data, these analyses focused on only the Total Recall and Delay Recall change scores. All analyses for normative and change data were calculated using SPSS v.31 (IBM, 2024).
Results
Evaluation of existing normative data
Group comparisons
Descriptively, the normative-corrected z-scores of Wagle et al. (Reference Wagle, Selbæk, Benth, Gjøra, Rønqvist, Bekkhus-Wetterberg, Persson and Engedal2023) are presented for each group in Table 2. As expected, there were statistically significant group differences on both Word List z-scores: Total Recall (F[4,1524] = 263.76, p < .001) and Delay Recall (F[4,1523] = 198.12, p < .001). In post-hoc comparisons on Total Recall, all groups were significantly different (p < .05), except for the intact and improving groups, which were comparable (p = .33). For Delay Recall, all groups were significantly different (p < .05), except for the intact and improving groups (p = .90) and the MCI and worsening groups (p = .44).
Word list z-scores at baseline for each group based on Wagle et al. (Reference Wagle, Selbæk, Benth, Gjøra, Rønqvist, Bekkhus-Wetterberg, Persson and Engedal2023)

Table 2. Long description
A table comparing word list z-scores across different cognitive groups. The table has 2 rows and 6 columns. The columns are labeled as Intact, MCI, Dementia, Worsening, Improving, and Total. The row labels are WL total (raw) and WL delay (raw). Row 1: Intact, 37 (1.14); MCI, -7.9 (1.18); Dementia, -2.49 (1.44); Worsening, -5.2 (1.38); Improving, 1.6 (1.09); Total, -3.3 (1.58). Row 2: WL delay (raw), Intact, 1.02 (1.41); MCI, -0.12 (1.49); Dementia, -1.94 (1.51); Worsening, 0.00 (1.68); Improving, 1.06 (1.11); Total, 0.31 (1.80).
Note: MCI = mild cognitive impairment, WL = Word List. All variables show statistically significant group differences (p < .001, see Results for details).
Frequency of low scores in existing normative data
Following the method of Stricker et al. (Reference Stricker, Christianson, Lundt, Alden, Machulda, Fields, Kremers, Jack, Knopman, Mielke and Petersen2021), applying the normative data of Wagle et al. (Reference Wagle, Selbæk, Benth, Gjøra, Rønqvist, Bekkhus-Wetterberg, Persson and Engedal2023) to the cognitively intact participants in the current sample led to significantly fewer-than-expected individuals with z-scores at or below −1 SD for both the Word List Total Recall (x 2[1] = 17.9, p < .001) and Delay Recall (x 2[1] = 55.4, p < .001). For Total Correct, 10.8% of these intact subjects had z-scores at or below −1 using the existing normative data of Wagle et al. (Reference Wagle, Selbæk, Benth, Gjøra, Rønqvist, Bekkhus-Wetterberg, Persson and Engedal2023), which was well below the expected percentage of 16. For Delay Recall, 6.9% had z-scores at or below that cutoff, which is less than half the expected amount.
Demographic effects after normative correction
Following the Kirsebom et al. (Reference Kirsebom, Espenes, Hessen, Waterloo, Johnsen, Gundersen, Botne Sando, Rolfseng Grøntvedt, Timón and Fladby2019) method, when only examining the intact participants, age, education, and sex did not significantly explain additional variance on the Total Recall z-score (F[3,885] = 2.37, p = .07, R 2 = .01). However, these three demographic variables did significantly predict the already-demographically-corrected z-scores of Wagle et al. (Reference Wagle, Selbæk, Benth, Gjøra, Rønqvist, Bekkhus-Wetterberg, Persson and Engedal2023) on Delay Recall (F[3,885] = 12.07, p < 0.001, R 2 = 0.04). When examining the entire sample (i.e., all five groups), both regression models were statistically significant (Total Recall: F[3,1523] = 15.36, p ≤ .001, R 2 = .03; Delay Recall: F[3,1522] = 39.46, p ≤ .001, R 2 = .07), indicating that demographic variables continued to predict these already-corrected z-scores of Wagle et al. (Reference Wagle, Selbæk, Benth, Gjøra, Rønqvist, Bekkhus-Wetterberg, Persson and Engedal2023).
Generation of new normative data
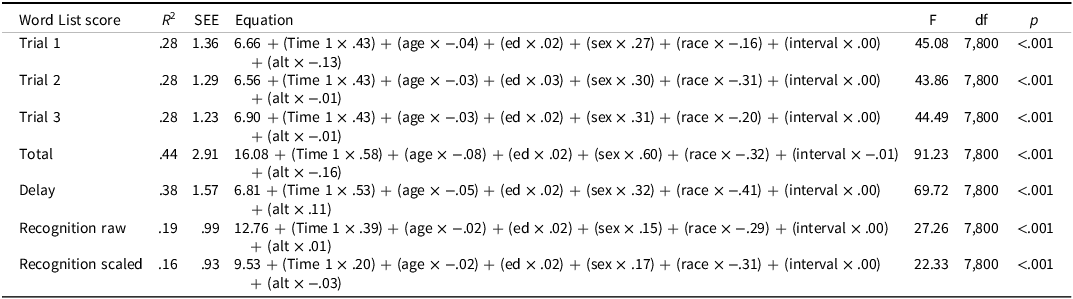
As detailed in Table 3, each Word List score was significantly predicted by the combination of age, sex, education, and race (p < .001), with 5–20% of the variance being accounted for in these models.
Regression models predicting Word List scores at baseline based on intact participants

Table 3. Long description
A table with 7 rows and 8 columns showing regression models predicting Word List scores based on age, sex, education, and race. The columns are Word List score, R squared, Standard Error of Estimate, Equation, F value, degrees of freedom, and p-value. The rows are Trial 1, Trial 2, Trial 3, Total, Delay, Recognition raw, and Recognition scaled. Each row provides specific values for each column, detailing the regression models’ predictions.
Note: SEE = standard error of the estimate, age (in years), sex (male = 1, female = 2), ed = education (in years), race (white = 1, non-white = 2).
Preliminary validation of new normative data
Group comparisons
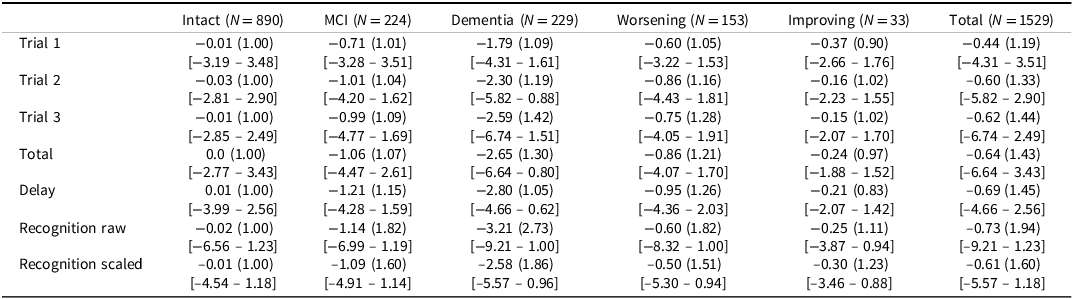
These new normative data were applied to participants in each of the five groups, as presented in Table 4. Since the new normative data were developed on the intact participants, their z-scores were all very close to 0 with a standard deviation of 1, which would be expected. Those with MCI and dementia had mean z-scores across the Word List test that were approximately –1 and –2 (or more), respectively. Interestingly, those who were identified as worsening across visits tended to have z-scores more similar to those with MCI, and those who were identified as improving across visits tended to have z-scores more similar to those who were intact. Across the five groups, there were significant group differences for each of the Word List z-scores (all p-values < .001), with all effect sizes being large (eta-squared: .28–.48). In post-hoc comparisons, the predominant trend was: intact, improving > MCI, worsening > dementia.
Word List z-scores at baseline for each group based on new normative data

Table 4. Long description
The table presents Word List z-scores at baseline for five groups: Intact, MCI, Dementia, Worsening, and Improving. It includes three trials and total scores for each group, along with delay and recognition scores. The table has 11 rows and 6 columns. Column headers are Intact, MCI, Dementia, Worsening, Improving, and Total. Row labels include Trial 1, Trial 2, Trial 3, Total, Delay, Recognition raw, and Recognition scaled. Each cell contains z-scores and standard deviations in brackets. Notable trends include lower z-scores for the Intact group and higher z-scores for the Dementia group across all trials and measures.
Note: MCI = mild cognitive impairment, WL = Word List.
Frequency of low scores using new normative data
Following the method of Stricker et al. (Reference Stricker, Christianson, Lundt, Alden, Machulda, Fields, Kremers, Jack, Knopman, Mielke and Petersen2021), applying the new normative data back to the cognitively intact participants in the current sample largely met expectations for Word List Total Recall and Delay Recall. For example, there were 16.4% of individuals with z-scores at or below −1 SD for the Word List Total Recall, which met the theoretical expectation (x 2[1] = .11, p = .74). Similarly, there were 15.4% of individuals at this point or lower on Delay Recall, which also met expectations (x 2[1] = .23, p = .63). For Recognition, there were 13.4% of individuals at this point or lower, which trended towards being fewer than expected (x 2[1] = 4.58, p = .03).
Demographic effects in new normative scores
Following the Kirsebom et al. (Reference Kirsebom, Espenes, Hessen, Waterloo, Johnsen, Gundersen, Botne Sando, Rolfseng Grøntvedt, Timón and Fladby2019) method, when only examining the intact participants, age, education, sex, and race did not significantly explain additional variance on the Total Recall z-score (F[4,885] = .00, p = 1.00, R 2 = .00). Similarly, these demographic variables did not significantly associate with the Delay Recall z-scores (F[4,885] = .00, p = 1.00, R 2 = .00) or Recognition z-scores F[4,885] = .00, p = 1.00, (R 2 = .00).
Evaluation of existing change data of Stein et al. (Reference Stein, Luppa, Luck, Maier, Wagner, Daerr, van den Bussche, Zimmermann, Köhler, Bickel, Mösch, Weyerer, Kaufeler, Pentzek, Wiese, Wollny, König and Riedel-Heller2012)
Group comparisons of change data
When the five groups were compared with one-sample chi-square tests on the “decline/stable/improve” categories using the RCIs of Stein et al. (Reference Stein, Luppa, Luck, Maier, Wagner, Daerr, van den Bussche, Zimmermann, Köhler, Bickel, Mösch, Weyerer, Kaufeler, Pentzek, Wiese, Wollny, König and Riedel-Heller2012), statistically significant differences emerged for both Total Recall (x 2[8] = 22.42, p = .004) and Delay Recall (x 2[8] = 21.27, p = .006). In pairwise post-hoc comparisons for Total Recall, the robustly cognitively intact participants showed significantly less “decline” than those with dementia at both visits (p = .005) and those who worsened from baseline to follow-up (p < .001), but comparable “decline” to those with MCI at both visits (p = .31) and those who improved from baseline to follow-up (p = .82). This same pattern was observed for Delay Recall for the intact participants (vs. MCI [p = .29], vs. dementia [p = .04], vs. worsening [p = .007], vs. improving [p = .60]).
Frequency of change classifications using existing change data
Using the Duff et al. (Reference Duff, Atkinson, Suhrie, Dalley, Schaefer and Hammers2017) method, when only the intact participants were examined with a one-sample chi-square test of probabilities such that 5% would “decline,” 90% would remain “stable,” and 5% would “improve” based on the RCIs of Stein et al. (Reference Stein, Luppa, Luck, Maier, Wagner, Daerr, van den Bussche, Zimmermann, Köhler, Bickel, Mösch, Weyerer, Kaufeler, Pentzek, Wiese, Wollny, König and Riedel-Heller2012), statistically significant differences were observed on both Total Recall (x 2[2] = 29.86, p < .001) and Delay Recall (x 2[2] = 161.61, p < .001). For each of these Word List scores, there were more intact participants falling into the “decline” category (and less in the “stable” category) than expected (see Table 5).
Chi-square tests on those who decline, remain stable, or improve in the intact participants based on Stein et al. (Reference Stein, Luppa, Luck, Maier, Wagner, Daerr, van den Bussche, Zimmermann, Köhler, Bickel, Mösch, Weyerer, Kaufeler, Pentzek, Wiese, Wollny, König and Riedel-Heller2012)

Table 5. Long description
A table with two rows and five columns comparing the percentages of participants who decline, remain stable, or improve in recall tests. The columns are labeled Decline, Stable, Improve, Chi-square (df), and p. The first row, labeled Total, shows 9.5 percent decline, 85.7 percent stable, 4.8 percent improve, Chi-square value of 29.9 (2), and p value of less than 0.001. The second row, labeled Delay, shows 15.3 percent decline, 78.1 percent stable, 6.6 percent improve, Chi-square value of 161.6 (2), and p value of less than 0.001.
Note: Based on a normal distribution, 5% would be expected to decline, 90% to remain stable, and 5% to improve.
Generation of change data
For each linear regression model, the Time 2 CERAD Word List score was significantly predicted (p < .001) by their respective Time 1 score, demographics, retest interval, and use of an alternate form (see Table 6).
Regression models predicting time 2 Word List scores based on intact participants

Table 6. Long description
The table presents regression models predicting Time 2 Word List scores. It includes columns for Word List score, R-squared, SEE, and the regression equation. The rows are labeled as Trial 1, Trial 2, Trial 3, Total, Delay, Recognition raw, and Recognition scaled. Each row provides specific values for the respective columns. For example, Trial 1 has a Word List score of 28, R-squared of 1.36, SEE of 6.66, and a detailed regression equation. The table also includes statistical values such as F, df, and p for each model.
Note: SEE = standard error of the estimate, Time 1 = score at Time 1, age (in years), ed = education (in years), sex (male = 1, female = 2), race (white = 1, non-white = 2), interval = retest interval (in days), alt = use of an alternate form (0 = same form, .5 = unknown, 1 = alternate form).
Preliminary validation of new change data
Group comparisons of change data
These new change data were applied to participants in each of the five groups, and the results are presented in Table 7. Across the five groups, there was a significant group difference on the Total Recall SRB z-scores (F[4,1372] = 137.13, p < .001), with a large effect size (partial eta-squared = .29). In post-hoc comparisons, intact, improving < MCI, worsening < dementia (all significant p-values at < .001). On the SRB z-score for Delay Recall, there was also a significant group difference (F[4,1372] = 157.63, p < .001), with a large effect size (partial eta-squared = .32) and a similar pattern across groups (intact, improving < MCI, worsening < dementia, all significant p-values at < .001).
Word List SRB z-scores for each group based on new change data

Long description
A table comparing Word List SRB z-scores across different cognitive groups. The table has five rows and three columns. The columns are labeled Intact, MCI, Dementia, Worsening, and Improving. The rows are labeled Total and Delay. Each cell contains numerical values with confidence intervals. Row 1: Intact, -0.05 (0.99) [-3.16 -3.14]; MCI, -0.66 (1.13) [-5.01 -2.37]; Dementia, -1.93 (1.14) [-5.11 -2.30]; Worsening, -0.89 (1.28) [-5.18 -3.04]; Improving, 0.13 (1.10) [-2.57 -1.64]. Row 2: Intact, -0.03 (1.00) [-4.39 -3.23]; MCI, -1.00 (1.14) [-4.01 -2.23]; Dementia, -1.91 (0.90) [-4.76 -0.94]; Worsening, -0.93 (1.22) [-5.41 -2.09]; Improving, -0.17 (1.19) [-2.99 -1.60].
Note: MCI = mild cognitive impairment, SRB = standardized regression-based.
Frequency of change classifications using new change data
Using the Duff et al. (Reference Duff, Atkinson, Suhrie, Dalley, Schaefer and Hammers2017) method, when only the intact participants were examined with a one-sample chi-square test of probabilities such that 5% would “decline,” 90% would remain “stable,” and 5% would “improve” based on the new SRB change data, Total Recall met those expectations (x 2[2] = 2.63, p = .27). Conversely, for Delay Recall there were statistically more participants in the decline group and less in the improve group than expected (x 2[2] = 7.50, p = .02). However, the effect size of this latter finding was small (Cohen’s w = .10). The percentage of decline/stable/improve for all five groups is presented in Table 8.
Trichotomization of Word List SRB z-scores for each group based on new change data

Table 8. Long description
The table presents the percentage of participants in decline, stable, and improve categories across different cognitive status groups. It has five columns: Intact, MCI, Dementia, Worsening, and Improving, with each column further divided into Total and Delay rows. The Intact column has 803 participants, the MCI column has 213 participants, the Dementia column has 209 participants, the Worsening column has 119 participants, and the Improving column has 33 participants. Each cell contains three values representing the percentages of participants in decline, stable, and improve categories respectively. For example, the Intact Total row shows 5.3 percent decline, 89.8 percent stable, and 4.9 percent improve.
Note: In each cell, percent declined/percent stable/percent improved.
Discussion
The present study sought to develop and preliminarily validate updated normative data and regression-based change scores for the CERAD Word List in a large cohort of robustly intact older adults who were assessed at two time points approximately 1.3 years apart. Although normative data exist for this list learning test (Kirsebom et al., Reference Kirsebom, Espenes, Hessen, Waterloo, Johnsen, Gundersen, Botne Sando, Rolfseng Grøntvedt, Timón and Fladby2019; Wagle et al., Reference Wagle, Selbæk, Benth, Gjøra, Rønqvist, Bekkhus-Wetterberg, Persson and Engedal2023; Welsh et al., Reference Welsh, Butters, Mohs, Beekly, Edland, Fillenbaum and Heyman1994), those normative sets have limitations. Similarly, only a single study was identified that examined change on the CERAD Word List (Stein et al., Reference Stein, Luppa, Luck, Maier, Wagner, Daerr, van den Bussche, Zimmermann, Köhler, Bickel, Mösch, Weyerer, Kaufeler, Pentzek, Wiese, Wollny, König and Riedel-Heller2012), and this study used RCI scores, which do not account for key variables known to affect cognitive change. As such, there was a need to develop additional normative and change metrics to augment its utility in research and clinical evaluations.
New normative data
Initially, the study sought to determine if updated norms for the CERAD Word List were warranted by examining the ability for existing normative data to characterize the current independent data set. When the normative data from Wagle et al. (Reference Wagle, Selbæk, Benth, Gjøra, Rønqvist, Bekkhus-Wetterberg, Persson and Engedal2023) were applied to the current sample, the results suggested that the existing norms did not fully characterize the expected memory performance across diagnostic groups. For example, among individuals in the current sample, only 10.8% and 6.9% of these participants fell below the −1 SD cutoff for Total Recall and Delay Recall, respectively, where 16% would be expected. This suggests that the Wagle et al. (Reference Wagle, Selbæk, Benth, Gjøra, Rønqvist, Bekkhus-Wetterberg, Persson and Engedal2023) norms may be too lenient and fail to identify cognitive difficulties in older adults in a U.S. sample. To further support this supposition, individuals identified as having MCI via consensus conference at an Alzheimer’s Disease Research Center demonstrated CERAD Delay Recall scores that were much closer to the average range (e.g., mean z-score = −0.12) than would typically be expected for this population, which provides additional evidence of reduced sensitivity to impairment in the Wagle et al. (Reference Wagle, Selbæk, Benth, Gjøra, Rønqvist, Bekkhus-Wetterberg, Persson and Engedal2023) norms. Finally, whereas demographic variables (age, education and sex) did not explain additional variance for Total Recall performance, they did significant predict additional variance in “already-corrected scores” within the entire sample, indicating that the Wagle et al. (Reference Wagle, Selbæk, Benth, Gjøra, Rønqvist, Bekkhus-Wetterberg, Persson and Engedal2023) norms do not fully correct for these demographic variables on the CERAD.
Since new normative data appeared warranted, regression-based normative models were generated using a large sample of robustly cognitively intact older adults. Across these learning and memory scores, demographic variables (age, education, sex, and race) accounted for approximately 5–20% of the variance in scores, comparable to regression-based normative data developed for other cognitive tests in older adults (Duff & Ramezani, Reference Duff and Ramezani2015). Such corrections seem important for clinical interpretation, as failing to account for these variables may lead to misclassification of the memory functioning of older individuals. Increased accuracy for detection of memory decline can improve diagnostic precision, enhance sensitivity for identification of longitudinal changes in clinical trials, and advance scientific understanding of neurodegenerative processes. Improved normative data may further increase the utility of the CERAD Word Lists in clinical neuropsychological practice. This verbal memory test uniquely presents stimuli to individuals with auditory and visual exposure to the word list, which may improve assessment of memory in individuals with hearing impairment. With alternate forms available, the CERAD Word List is also ideal for longitudinal cognitive monitoring in a memory disorders clinic.
To preliminarily validate these newly developed normative data, they were applied back to the full sample. Across diagnostic groups, the cognitively intact individuals had mean z-scores near zero, and individuals with MCI and dementia showed progressively lower scores, with approximately 15–16% of individuals at or below −1 SD on Total and Delay Recall, matching theoretical expectations. Finally, demographic variables did not explain additional variance, suggesting that the regression-based approach adequately accounted for the influence of age, education, sex, and race. Taken together, the current norms may provide a more accurate and clinically useful way of evaluating CERAD Word List performance in older adults, although additional independent validation is needed.
Of note, a small portion of participants (2% of total sample) moved to a less severe diagnostic classification group at follow-up (e.g., MCI to intact, dementia to MCI). This type of reversion is quite common in MCI transitioning to cognitively intact (Zhao et al., Reference Zhao, Wei, Liu, He, Li, Gao, Wang, Li, Nan, Wang and Ma2025). These diagnostic changes are unlikely evidence of true clinical improvement (i.e., reversal of an underlying neurodegenerative process). Rather, they may reflect inaccuracy of the original diagnostic classifications, fluctuations across longitudinal evaluations, interindividual variability in cognitive performance, and treatment of reversible cognitive factors (Malek-Ahmadi, Reference Malek-Ahmadi2016).
New change data
When applying those RCI formulas generated by Stein et al. (Reference Stein, Luppa, Luck, Maier, Wagner, Daerr, van den Bussche, Zimmermann, Köhler, Bickel, Mösch, Weyerer, Kaufeler, Pentzek, Wiese, Wollny, König and Riedel-Heller2012) to the current sample, a disproportionate percent of the cognitively intact participants were categorized as declining on the CERAD Word List. For example, on Total Recall, nearly double the rate of decline was observed (9.5%) compared to the expectation (5%), and more than three times the number of intact participants showed decline on Delayed Recall (15.3% vs expected 5%). Since these robustly cognitively intact individuals would not be expected to decline over the year follow-up period, these results suggest that the RCI data of Stein et al. (Reference Stein, Luppa, Luck, Maier, Wagner, Daerr, van den Bussche, Zimmermann, Köhler, Bickel, Mösch, Weyerer, Kaufeler, Pentzek, Wiese, Wollny, König and Riedel-Heller2012) may inaccurately track change on the CERAD word list for some individuals. These discrepant results are likely due to the authors’ use of a RCI model, which does control for practice effects but only loosely controls for demographics. The RCI model also fails to correct for baseline performance on the CERAD Word List, retest interval, use of alternate forms, and regression to the mean, which all appear to influence cognitive change over time (Calamia et al., Reference Calamia, Markon and Tranel2012).
Since the RCIs of Stein et al. (Reference Stein, Luppa, Luck, Maier, Wagner, Daerr, van den Bussche, Zimmermann, Köhler, Bickel, Mösch, Weyerer, Kaufeler, Pentzek, Wiese, Wollny, König and Riedel-Heller2012) resulted in concerns about accurate identification of cognitive decline, the current study sought to develop new SRB change formulas (Duff, Reference Duff2012). As noted in Table 6, 44% and 38% of the variance in CERAD Total Recall and Delayed Recall follow-up scores, respectively, were significantly accounted for by baseline scores, demographics, retest interval, and use of alternate forms. Accounting for this amount of variance in follow-up scores is typical for these analyses with other auditory memory tests in older adults (Duff et al., Reference Duff, Beglinger, Moser, Paulsen, Schultz and Arndt2010; Schaeverbeke et al., Reference Schaeverbeke, Gabel, Meersmans, Luckett, De Meyer, Adamczuk, Nelissen, Goovaerts, Radwan, Sunaert, Dupont, Van Laere and Vandenberghe2021). In the current analysis, the SRB models were less impressive for the Recognition trial scores (raw or scaled), only accounting for 16–19% of the variance in follow-up scores. With approximately 80% of the variance being unexplained in these recognition scores, future research examining other factors that may contribute to these prediction models (e.g., biomarkers, medical comorbidities) is warranted. In the meantime, the SRB scores for the Recognition trial should be interpreted cautiously, as they may inaccurately identify cognitive change.
To preliminarily evaluate these new change scores, formulas were applied to the current cohort of five groups. As outlined in Table 7, the current SRBs z-scores meet the expected patterns within each of these groups. Similarly, when these SRB z-scores were trichotomized as decline (<−1.644), stable (−1.644–1.644), or improved (>1.644) (Table 8), performance on CERAD Total Recall in the cognitively intact sample indicated that 5% declined, 90% remained stable, and 5% improved, which would be expected based on a normal distribution of change. However, in the MCI group, three times more participants declined (15.2%) and very few improved (0.4%). For those in the dementia group, over half were identified as declining (55.5%), with again very few improving (0.4%). For Delayed Recall trial, a similar pattern emerged in these three groups regarding decline (intact = 6.6% declined, MCI = 33% declined; dementia = 71.6% declined). These findings suggest that these newly developed SRBs, at least when applied to the current sample of older adults, are valid methods of identifying cognitive change in older adults, with and without cognitive impairment. Although it remains unclear just how many individuals with MCI or dementia should demonstrate meaningful decline across one year, these results seem to suggest that the newly developed SRB formulas could be used across the spectrum of cognitive functioning, allowing the CERAD Word List to be employed as a longitudinal measure of memory before the onset of cognitive decline and throughout the disease process (e.g., cognitively normal to MCI and dementia).
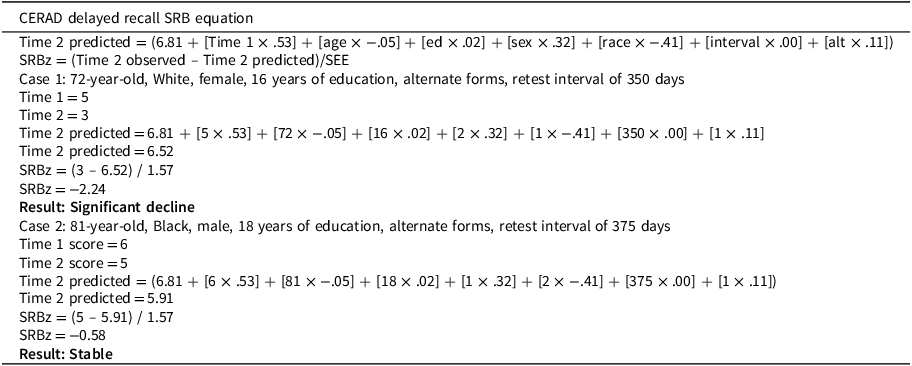
Since less are familiar with SRB change formulae, two case examples might be illustrative. Using the results for Delayed Recall of the CERAD in Table 6, change scores were generated for two hypothetical cases (see Table 9). In Case 1, a 72-year-old, White female with 16 years of education was retested after 350 days using an alternate form of the CERAD Word List. Her Delayed Recall raw scores were 5 at Time 1 and 3 at Time 2. Using the newly developed SRB formulas, this patient’s Time 2 was predicted to be 6.52, which notably differs from her observed Time 2 score of 3, which reflects a statistically significant decline (SRB z-score = −2.24). In Case 2, a 71-year-old, Black male with 18 years of education was retested after 375 days using an alternate form of the CERAD Word List. His Delayed Recall raw score were 6 at Time 1 and 5 at Time 2. His predicted Time 2 score of 5.91 does not reflect a statistically significant change from his observed Time 2 score of 5, which is quantified in his SRB z-score of −0.58.
Case examples of SRB formula for CERAD delayed recall

Table 9. Long description
An equation for predicting cognitive decline using CERAD delayed recall scores. The equation is Time 2 predicted equals 6.81 plus Time 1 multiplied by 0.53 plus age multiplied by 0.05 plus education multiplied by 0.02 plus sex multiplied by 0.32 plus race multiplied by 0.41 plus interval multiplied by 0.00 plus alternate forms multiplied by 0.11. SRBz is calculated as Time 2 observed minus Time 2 predicted divided by standard error of estimate. Two cases are presented. Case 1 involves a 72-year-old White female with 16 years of education, retested after 350 days, showing a significant decline. Case 2 involves a 71-year-old Black male with 18 years of education, retested after 375 days, showing stable results.
Note: SEE = standard error of the estimate, Time 1 = score at Time 1, Time 2 = score at Time 2, age (in years), ed = education (in years), sex (male = 1, female = 2), race (white = 1, non-white = 2), interval = retest interval (in days), alt = use of an alternate form (0 = same form, .5 = unknown, 1 = alternate form). Statistically significant change is defined at SRBz = ±1.645.
Limitations
The current study does have some limitations to note. First, the sample was relatively homogenous regarding race and ethnicity, with a majority of individuals identifying as White. Similarly, while the sample size was large, the findings reflect data collected at one site in the Pacific Northwest of the United States and may not reflect the greater national and international population. Furthermore, normative data developed in one country may not generalize fully to populations in other countries. As such, independent validation in international samples is needed before assuming comparable performance of these formulas across countries. More broadly, the findings should be replicated in demographically and geographically diverse samples to confirm or refute the utility of these new normative data and SRBs in other regions and with diverse populations. Second, the present study did not include biomarker data or categorize individuals into cognitive domain-specific groups (e.g., amnestic MCI, multi-domain MCI), which are relevant to change in cognitive performance over time. Examination of the findings within the context of biomarkers and cognitive subtyping would enhance the utility of these new normative data and SRBs. Third, the change data used to develop these new SRBs examined cognitive performance across a 12-month test–retest interval, which may limit their utility at longer test–retest intervals, which is common in clinical neuropsychological practice. Finally, a locally developed alternate form of the Word List was used in the current study. Those interested in this alternate form can contact the corresponding author. However, since it was not available for the prior normative and change studies (Stein et al., Reference Stein, Luppa, Luck, Maier, Wagner, Daerr, van den Bussche, Zimmermann, Köhler, Bickel, Mösch, Weyerer, Kaufeler, Pentzek, Wiese, Wollny, König and Riedel-Heller2012; Wagle et al., Reference Wagle, Selbæk, Benth, Gjøra, Rønqvist, Bekkhus-Wetterberg, Persson and Engedal2023), it is unclear how this alternate form might have influenced the comparison to these prior studies.
In summary, the current demographically-based prediction scores provide normative data for the CERAD Word List subtest for older adults being evaluated for cognitive complaints. Additionally, the regression-based change scores allow clinicians and researchers to accurately track change on the Word List subtest of the CERAD by comparing their patients/participants to the current sample of robustly intact older adults.
Acknowledgments
This work was supported by National Institute on Aging P30AG024978, P30AG66518.
Competing interests
There are no conflicts of interest to report.






 Open access

