

Imitation is a growing and widespread phenomenon with a great historical impact on economic development.Footnote 1 Although it is difficult to provide precise estimates of the extent of imitation around the world, studies have estimated that in 2013 it corresponded to about 2.5 percent of world trade, having increased from an estimated 1.9 percent in 2008.Footnote 2 Additionally, many goods and services appearing for the first time in marketplaces as “new” innovations are in fact “innovative imitations.”Footnote 3 At present, imitations are considered in most markets to be illicit, as they copy existing products and trademarks and aim to confuse consumers, thereby taking trade away from innovators.Footnote 4 Several studies have analyzed the impact of product imitation on both the growth and profitability of businesses and the well-being of consumers. These studies highlight that, for example, imitations influence levels of employment, inward and outward foreign direct investment, international trade, and countries’ tax revenues.Footnote 5
The meanings of “imitation” and “adulteration” are not universal and have changed over time. These concepts are generally associated with the appropriation of reputation and legitimacy that belong to an innovator. “Imitation” refers to the act of copying or deriving something from an original, where someone or something closely imitates or mimics another person or product. “Adulteration” refers to the mixing of particular kinds of beverages with unrelated substances such as chemical additives, water, and sugar, as ways to fortify, provide color to, or change the characteristics of the beverages, mainly of wines.
This article aims to engage with these issues of imitation and adulteration by taking the analysis back in time, when imitation was not considered illicit and when enforcement of the law was not always effective. The article highlights the different ways in which imitation has impacted on the development of the global wine industry.Footnote 6 It draws on the period from 1850 to 1914, when wine represented about 50 percent of the total international trade in alcoholic beverages.Footnote 7
Only a few estimates exist regarding the amount of imitation and adulteration in wines, some at the country level, others at the regional level, and others at the product level. For instance, in 1872, Britain was considered to be the country where most adulterated wines were sold, with imitations comprising approximately 20 percent of all wine imports into the country.Footnote 8 In 1903, counterfeit and adulterated wine in France was estimated to be over fifteen million hectoliters, equivalent to some 40 percent of the official harvest.Footnote 9 In 1907, discussions were carried out in the Portuguese parliament, where it was argued that of the sixty thousand barrels of port wine exported, only one-third contained wines produced with grapes from the Douro region.Footnote 10 In that same year, more than fifty thousand barrels of fake port were produced in California.Footnote 11
At a macroeconomic level it is also possible to have an idea about the significance of the imitation and adulteration of wines by looking at a series of proxies, such as protests by wine growers from highly reputed wine regions; articles and advertisements in newspapers about this phenomenon; parliamentary documents in which governments discussed the protection of the interests of wine-producing regions; discussions at international conferences and conventions about protecting denominations of origin and intellectual property rights associated with the wine industry; and the signing of bilateral treaties with other states.Footnote 12
This study analyzes and contrasts the impact of imitation and adulteration of wines across multiple countries: in particular, Old World producers and traders such as France, Spain, and Portugal; New World producers such as Argentina, Chile, and the United States; and important traders and consumers of wines such as Great Britain and Brazil. These countries are analyzed in detail not only because of their relevance as producers and consumers but also because they illustrate the trends that were taking place in different parts of the world during the period of analysis. References to other countries, such as Italy and Australia, and to other alcoholic beverages, such as liqueurs and whisky, are also included to show that this practice of adulteration and imitation of alcoholic beverages was not unique to the wine industry.
The article investigates the relations between manufacturers, distributors, and retailers of both imitations and genuine wines. It analyzes their role in the development of the global wine industry, during a period when production and trade were quite important in the economies of several of these countries. Following this introduction, section 2 offers an overview of the evolution of the global trade in wine. Section 3 provides evidence of wine imitation in different parts of the world and of the strategies that imitators followed. Section 4 discusses how imitation and adulteration of wines has had not only an economic and political but also cultural and social impact on society. Finally, section 5 presents some conclusions highlighting the hybridity of imitation and adulteration in terms of its impact on economic development.
Global Trade in Wines and other Alcoholic Beverages
The first wave of globalization is characterized by an increase in global trade and investment.Footnote 13 In the alcoholic beverages industry, the pattern was reversed. With some exceptions—including cognac, Scotch whisky, gin, and some beer brands, which were already traded globally in the nineteenth century—most spirits and beer were still very much locally produced and consumed beverages.Footnote 14 In contrast, wine, which had traditionally been traded globally as a commodity, suffered significant fluctuations during this period associated with a multitude of factors, which radically changed its geography of production and trade.Footnote 15 Various pests and diseases—Olidium, Phylloxera, and mildew—affected all of the vineyards in Europe from the 1850s, leading to a major drop in production across southern European countries (i.e., France, Spain, and Portugal). As a result, these countries started to produce and trade imitations and adulterated wines to make up for the lack of local production while simultaneously trying to replant the regions affected.
During this period most exported wine was contained in barrels, which facilitated adulteration by unscrupulous distributors and retailers in key markets. Wines to which chemicals, water, alcohol, and sugar, among other substances, were added tended to be sold cheaply. They were being produced in different regions, including traditionally wine-producing regions, and often claimed fake denominations of origin to associate the beverages with popular regions that had established reputations.Footnote 16 While fraud had always been present in most food and beverage markets, its nature changed significantly during this period. This was mainly because of the growing physical separation between producers and consumers, and the development of new preservatives that allowed manufacturers to lower costs of adulterations, and mask food deterioration, often making food adulteration imperceptible to consumers. In markets such as Britain it was legal to sell “British claret,” “Hamburg sherry,” or “Spanish port.” This phenomenon confused consumers and created a lack of trust among them.Footnote 17 Retailers attempted to impose their own brands on consumers with no success, as the wines varied in quality and were often adulterated.Footnote 18 Adulteration also threatened the activities of innovator firms, owners of strong brands such as Moët & Chandon or Martell Cognac, which saw their sales decline as a result of the decline in the collective reputation of their regions of origin and the imitation of their brands. All of these factors led, at the turn of the century, to a crisis of overproduction and a sharp drop in prices.Footnote 19 Growers, winemakers, and merchants from the Old World started to lobby governments to introduce laws and create new institutions that would regulate markets and stop adulteration and imitation. The political voice and bargaining power of these economic agents varied greatly both within and between countries, leading to the introduction of very different policies.Footnote 20
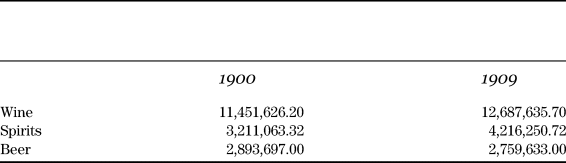
In the New World, tariffs imposed by some countries on imports also encouraged imitation and adulteration by local entrepreneurs.Footnote 21 The aim of these tariffs was to substitute imports by encouraging local production. Imitation contributed to the development of new, local industries. Initially most of the wines produced in the New World imitated reputed European denominations of origin.Footnote 22 Indeed, denominations of origin such as Jerez (Spain), Porto (Portugal), and Marsala (Italy) very quickly became known and standardized as generic products, their names often printed in lowercase, as in the cases of “wine,” “water,” or “beer.”Footnote 23 The New World was associated with a large population of immigrants; the attractiveness of foreign goods there, in particular from France, Spain, and Italy, explained in part the growing accusations of copycats and imitations in these regions of the world.Footnote 24 Producers in New World countries imitated and adulterated all types of alcoholic beverages, including spirits, such as aperitifs, and sweet distilled wines, for which a high demand existed. Table 1 shows the amount of world exports in wine, spirits, and beer for the years 1900 and 1909, highlighting the significance of wine, which represented around 65 percent of total trade in alcoholic beverages during this period.
World Exports in Wine, Beer, and Spirits, 1900 and 1909 (in hectoliters)

Source: U.K. Board of Trade, Alcoholic Beverages: Twentieth Century House of Commons Sessional Papers 44 (1911), 533.
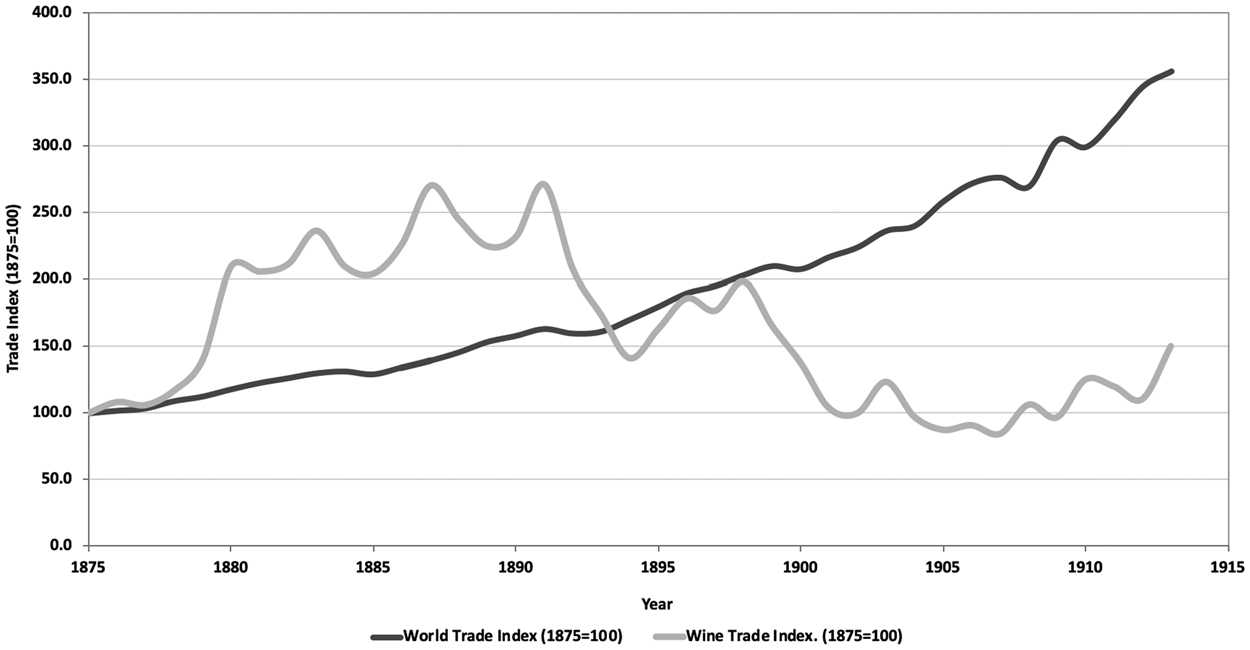
The data relating to world trade is often used as an indicator of the stage of globalization of the world economy during that period, together with other variables such as foreign direct investment, flows of capital, and flows of people. Figure 1 compares the growth rate for the world trade index of merchandise in general with the wine trade index. It shows that the wine trade grew at a faster pace than world trade until the early 1890s and then decreased sharply.
Index of evolution of global trade and wine trade, 1875–1913. Note: Data on wine exports includes only France, Italy, and Spain. These countries accounted for 75 percent to 85 percent of world exports between 1870 and 1909. Amounts given in hectoliters. (Sources: William Arthur Lewis, “The Rate of Growth of World Trade, 1870–1973” in The World Economic Order: Past and Prospects, ed. Sven Grassman and Erik Lundberg (London and Basingstoke, 1981), 11–71; Vicente Pinilla, “Wine Historical Statistics: A Quantitative Approach to Its Consumption, Production and Trade, 1840–1938,” [working paper no. 1409, 2014, 12–13, Documentos de Trabajo de la Sociedad Española de Historia Agraria], https://ideas.repec.org/p/seh/wpaper/1409.html.)

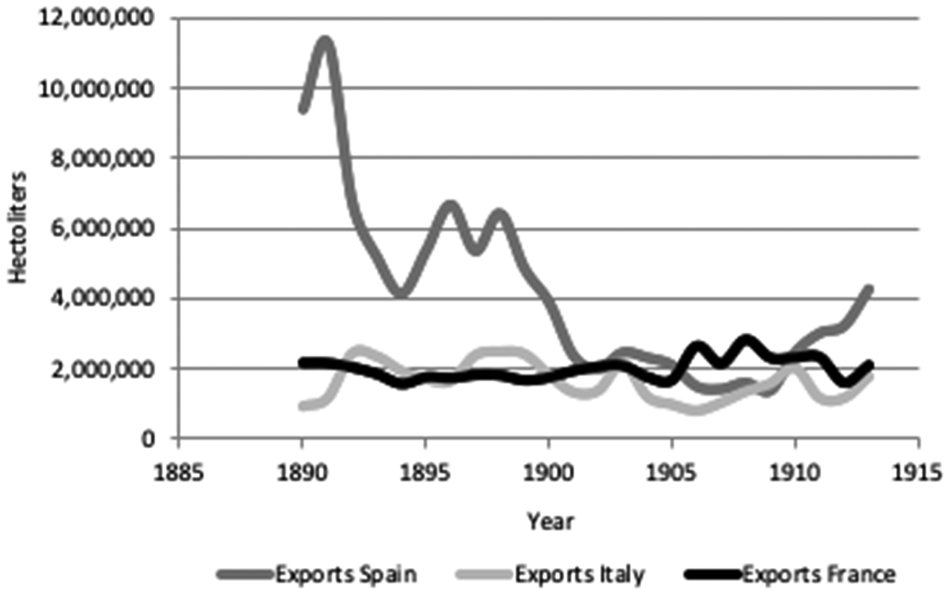
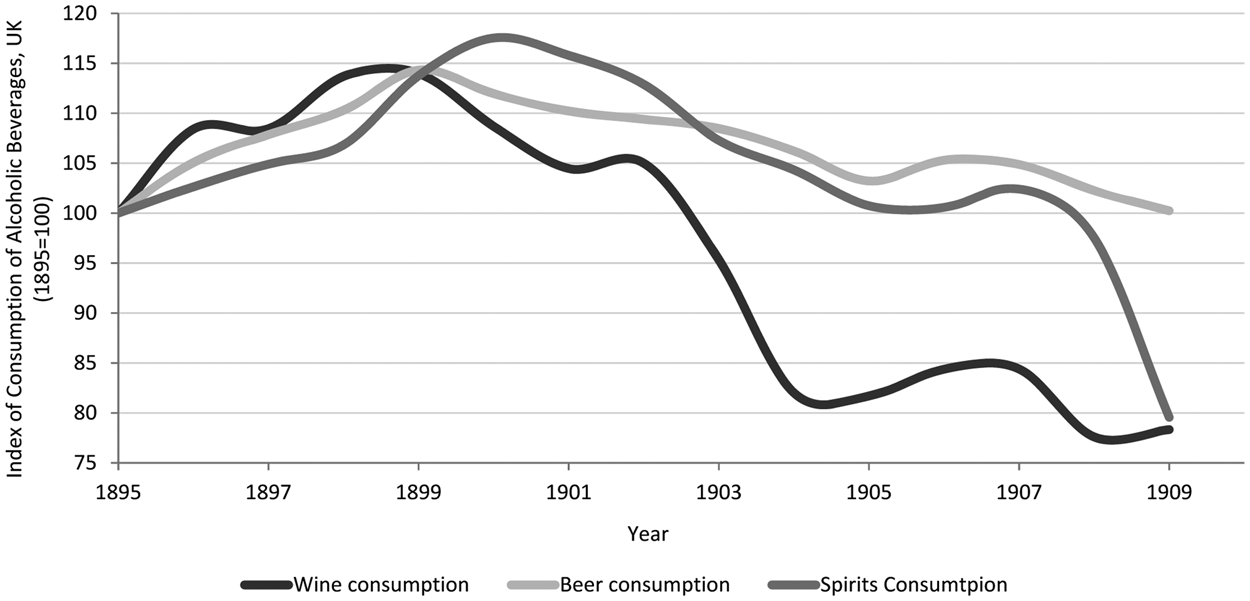
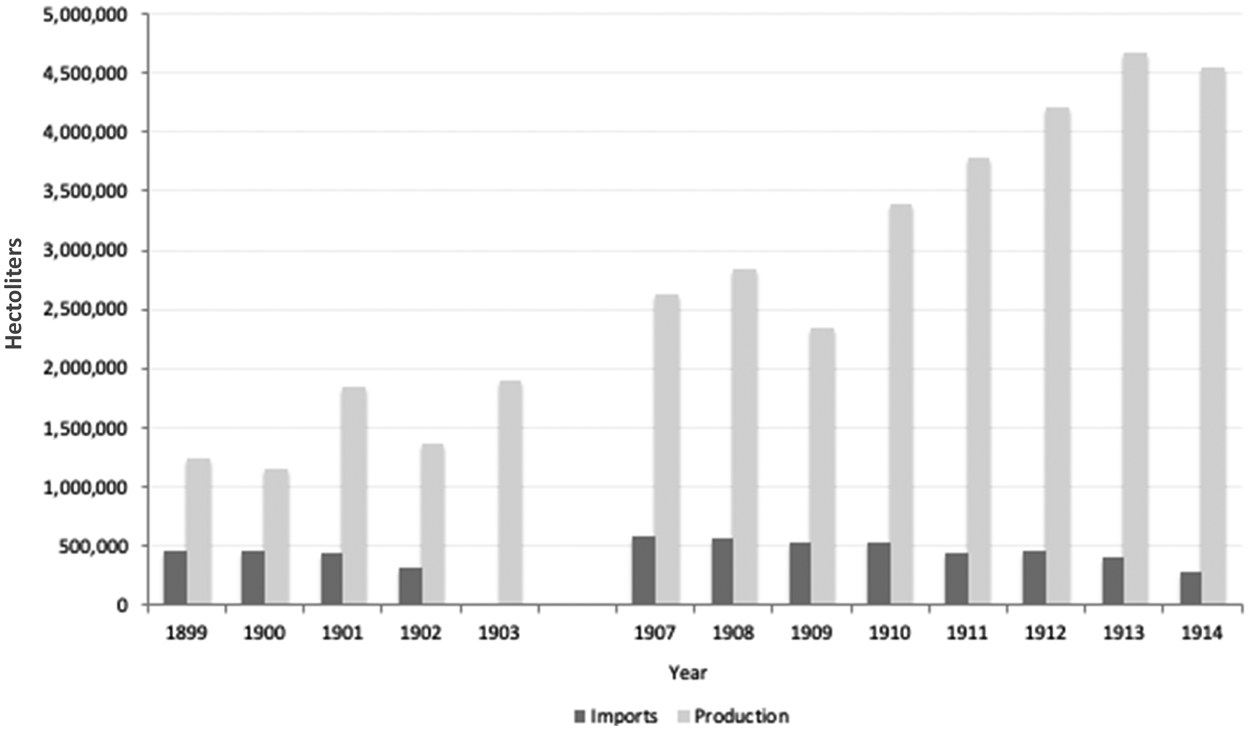
The decline in the index of world trade in wine is associated with the sharp decline of exports of the main wine-producing countries: Spain, France, Italy, and Portugal (see Appendix figure 1). The exports that fell most sharply were those of Spanish wines, as a result of the protectionist policies from 1892 imposed by France, its main market of destination, which aimed to stimulate domestic production. Additionally, France substituted its traditional imports from Spain for imports from Algeria, which was then a French colony.Footnote 25 Other important changes in the trade of alcoholic beverages took place during this period. In Great Britain, traditionally a leading importer of wines, there was a decrease in consumption, largely owing to consumers’ lack of trust regarding the purity of the wines (see Appendix figure 2). In the New World, as previously mentioned, markets started replacing imports with domestic production. In the case of Argentina, for example, between 1889 and 1914 imports dropped approximately 74 percent, while domestic production increased almost fourfold between 1899 and 1914 (see Appendix figure 3).Footnote 26 A similar trend can be identified in other New World markets; in Australia, for instance, during the period of analysis most wines were judged using European standards and classified into European types.Footnote 27
Strategies of Imitation and Adulteration
Several strategies of imitation and adulteration allowed merchants to widen their portfolios of wines and increase their bargaining power within value chains.Footnote 28 Most producers of imitations and adulterations added different substances (such as foreign brandy or industrial alcohol) to wines and labeled the results as well-known brands or as originating in reputable appellations. For example, many wines were circulated in the market that were labeled “port” and yet were not produced in the Douro region in the North of Portugal; instead, they came from different regions around the world: Lisbon, Tarragona (Spain), Sète (France), Hamburg, Cape Town, and California, among other places.Footnote 29 The producers of such mixtures often advertised themselves as “manufacturers of port wine.”Footnote 30
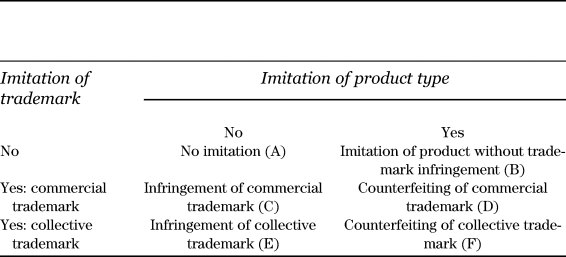
It is possible, however, to identify various other strategies used in the imitation and adulteration of wines and other alcoholic beverages. Table 2 shows two types of imitation strategies: imitation of trademark and imitation of product type. There are two types of imitation of trademark: imitation of a commercial trademark, relating to individual brand owners, and imitation of a collective trademark, associated with geographical denominations of origin.
Dimensions of Imitation Strategies in Alcoholic Beverages

Source: Table by authors extending the work of Teresa da Silva Lopes and Mark Casson, “Brand Protection and Globalization of British Business,” Business History Review 86, no. 2 (2012): 292.
In cases where the product is imitated but not the trademark, and thus there is no trademark infringement, the imitation is known as a look-alike, or copycat (see Table 2, cell B).Footnote 31 This is considered to be legitimate business, associated with processes of competition or even with the first steps toward incremental innovation. In Spain, for example, the creation of Rioja wines was the result of imitation of Bordeaux wines. The expansion and modernization of the Rioja region in the second half of the nineteenth century was the result, to a large extent, of the adoption of techniques used in the production of wines in the Bordeaux region. Wines were labeled using expressions which mixed French with Spanish wine producing regions, such as “médoc alavés” or “médoc riojano.” While imitation of the product and the technologies of production took place, there was no imitation of the commercial or collective trademarks. Sometimes, the technicians hired for the production of Rioja wines had previously worked in Bordeaux. The French influence on the establishment of the Rioja wine region is also seen in the names of some firms and estates created in Spain during this period, such as Bodegas Franco-Españolas (1890) and Château Ygay (1893), but Rioja wines were not being sold as Bordeaux wines.
This type of imitation without trademark infringement was a success. The commercial flow of wines between the Rioja and Bordeaux regions developed in the 1880s, with France importing increasing quantities from Rioja wine. These imports made up for the drop in wine production in the Bordeaux region resulting from the Phylloxera infestation. However, and as previously mentioned, in the 1890s, the reconstruction of many vineyards in France, the increase in wine imports from Algeria, and the protectionist measures imposed by the French government led to a near halt of imports of wines from Rioja and other foreign regions.Footnote 32 As a result, the wine producers from Rioja, which had made large investments targeted to that particular market, had to change their strategies, by investing in the domestic market and in other foreign markets, but continued marketing their wines with French designations. It is possible, however, to find some Rioja wine producers following strategies associated with the counterfeiting of a collective trademark, characterized by imitation of product and use of false region of origin (see Table 2, cell F). For example, at the beginning of the twentieth century Bodegas Bilbainas traded the following beverages, among others: Cognac Faro, Rioja Clarete, Cepa Borgoña, Cepa Sauternes, Tarragona port, South African sherry, and Catalan champagne.Footnote 33
Another illustration of a successful strategy of imitation without trademark infringement (Table 2, cell B) is the case of cava, the Spanish sparkling wine that emerged around the same time as Rioja wine, mainly in the Catalonia region of Spain. This type of sparkling wine (sometimes presented as “Spanish champagne”) was developed as an imitation of real French champagne but with a different name and denomination of origin.Footnote 34
An example of the infringement of commercial trademark (Table 2, cell C)—where it is the commercial or individual trademark that is imitated, not the product—is the case of Hiram Walker & Sons. “Hiram Walker & Sons” is a Scotch whisky trademark and, in the late nineteenth century was owned by a company with the same name. In Argentina, Hiram Walker & Sons—registered the Walker family coat of arms as a trademark for its Scotch whisky in 1889 (trademark numbers 1686 and 1687). However, in 1893, Fernando Rossi, an Argentinean company, registered the same trademark (“Hiram Walker”) for selling locally made “cognac” (trademark number 3639). This case also falls under the category of infringement of collective trademark (Table 2, cell E), in that Fernando Rossi was also using a false collective trademark “cognac”: a geographical denomination of origin that was not the denomination of origin associated with the original brand.
In such cases of infringement of collective trademark, or unauthorized brand extension, a product is not imitated but there is misuse of the collective trademark. That is, the imitator applies the collective trademark to one of their own products, rather than to a copy of the innovative good of the same kind. A series of curious cases of this type of imitation can be found in Brazil. In the last quarter of the nineteenth century, it was common for “manufacturers” of alcoholic beverages (a name used for producers of artificial alcoholic beverages, which produced on a large scale wines using chemicals and other substances and machinery) to register trademarks that combined multiple reputed denominations of origin, such as “cognac moscatel” or “cognac fine champagne.” These were artificial wines manufactured primarily in Rio de Janeiro and São Paulo.Footnote 35 In Portugal, at the end of the nineteenth century, there was also a fashion among the urban middle classes of drinking foreign beverages, particularly cognacs and champagnes. The advertisements and trademark registrations of that time also include a large number of trademarks of such “styles” of foreign beverages produced in Portugal, such as “port wine character,” “champagne method,” and “madeira style,” “port style,” and “champagne style.” Given that during this period there was no legal protection for denominations of origin (which only became protected in the twentieth century), these fake denominations of origin were not considered to be counterfeits (or illegal), as they clearly highlighted the word “style.” These wines were sold at prices substantially lower than the genuine wines that they imitated. They were also easy to detect as imitations, except by consumers who were not very attentive or informed. In Great Britain it was common for large retailers to sell imitations together with genuine wines. For example, Victoria Wine Company, a leading retailer during the nineteenth and early twentieth centuries, included in its November 1886 wine price list in London a series of port wines from Porto along with two fake “Spanish Ports,” which were cheaper.Footnote 36
Counterfeiting is the most damaging scenario for innovators. These cases involve the imitation of not only the product or service but also the trademark without authorization by the innovator (Table 2, cells D and F).Footnote 37 Being a direct copy, a counterfeit is very likely to confuse the consumer and thereby take trade away from the innovator.Footnote 38 The fact that, in most cases, genuine alcoholic beverages were exported in barrels made imitation and adulteration relatively easy at various points in the value chain. In multiple countries the press reported many cases in which barrels bearing the label of famous wines and spirits traders, as well as bottles marked with famous brands, once emptied, were refilled by producers of fraudulent wines, spirits, and beers in order to take advantage of the reputation of those established alcoholic beverages brands.Footnote 39 For example, the British wine merchant Gilbey's sued a former agent, grocer and wine and spirits merchant Wilkinson and Co., for filling returned Gilbey's bottles with other spirits without removing the original Gilbey's labels.Footnote 40
The counterfeiting of collective trademarks is characterized by misuse of the collective denomination of origin. There are multiple cases of “champagne,” “madeira,” “port,” “sauterne,” “gin,” “malaga,” and “French Châteaux” being advertised and sold, in both the New and Old World.Footnote 41 In Chile, it is possible to find wines sold as “Burdeos of Talca,” “Borgoña of Curico,” and “Cognac Chileno.”Footnote 42 In Portugal there are trademark registrations of “champagnes” from Bombarral (a town located in the middle West of Portugal) and from Bairrada (a region south of Porto), “Champagne de água-pé” (a sparkling wine of low alcohol content that is prepared by pouring water on the grape pomace, after squeezing), “Champagne de piquette,” and “Champagne de mistura” (“mixed champagne”). Similar cases in Brazil include “Cognac de Adrião,” “Cognac de carvão” (“cognac” made of coal), “Superior Ginebra,” “Champagne fino—produzido no Brazil” (“fine champagne produced in Brazil”), “Malaga from Brazil,” “Porto Brazileiro” (Brazilian port), “Vinho de Collares produced in Rio,” “Château Rauzan” from Rio de Janeiro, and “Alto Minho—Vinho Verde” produced in Rio de Janeiro, among others. The British retailer Gilbey's was one of the first to import “sherry” from South Africa. Australians also produced imitation sherry, as did Germans from Hamburg who produced cheap sherry from cheap industrial alcohol (which was made from sugar beets or potatoes) that did not possess the preserving powers required for shipment and consumption.Footnote 43 These imitators were blamed by farmers and wine producers both for creating a commercial crisis and for generating a lack of trust among consumers.Footnote 44
Despite the implementation of international legislation on intellectual property aimed at protecting geographic appellations through the Paris Convention in 1883, it was not very effective in practice.Footnote 45 Old World producers such as France, Spain, and Portugal fought to try to enforce the legislation. Following the Rome Convention in 1886, the Madrid Agreement of 1891 for the Repression of False Deceptive Indications of Source on Goods was an important development toward repressing adulterations and false denominations of origin. However, its effectiveness was limited given that only eight countries signed the agreement: Brazil, France, Guatemala, Portugal, Great Britain, Spain, Switzerland, and Tunisia.Footnote 46
Impact of Imitation and Adulteration
Imitation and adulteration can have a variety of other impacts, economically, institutionally, and politically, as well as socially and culturally. At particular moments in time these impacts were very different in Old World producing countries, Old World importing countries, and New World importing and producing countries. In some cases, the effects were negative for some or all of the stakeholders involved; in others, imitation and adulteration had a positive impact on the survival of both existing and new firms and also in the development of new industries.
Economic impact
The economic impact of imitation and adulteration in wines is visible at country and firm level. In countries where the production and trade of alcoholic beverages was an important component of the economy, it is particularly visible. As illustrated previously, the Old World experienced a sharp decline in international trade, while the New World saw a rapid development of local industries around the time of the first globalization wave (see Figure 1, and Appendix figures). In the case of Portugal, for instance, where wine had been a major source of exports throughout the second half of the nineteenth century (at certain periods representing about 52 percent of Portuguese exports), international trade decreased consistently from the 1860s until World War I.Footnote 47 At the firm level, imitations often led innovators to develop marketing and technological innovations, for example, through the creation of unique shapes for their labels or bottles. Often, firms also formed alliances with competitors or agents in the same value chain or integrated vertically, either forward into retailing, or backward into production, or both.
Several New World regions, such as North and South America and Australia, first developed wine industries almost exclusively by imitating the production technologies and the denominations of origin of wines from Europe's most reputable producing regions, such as Porto, Madeira, and Jerez.Footnote 48 Similarly, New World winemaking was developed via the importation of technicians, technologies, and vine varieties from the Old World. It was a process of industrialization via import substitution, which in most cases was backed by the state and supported by technological change.Footnote 49
In the New World, immigrants formed a substantial part of the population, creating entrepreneurial opportunities that appealed to acquired habits of consumption and nostalgia. The place of origin was perceived as an important factor and foreign brands had additional symbolic value that provoked a preference over local brands.Footnote 50
One strategy that innovators used to deal with imitators and prevent further similar cases was to advertise the successful results of their litigations. Through these means, the innovators not only showed the public how committed they were to selling genuine beverages of trusted quality but also implicitly informed potential imitators that they risked facing prosecution. In 1892, for instance, Fratelli Branca, an Italian producer of liqueur operating in Argentina, published a note in eight national, regional, and local newspapers to inform the public that the company had no connection with an Argentinean producer of imitations who was trying to associate himself with the original brand through the widow of Luigi Branca.Footnote 51
Imitations and adulterations were also responsible for the development of certain technological innovations in other industries during the first wave of globalization. An important illustration relates to developments in the chemistry industry. The addition of chemicals to alcoholic beverages facilitated the development of new and more refined production processes and enabled large-scale production of imitations and adulterations at lower costs. Imitations of beverages therefore became more sophisticated and harder to detect.Footnote 52
Alliances with competitors were another alternative strategy that innovator firms used to deal with imitators. An illustration is the joint legal action taken in Argentina, between 1913 and 1917, by four companies: Otard Dupuy y Cía. (France), Fratelli Branca (Italy), Cinzano (Italy), and José Deu y Cía. (Spain and Argentina). They targeted a large group of retail traders located in small towns far from the city of Buenos Aires who were selling imitations of the companies’ own beverages. These companies sought litigation not only against their competitors (manufacturers of fake liqueurs and vermouth) but also against small retailers in rural villages, whom they accused of being accomplices by selling the imitated and counterfeited goods.Footnote 53
Innovator firms also used forward and backward integration as strategies to prevent and mitigate imitation of their beverages. From the mid-1870s, the crisis in the global wine industry made it very difficult for large wine retailers such as Gilbey's to control the quality of the wines they were selling. Traditionally, Gilbey's depended on leading shippers in Jerez and Porto to select the wines that would be sold under the Gilbey's brand. However, the uncertainties associated with Phylloxera and the spread of imitations and adulterations led the company to integrate backward and purchase Château Loudenne in the Médoc region in 1875. This investment reduced the information costs associated with the firm's searches to buy suitable wines from local growers and also cut operating costs.Footnote 54 Other wine merchants followed, creating a trend that eventually led to a change in the relations between the different agents in the value chain. In Great Britain, for example, most of the large brewers integrated vertically into distribution through the purchase of retail outlets, mainly public houses.Footnote 55
In some cases, vertical integration meant investing in foreign markets through the establishment of commercial branches and/or the appointment of exclusive agents or even the setting up of industrial facilities. In Argentina, firms such as Cinzano and Martini & Rossi followed their consumers who had immigrated around the turn of the century by setting up distribution operations in that market. Exports through third parties were threatening their reputation, as imitators often tried to sell their own beverages as if they were genuine.Footnote 56
Institutional and political impact
During the first wave of globalization, a great proliferation of imitations were produced and traded by entrepreneurs who took advantage of loopholes in the law and the increasing demand for wines and other alcoholic beverages. This phenomenon created incentives for legislators to create and change laws in various countries. In Portugal, the first debates about the creation of a “trademark law” in the 1860s were associated with the abolition of the demarcated region of Douro, where the grapes used for port wine grow. The protection that had been in place in the industry since 1756 through the demarcation of the Douro wine-producing region, and other protective measures intended to control the quality of that wine, was abolished in 1865.Footnote 57 The government introduced a proposed law to parliament in 1860 noting that in other countries, like France, trademark law guaranteed the purity and origin of sherry, Bordeaux wines, and champagne and that such legislation was a new form of protection against imitation and adulteration that, if applied to the case of Portugal, could be very effective in maintaining the reputation of quality of the wines from the Douro region.Footnote 58 Although the free market had been the dominant regime since 1865, the project of creating a trademark law as an alternative was not taken forward. It took almost two decades for a trademark law protecting manufactured and traded goods to be approved. This law was published on June 4, 1883, and became law on October 23 of the same year.Footnote 59 It allowed wine producers to register trademarks, to protect their wines from imitation, and to stop the undue use of denominations of origin by third parties.Footnote 60
Between 1883 and 1900, 23 percent of total trademark registrations in Portugal were in alcoholic beverages. Port wine trademarks, in particular, made up 73 percent of such registrations. As the registration of trademarks was a voluntary act, many port wine producers—among which were the largest exporters of port wine, such as Sandeman, Offley, Cramp & Forresters, and Dona Antónia Adelaide Ferreira/Companhia Agrícola e Comercial dos Vinhos do Porto—did not register any trademarks for port wine in the first years of registration. They considered that trademark legislation was not effective in preventing imitation and adulteration of wines or undue usage of denominations of origin, even after Portugal joined the Madrid Convention.Footnote 61 From 1907, new legislation was put in place to regulate the production and trade of port wine; however, despite the fact that the production of imitations was substantially reduced, it did not disappear completely.
In a similar vein, Argentina passed a trademark law in 1876.Footnote 62 Debates around imitation and counterfeiting in consumer goods, including alcoholic beverages, were also central to the creation of this law.Footnote 63 But, as in Portugal, this law was not completely effective in eliminating imitations. In 1923, concerns regarding the excessive use of European denominations of origin for Argentinean wines (among other consumer goods) was behind the passing of the Merchandise Identification Law.Footnote 64 This bill made it obligatory that all articles manufactured in Argentina bore the mark “Industria Argentina” (Argentine industry).Footnote 65
The spread of imitations promoted the need for active surveillance of brands and the protection of intellectual property.Footnote 66 Eventually, this led to an increase in litigation, the creation of trademark laws, as well as a new profession: lawyers specializing in trademark law. In Argentina two of the most important intellectual property rights law firms, Obligado & Co. and G. Breuer, were formed around the time when trademark law was enacted. Both firms gained first-mover advantages and became leaders in the industry.Footnote 67 They handled about one-third of all Argentine trademark registrations until the 1930s. The most important court cases involving alcoholic beverages included foreign firms or importers, including Otard Dupuy y Cía, Fratelli Branca, Cinzano y Cía, José Deu y Cía., J. H. Secrestat, A Delor y Cía., Moore y Tudor Cía, Martell y Cía., Societe les fils de P. Bardinet, and Luis Dufaur.Footnote 68 The main aim of these companies was to prevent and mitigate the risks associated with imitations by other merchants and local producers. Imitations were considered to affect the reputation of the innovators' brands negatively and to mislead consumers to think the imitations were authentic.Footnote 69 Moreover, because the law in Argentina relied on the attributive system (which enabled local entrepreneurs to appropriate the intellectual property of successful foreign brands and local brands, simply by being the first to register the trademarks locally, irrespective of any proof of use), it was difficult for innovators not only to protect their own intellectual property but also to enter and operate in those markets.
In Brazil, the industry that generated the most litigation during the period from 1875 to 1914 was alcoholic beverages, even though it represented only 11.8 percent of trademark registrations filed during the period of analysis.Footnote 70 An analysis of court cases and of newspaper articles and advertisements published shows that most of the litigations involved at least one foreign party, which was usually the complainant (through a prosecutor attorney). The most common reason for litigation was the false use of regions or denominations of origin (17.8 percent), followed by cases where the name of the firm or its brand was at stake (15.3 percent) or the name of the family behind the firm (9.8 percent). The majority of cases were associated with situations of pure counterfeiting of collective trademarks, commercial trademarks, or both. One significant case took place between A. Monteiro de Castro Portugal and Adriano Ramos Pinto.Footnote 71 These were two Portuguese port wine producers that had started exporting to Brazil in 1890. The former sued the latter for using the trademark “Adriano” in Brazil. The instant success and popularity of the brand made the word “Adriano” synonymous with port in that market, just like the words Xerox and Kleenex became synonymous with photocopying and tissues in the United States. The issue was that, although neither of the companies had registered the trademark in Brazil, in Portugal A. Monteiro de Castro Portugal had been the first to register the trademark, in 1893, while the firm Adriano Ramos Pinto had done so only in 1895. However, in Brazil, A. Monteiro de Castro Portugal registered three different trademarks, which appear to be imitations of Adriano Ramos Pinto & Irmão brands, indicating that the former business was trying to take advantage of the reputation already achieved by the latter with its brands in Brazil.Footnote 72 Ultimately, Adriano Ramos Pinto & Irmão sales of “Adriano” decreased in Brazil—not because of the Brazilian court's decision but specifically because the firm refused to lower its prices to compete with those of imitators.Footnote 73
Social and cultural impact
Imitation and adulteration of alcoholic beverages had a significant impact on the dissemination of new drinking preferences, by making new types of beverages accessible to less advantaged social classes, who would not have been able to drink the genuine wines. However, it also led some less informed consumers to buy beverages that were mislabeled and thus intended to deceive them.Footnote 74 The commercial success of individual brands like Château Lafite, or collective brands such as sauterne or port, encouraged producers from other regions and countries to label their own wines in such a way that they could appropriate the gains associated with such reputed names. While in some markets it was possible for companies to protect their private labels in court, in most markets this was not an option which was particularly important for reputable types of wine from esteemed regions. The result was that even very strong private labels, such as Moët & Chandon champagne and Gonzalez Byass sherry, saw their sales threatened by a decline in the collective reputation of the regions where they were based. In these cases, consumers often reduced their consumption of wines or switched to other beverages.
A very important social impact of wine imitation and adulteration was related to public health. As previously highlighted, artificial or adulterated wines were manufactured using substances other than just grapes—substances that could be quite harmful to human health, for example, fuchsin (used to color and impart brightness to the wine) and salicylic acid (used as a preservative).Footnote 75 The use of these substances harmful to health in the production of adulterated alcoholic beverages led governments to take action, not so much to repress producers or traders of such imitations and adulterations but to deal with the harmful effects on health that such imitations could produce. As a result, several countries created chemical and hygiene laboratories to identify and analyze alcoholic beverages for imitation and adulteration.Footnote 76 In France, for instance, the Municipal Laboratory in Paris tested 617 wine samples in 1905 and found that 500 had been adulterated.Footnote 77 In markets such as Great Britain, where a Food and Drugs Act had been implemented in 1875 to control risks to consumers’ health associated with adulteration, legislation proved to be insufficient to control the presence of potentially harmful ingredients in the trade of food and drinks.Footnote 78 Some companies mobilized health benefits and the purity of their products as part of their strategies of differentiation in the eyes of consumers. Victoria Wine, for example, which bottled its own wines, highlighted in its advertisements in Great Britain the fact that its products were “unadulterated.”Footnote 79
Conclusion
This article analyzes the changing and flexible nature of the phenomenon of imitation and adulteration of wines over time. It also illustrates the institutional innovations brought about by the waves of adulteration and imitation in different wine-producing regions around the world. Imitation and adulteration were particularly important entrepreneurial initiatives in the late nineteenth-century and early twentieth-century alcoholic beverages industry, when regulation and institutions were relatively weak.Footnote 80 They impacted on different levels of society in important ways.
The first wave of globalization is considered to be a period of unprecedented growth in world trade. However, globalization did not affect all industries in the same way. In the case of the wine industry, that international trade trend was reversed. Vineyards in the main wine-producing regions in Europe were devastated by various diseases in the 1860s. This led to the spread of imitation and adulteration within the industry, involving different agents within the global value chain, from genuine and fraudulent producers to distributors and retailers. Consumers lost trust in the beverages available on the market, leading to a decrease in the consumption of wines. At the same time, in the New World, imitations of Old World wines proliferated, often bolstered by the imitators’ false claims of reputable denominations of origin. Consumption of wines was rising very quickly, in part because of the increasing supply of imitation beverages at cheaper prices, but mainly because of the growing number of European immigrants and expatriates from southern European countries. Local governments created tariffs and other protective barriers for imports and provided subsidies to help entrepreneurs develop domestic businesses. By 1910, in countries such as Argentina and Chile, they even promoted the use of Old World denominations of origin such as Jerez, Porto, Marsala, and cognac as mere generic products.Footnote 81
The impacts of imitation and adulterations were multiple: economic, institutional, political, social, and cultural. In some countries the economic impact is clearly visible through creation of new wine industries, particularly in the New World, which resulted in a decrease of wine imports from the Old World. New institutions and laws also developed as a result, helping to protect the property rights of innovators. At the firm level it is possible to identify both positive and negative impacts as well. Innovators were forced to develop new technologies and marketing strategies to combat imitations and adulterations; many were forced to change their boundaries and others went out of business. Some firms formed alliances with competitors, while others integrated forward into distribution, backward into production, or both.
Imitation led to a decrease in the consumption of some beverages in some traditional markets, yet it also increased consumption and disseminated new habits of alcohol consumption in terms of certain categories of wines, especially among consumers with lower income levels in different parts of the world; people who would not have been able to afford certain authentic wines could at least purchase imitations and adulterated wines. Finally, adulterations also had potentially harmful effects on health as they frequently contained poisonous substances. As with imitations of other consumer goods from different industries, adulteration and imitation of wines during the late nineteenth and early twentieth centuries did not originate in countries, like China, that are now believed to be the great producers of imitations in the world. Instead, during the first wave of globalization, imitations of wines predominantly originated in countries that in the twentieth century would become leading wine producers, such as Argentina and the United States. This indicates that imitation can eventually have positive long-term effects in the development of industries and the upgrading of regional or national economies.Footnote 82
Appendix
Wine exports from Spain, Italy, and France. Amounts are given in hectoliters. (Source: Vicente Pinilla, “Wine Historical Statistics: A Quantitative Approach to Its Consumption, Production and Trade, 1840–1938,” [working paper no. 1409, 2014, 12–13, Documentos de Trabajo de la Sociedad Española de Historia Agraria], https://ideas.repec.org/p/seh/wpaper/1409.html.)

Index of consumption of alcoholic beverages in the United Kingdom, 1895–1909. (Source: U.K. Board of Trade, Alcoholic Beverages: Twentieth Century House of Commons Sessional Papers 44 [1911], part II, table v, United Kingdom 29–36.)

Argentine production and imports of wines, 1899–1914 (in hectoliters). (Source: Patricia Barrio de Villanueva, “Controles Estatales a la Industria del Vino en Mendoza, 1890–1914,” H-industri@: Revista de Historia de la Industria, los Servicios y las Empresas en América Latina 7, no. 4 [2013]: 1–16.)