Nomenclature
- y+
-
dimensionless wall distance [-]
- SW
-
solid wall casing [-]
- SRC
-
self-recirculating casing treatment [-]
- Exp
-
experimental value [-]
- Cal
-
calculated value [-]
-
 $\delta$
-
absolute airflow angle
- v z
-
axial component of the absolute velocity of the airflow
- v t
-
tangential component of the absolute velocity of the airflow
- SMI
-
amount of stall margin improvement [-]
- PEI
-
amount of peak efficiency improvement [-]
-
${\pi ^*}$
-
total pressure ratio [-]
- m
-
converted flow rate [kg/s]
-
$\eta _p^*$
-
peak efficiency [-]
- CT
-
casing treatment [-]
- S
-
point of near-stall condition [-]
- C
-
circumferential coverage ratio [-]
-
$\alpha$
-
injection angle [°]
- W in
-
axial length of the injection port [Ca]
- n
-
bridge path radial width [Ca]
- y
-
radial height between the bottom of the bridge and the casing line [Ca]
- L
-
axial distance between the leading edge of the bleeding port and the leading edge of the blade tip [Ca]
- W bl
-
axial length of the bleeding port port [Ca]
-
$\beta$
-
bleeding port angle [°]
- Ca
-
axial chordal length of the tip of the rotor [-]
- m1
-
solid wall casing at the near-stall mass flow point [-]
- m2
-
CT0.4C near-stall mass flow point [-]
-
${w_t}$
-
tangential component of the relative velocity of the airflow [m/s]
-
${w_z}$
-
axial component of the relative velocity of the airflow [m/s]
-
$\theta$
-
relative airflow angle [°]
- B a
-
global blockage ratio [-]
- z
-
number of sections [-]
-
${A_b}$
-
area occupied by the axial component of relative velocity less than 0 within the section [mm2]
-
${A_f}$
-
area of the section at different axial positions [mm2]
- T
-
physical moment [-]
- H n
-
parameter of dimensionless helicity [-]
-
$\overrightarrow W $
-
relative velocity vector [m/s]
-
$\overrightarrow \xi $
-
vortex vector [rad/s]
- TE
-
trailing edge [-]
- LE
-
leading edge [-]
- MR
-
momentum ratio [-]
-
${M_t}$
-
momentum of the leakage flow perpendicular to the chordal direction of the blade tip [kg·m/s]
${M_z}$
axial momentum of the main flow above 90% of the blade span [m/s] -
$\rho $
-
density of the local airflow [kg/s3]
-
${W_t}$
-
tangential component of the relative velocity [m/s]
-
${W_z}$
-
axial component of the relative velocity [m/s]
-
$\varphi $
-
mounting angle of the blade tip [°]


1.0 Introdution
As the main component of the engine, the compressor loading performance has a considerable impact on the engine performance. With the performance of the compressor stage continues to improve, the thrust-to-weight ratio of the aero-engine continues to increase. However, as the single-stage compressor work capacity increases, the adverse pressure gradient inside the compressor is enhanced, leading to an increase in the intensity of the leakage flow in the tip clearance and the separation degree of the annular wall boundary layer, which makes the compressor stable operating margin smaller. In severe cases, it will lead to the occurrence of the unstable operation of the compressor, such as the occurrence of the stall phenomenon.
At present, the methods to improve the stable operating range of compressors mainly include two methods of active control and passive control. Passive control methods include blade leading edge design [Reference Zhang, Feng, Dong, Xiao and Chu1, Reference Zhang, Yang, Dong, Feng, Wang and Chu2] and casing treatment, among others. Casing treatment is as a passive control method, includes groove casing treatment [Reference Liu, Chu, Zhang and Wang3], slot casing treatment [Reference Zhang, Liu, Wang, Chu, Yang and Zhao4–Reference Zhang, Zhong, Wang, Zhang and Chu6] and self-recirculating casing treatment [Reference Zhang, Dong, Wang, Chu and Yan7, Reference Zhang, Jing, Li, Wang and Chu8]. The results of a large number of experimental and numerical studies by the previous researchers show that the stability enhancement margin of circumferential groove casing treatment is relatively small, but the impact of this method on the compressor efficiency is small. The slot casing has a relatively large stability enhancement margin, but this method also has a large impact on the compressor efficiency [Reference Matzgeller, Voges and Schroll9, Reference Dinh, Heo and Kim10]. On the other hand, the self-recirculating casing treatment is able to increase the operating range of the compressor to a greater extent with less impacts on the compressor efficiency [Reference Khaleghi, Dehkordi and Tousi11, Reference Taghavi-Zenouz and Behbahani12]. This effect has attracted researchers to explore the stability enhancement potential of the self-recirculating casing treatment in depth.
Hathaway et al. [Reference Hathaway13] conducted numerical simulations on NASA Rotor67, analysing the effects of different bleed and injection positions in the self-recirculating casing on compressor performance. The results demonstrated that the self-recirculating casing effectively enhances compressor stability margin. Strazisar et al. [Reference Strazisar, Bright, Thorp, Culley and Suder14] used self-recirculating casing treatment at NASA Stage35 by means of experiments and numerical simulations. The results show that the self-recirculating casing treatment ensures the stable operation of the compressor mainly by improving the stage-to-stage matching of the compressor. In particular, the stall margin of the compressor is improved by 6% at 70% of the design speed.
Khaleghi et al. [Reference Khaleghi, Tousi, Boroomand and Teixeira15] applied the same casing treatment to Rotor67, installing a counter-swirl vane at the injection port to eliminate the swirling component in the recirculated flow. Their study revealed that although the recirculated flow accounted for only approximately 1% of the compressor’s total flow, it improved the stall margin by nearly 10%. Li et al. [Reference Li, Liu, Zhang, Dong, Lin and Nie16] conducted experimental studies on an axial compressor. Their findings revealed that certain self-recirculating casing configurations achieved a maximum stability enhancement of 2.88% in stall margin. They further concluded that the self-recirculating casing effectively reduced unsteady fluctuations in the tip leakage vortex and improved flow stability by altering the vortex trajectory.
Grosvenor et al. [Reference Grosvenor, Rixon, Sailer, Matheson, Gutzwiller and Demeulenaere17] numerically investigated NASA Stage67 to elucidate the effects of self-recirculating casing treatment on compressor stage performance through jet injection. Their research demonstrated that the self-recirculating casing can effectively delay compressor stall by displacing the tip leakage vortex downstream via controlled jet injection.
Guinet et al. [Reference Guinet, Inzenhofer and Gümmer18] conducted research on a 1.5-stage axial flow compressor, examining the stability enhancement effects of self-recirculating casing treatment with varying tip clearances. Their results indicate that the stability enhancement capability of the self-recirculating casing improves with increasing tip clearance. However, reduced tip clearance was found to adversely affect compressor stability, sometimes even causing premature stall initiation with the casing treatment. In a subsequent study on the same compressor, Guinet et al. [Reference Guinet, Streit, Kau and Gümmer19] systematically analysed the influence of nozzle height, incident yaw angle and axial positioning on compressor internal flow. Their findings revealed that the self-recirculating casing has minimal impact on compressor efficiency due to the relatively low recirculation flow rate.
Shi et al. [Reference Shi, Han, Zhong and Chen20] investigated NASA Stage 37 with self-recirculating casing treatment and concluded that this approach suppresses the breakdown of tip leakage vortices within the blade passage, thereby improving flow stability. Yan et al. [Reference Yan, Chu, Zhang and Liu21, Reference Yan and Chu22] also carried out numerical calculations on Rotor 37 to study the influence of different bleeding positions and nozzle throat heights on the stability enhancement effect of self-recirculating casing treatment. After studying, they found that the stability enhancement effect of the self-recirculating casing treatment with the bleeding position in the rotor blocking region is better than that of the bleeding position after the rotor.
Kumar et al. [Reference Kumar, Chotalia, Jana, Ganguli and Siddanagouda23] carried out numerical studies on the transonic axial compressor stage. They found that the expansion compressor ability effect of the self-recirculating casing is the best when the yaw angle is set to 47 degrees at 100% rotation speed. Furthermore, Kumar et al. [Reference Kumar, Dilipkumar, Shobhavathy, Janaki, Kumar, Jana and Ganguli24] argued that at any rotation speed below 65%, the amount of stall margin improvement obtained by the self-recirculating casing with 0 jet yaw angle is maximised, and the pressure ratio is also improved to a certain extent.
Wang et al. [Reference Wang, Chu, Zhang, Chen and Chi25] investigated self-recirculating casing designs with varying axial deflection angles in an axial compressor. Their results demonstrated that when the self-recirculating structure was aligned parallel to the blade tip chord, the injected flow from the casing nozzle coincided with the primary compressor flow direction, thereby minimising the adverse impact on compressor efficiency.
Koley et al. [Reference Koley, Chen, Saraswat and Katz26] experimentally investigated multiple casing configurations on a 1.5-stage axial compressor. Among these, the S-type casing treatment preserved the compressor peak efficiency while achieving a 36% improvement in stall margin.
Zhang et al. [Reference Zhang, Wang, Xiao, Feng and Chu27] took Stage 35 as the research object and set the bleeding ports of the self-circulating casing on the stator blades. This method not only alleviates the tip blockage of the compressor rotor blades but also suppresses the flow separation in the stator vane passage.
Guo et al. [Reference Guo, Liu, Wang, Gao, Mao and Li28] introduced a self-circulation casing treatment for a counter-rotating axial-flow compressor as the research object. The results showed that adopting the self-circulation casing treatment near the tip of the rotor could effectively enhance stall margin of the compressor, and the injection position had a significant impact on the potential for stability improvement.
It can be found from the above that a large number of research on the self-recirculating casing treatment have been carried out. They mainly involve the analysis of casing about improving the stability of compressors, the flow analysis about improving the internal flow field of compressors and the research on parameters such as different bleeding positions and axial deflection angles of the self-recirculating casing treatment. However, so far, most of the studies accomplished from other aspects have set specific values of circumferential coverage ratio. There are few systematic studies on the circumferential coverage ratio. Therefore, it is of great practical value to study the treatment of self-recirculating casing with different circumferential coverage ratios to the enhancement of compressor stability.
This paper investigated the influence of different circumferential coverage ratios on the stability enhancement effect of self-recirculating casing treatment. It is expected to reveal the flow mechanism of the influence of different circumferential coverage ratios of the self-recirculating casing treatment on the stability of axial flow compressor.
2.0 Study objects and numerical methods
2.1 Research object
The simulation calculation of the self-recirculating casing was conducted on the subsonic rotor of a compressor in Northwestern Polytechnical University. Lu et al. [Reference Lu, Chu, Zhu and Zhu29] introduced in detail a compressor rotor with 30 blades with a design mass flow rate of 5.6 kg/s, a total pressure ratio of 1.249, and an isentropic efficiency of 0.905 at a design speed of 15200 r/min. Zhang et al. [Reference Zhang, Tan, Wu, Chu, Wang and An30] show other design parameters of the rotor.
2.2 Numerical methods
In this paper, AutoGrid5 and IGG modules in NUMECA software package were used to complete the grid. Figure 1 gives the numerical model and grid computing topology diagram. The HOH-type grid topology is used for the rotor passage of the compressor. The tip clearance adopts the butterfly grid topology. The inlet and outlet passages adopts the H-type grid topology. And it ensures that the dimensionless distance y+ value of the first layer of wall grid is less than 10. Table 1 shows the specific grid parameters.
Diagram of the numerical model and computational grid topology: (a) schematic structure of single passage numerical modeling, (b) topology of rotor passage grid, and (c) mesh topology of meridian surface.

In this paper, the study was carried out at 70.8% of the design speed (10,765 rpm) of the research object of this paper. Turbulence model is selected from the k-epsilon turbulence model. A single passage unsteady numerical simulation was conducted by using Fine-Turbo module of NUMECA software. The Symmetric TVD of the second order upwind scheme is selected for the spatial discretisation of the governing equations. The time advancement method for the unsteady computation is selected in the dual time stepping. According to the previous numerical experience [Reference Zhang, Liu, Wang and Chu31, Reference Zhang, Zhang, Wu, Chu and Kuang32], the object of this study has carried out two kinds of physical time-step check of 20 and 30. The results show that it can meet the calculation requirements when the physical time step is 20, so the physical time step of single passage is set to 20, and the virtual time step is set to 20. The inlet extension of the numerical model is set to the static domain (the rotation speed is 0 rpm), and the other regions are set to the rotating domain (the rotation speed is 10765 rpm). The Mixing plane method is used for the data transfer of the rotational/static interfaces in steady computation, and the domain scaling method is used for the data transfer of the rotational/static interfaces in unsteady computation.
Both the casing wall and blade surface meet the condition of adiabatic no-slip. The inlet boundary condition is set as radial inlet as the same as the experiment. The absolute total pressure at the inlet boundary is set to 101,325 Pa, and the absolute total temperature is set to 288.2 K. The average static pressure at the outlet is selected for the setting of the outlet boundary, and the calculation results of each working condition are obtained by changing the outlet back pressure. The standard of calculation of convergence is that the parameters, such as the inlet and outlet flow, remain fixed or change periodically with time. The previous working condition where the numerical calculation diverges is near-stall condition, and the difference of outlet back pressure between near-stall condition and instability condition is 50 Pa.
2.3 Numerical validation
The result of preliminary numerical study [Reference Zhang, Zhang, Wu and Su33] shows that, when the total number of single passage grids is more than 650,000, the numerical calculations have met the requirements of grid independence. In this paper, the number of single passage grids used is more than 1,000,000, so there is no need to carry out grid independence verification.
Numerical calculation grid specific configurations

Literature [Reference Zhang, Wang, Liu and Chu34] has carried out three kinds of turbulence model verification for the research object in this paper. The results show that the calculation results of k-epsilon turbulence model are in good agreement with the experimental results, so k-e turbulence model is selected to carry out numerical simulations in this paper.
To ensure the accuracy of the numerical simulation, the self-recirculating casing used in this paper is tested, and the experimental results are compared with the numerical simulation results. Figure 2 shows the actual diagram of the self-recirculating casing experimental article.
Physical diagram of the self-recirculating casing experimental parts.

Figure 3 shows the total performance curves of the experimentally measured results as well as numerically simulated results of the solid wall and self-recirculating casing compressors at 70.8% design speed. Where SW represents the solid wall casing, SRC represents the self-recirculating casing treatment, Exp and Cal represent the experimental and calculated values, respectively. It can be seen from the figure that the unsteady calculation results are in good agreement with the experimental results, and the error of the total pressure ratio of the two is within ±0.003. For isentropic efficiency, the error between the calculated value and the experimental value is less than 1%. The relative error between the near-stall flow of the numerical simulation results and the experimental near-stall flow is also less than 1%. When the flow rate of the two is the same, isentropic efficiency of the solid wall casing is higher than the isentropic efficiency of the self-recirculating casing treatment. Although there are small errors between the calculated results and the experimental, these errors are within the acceptable range of the project.
Experimental and calculated total performance curves for solid wall and self-recirculating casing compressors, (a) total pressure ratio and (b) isentropic efficiency.

Distribution of rotor absolute total pressure ratio and outlet absolute flow angle along the blade span, (a) absolute total pressure ratio and (b) outlet absolute flow angle.

Figure 4 shows the distribution of the rotor total pressure ratio and the absolute flow angle at the outlet along the blade height of the calculated and experimental results near the peak efficiency. The formula for the absolute airflow angle
 $\delta $
is given by Equation (1). Where vz represents the axial component of the absolute velocity of the airflow, vt represents the tangential component of the absolute velocity of the airflow. The axial distance from the inlet to the tip edge of the rotor blade is 0.43 Ca. The axial distance from the outlet to the tip edge of the rotor blade is 0.5 Ca. Ca is used to represent the axial chord length of the tip of the rotor, and all length parameters are dimensionless by Ca. It can be seen from Fig. 4(a) that the calculated results of the rotor total pressure ratio are consistent with the experimental results in the variation trend of blade height, and both of them show the same distribution law. There is a certain error only in the area of the 80% blade span, but it is still within the acceptable range of error. From Fig. 4(b), it can be seen that the calculated and experimental results of the outlet flow angle are in good agreement with each other at each blade span, and the two results are very close in value. In general, the calculated results have been able to predict the primitive performance of the compressor relatively accurately.
 \begin{align} \delta = \arctan \left( {\frac{{{v_z}}}{{{v_t}}}} \right) * \frac{{180}}{\pi } \end{align}
To visualise the degree of conformity between the calculated and experimental results of the self-recirculating casing treatment (SRC), the quantitative indexes of the stability enhancement capability of this self-recirculating casing treatment are quantitatively given in Table 2, in which SMI represents the amount of stall margin improvement, and PEI represents the amount of peak efficiency improvement. The definition formula of the amount of stall margin improvement is as follows:
 \begin{align} {\rm{SMI}} = \left[ {{{\left( {\frac{{\pi _{CT}^*}}{{{m_{CT}}}}} \right)}_S} - {{\left( {\frac{{\pi _{SW}^{\ast}}}{{{m_{SW}}}}} \right)}_S}} \right]/{\left( {\frac{{\pi _{SW}^{\ast}}}{{{m_{SW}}}}} \right)_S} \times 100\% \end{align}
SMI and PEI of calculated (time-averaged results) and experimental values for the self-recirculating casing treatment

The definition formula of the amount of peak efficiency improvement is as follows:
 \begin{align} {\rm{PEI}} = \left[ {\frac{{{{\left( {\eta _p^*} \right)}_{ct}}}}{{{{\left( {\eta _p^{\ast}} \right)}_{sw}}}} - 1} \right] \times 100\% \end{align}
Where
 ${\pi ^*}$
represents the total pressure ratio,
 $m$
represents the converted flow rate,
 $\eta _p^*$
represents the peak efficiency, the angular scales SW and CT represent the solid wall casing and the compressor rotor with casing treatment, respectively. The angular scale S represents the point of near-stall condition. It can be seen that the numerical results of this self-recirculating casing treatment are relatively similar to the experimental results. The calculated stall margin improvement and peak efficiency improvement are relatively consistent with the experimental results, with only minor errors. The trends of the two quantitative indexes obtained from the calculation results are consistent with the experiments.
In general, the numerical simulation methods used in this paper have good reliability. Although there is a certain error between the calculation results and the experimental data, which may be due to the following reasons: the geometry of the rotor blade and the tip clearance shape in the numerical model and the actual rotor blade geometry and the tip clearance shape there are differences. For example, the rotor tip clearance changes along the circumferential direction during the experimental process, while the size of the rotor tip clearance does not change with the circumferential direction in the numerical model. In addition, the turbulence model used in the numerical calculations can not accurately predict certain complex flows in the flow field, and there is a measurement error during the experimental process, and so on. However, from the above validation results, it can be seen that the calculated and experimental results of the total performance and primitive performance of the compressor are in good agreement. It indicates that the numerical computation method adopted in this paper can ensure the credibility of the calculated results and the corresponding flow mechanism to a large extent.
3.0 Presentation and design of the reseach programme
This paper mainly studies the influence of the design parameter of circumferential coverage ratio on the stability enhancement effect of the self-recirculating casing treatment and the performance of the compressor. Three self-recirculating casing structures with different circumferential coverage ratios of 20%, 40% and 60% are designed and named CT0.2C, CT0.4C and CT0.6C, where CT represents the casing treatment, C represents the circumferential coverage ratio. Where the circumferential coverage ratio is defined as the ratio of the total circumferential angle of the self-recirculating casing structure covering the casing face to the circumferential angle (360°), e.g. 40% circumferential coverage ratio is defined as 4.8° (circumferential angle of each self-recirculating casing device) ×30 (total number of self-recirculating casing devices) /360°.
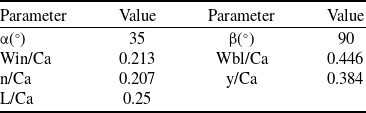
The structural diagram of the self-recirculating casing is shown in Fig. 5. Where α is the jet angle, Win is the axial length of the injection port, n is the bridge path radial width, y is the radial height between the bottom of the bridge and the line of the casing, L is the axial distance between the leading edge of the bleeding port and the leading edge of the blade tip, Wbl is the axial length of the bleeding port port, and
 $\beta$
is the bleeding port angle, and Table 3 shows the specific value of each of its basic parameter. The self-recirculating casing is always equally distributed 30 in 360° circumferential direction, i.e. each blade passage corresponds to a self-recirculating casing structure. In this paper, Ca is used to represent the axial chord length of the tip of the rotor, and all length parameters are dimensionless by Ca.
Schematic diagram of the self-recirculating casing structure.

Figure 6 gives a three-dimensional schematic of the self-recirculating casing processing structure and a locally enlarged grid schematic of the self-recirculating casing with a radial tilt angle of 0° as an example. As shown in the figure, the self-recirculating casing device is divided into the bleeding section, the bridge section and the jet section to ensure the orthogonality of the grid, as shown in the blue, green and red areas respectively in the figure. The topology of these three parts is drawn using H-mesh, and the mesh is encrypted at the solid wall, with the number of points in the circumferential and radial directions of the three mesh blocks being 41 and 21, respectively. The number of grid nodes in the flow direction is 33, 25 and 33 for the bleeding section, the bridge section and the injection section, respectively.
Figure 7 presents the three-dimensional schematic diagrams of the self-recirculating casing schemes with three different circumferential coverage ratios studied in this paper. Considering the variation of the circumferential dimension of the self-recirculating casing structure, the number of grid points in the circumferential coverage ratios of 20%, 40% and 60% in the circumferential direction are set to 21, 41 and 61, respectively. The rest of the grid setups and the computational setups are kept in line with the grid setups and computational setups above.
4.0 Results and discussion
4.1 Comparative analysis of total performance
Figures 8 give the performance curves of several compressors with different casing configurations, with the horizontal coordinate indicating the outlet converted the flow rate of the compressor and SW representing the solid wall casing in the figure. In general, the stable operating range of the compressor with a self-recirculating casing structure is significantly larger than that of the solid wall casing compressor.
Basic design values for the self-recirculating casing treatment

Three-dimensional schematic of the self-recirculating casing.

Three-dimensional structure. (a) CT0.2C, (b) CT0.4C and (c) CT0.6C.

Plot of total compressor performance for different casing (time-averaged results): (a) absolute total pressure ratio and (b) isentropic efficiency.

From Fig. 8(a), it can be seen that the total pressure ratio of the four types of compressors with different casings have small differences. The total pressure ratio of SW is always higher than that of the other three schemes within the range of the flow rate greater than 4.5 kg/s. The pressure ratio of SW is higher than that of the other three schemes compressors. In contrast, the total pressure ratio of CT0.2C is always greater than that of CT0.4C, while CT0.6C is the smallest. As the flow rate decreases further, the differences in the total pressure ratio of the different schemes became smaller. The total pressure ratio of the four different schemes were almost the same in the vicinity of the solid wall near-stall flow (4.03 kg/s).
From Fig. 8(b), it can be seen that the differences in the compressor efficiency of the four different self-recirculating casings are relatively obvious in the range of the flow rate greater than 4.1 kg/s. The isentropic efficiency of SW is always kept at a high level, and that of CT0.2C ranks second. The efficiency of CT0.4C is slightly lower than that of CT0.2C. The efficiency of CT0.6C is always the lowest within this flow rate range. The SW is the first to become unstable when the flow rate is less than 4.1 kg/s, at which time the efficiency of the structure is slightly lower than that of the other structures. The stability enhancement of CT0.2C is not effective. The structure enters the near-stall condition when the flow rate is in the vicinity of 3.9 kg/s, which is the least efficient among the three types of compressors with self-recirculating casing. In the flow range of 3.5kg/s to 4.1kg/s, the difference in efficiency between CT0.4C and CT0.6C is small. As the flow rate continues to get smaller, CT0.4C enters the near-stall condition at a flow rate near 3.4kg/s. CT0.6C has the largest stabilised operating range.
To visualise the differences in the influence of the self-recirculating casing processing structure on the stability and performance of the compressor for different circumferential coverage ratios. Table 4 shows the SMI and PEI of different schemes. The time-averaged results are taken to be analysed, in which the definitions of SMI and PEI are consistent with the text. From Table 4, it can be clearly seen that with the increase of the circumferential coverage ratio of the self-recirculating casing, the stability enhancement ability of the self-recirculating casing is gradually improved. The SMI of CT0.2C is only 3.09%, which is much lower than that of the other two circumferential coverage ratio schemes. With the increase of circumferential coverage ratio, the stability enhancement ability of CT0.4C increases significantly, and the SMI of this structure is 19.74%. The expansion ability of the self-recirculating casing reaches its strongest when the circumferential coverage ratio increases to 60%. At this time, the SMI of the self-recirculating casing is 49.05%. For the peak efficiency, CT0.2C has the smallest effect on the compressor, and the peak efficiency is only reduced by 0.98%. CT0.4C and CT0.6C have the same loss of the peak efficiency, and both of them reduce the peak efficiency by 1.33%. Although the self-recirculating casings with different circumferential coverage ratios have all reduced the peak efficiency to a certain extent, the PEI of the three schemes is all less than 2%. This is within the acceptable range.
SMI and PEI (time-averaged results) for self-recirculating casing structures with different circumferential coverage ratios

4.2 Comparative analysis of the flow fields
To further investigate the effect of different circumferential coverage ratios of self-recirculating casing on the stability of the compressor, the paper analyses the solid wall casing at the near-stall mass flow point (m1) and the CT0.4C near-stall mass flow point (m2), respectively.
4.2.1 Analysis at m1 (the solid wall casing at the near-stall mass flow point)
In Fig. 9, 16 radial sections uniformly distributed along the axial direction from the leading edge to the trailing edge of the blade are captured. Each radial section is perpendicular to the Z-axis. Figure 9 gives the relative Mach number distribution cloud and the tip clearance leakage streamline distributions of schemes at the m1 flow rate. The time-averaged results are taken to be analysed. The black squares in the figure show the bleeding position and injection position.
Clouds of relative Mach number distributions for blade tip passages of compressors with different casing (time-averaged results). (a) SW, (b) CT0.2C, (c) CT0.4C and (d) CT0.6C.

From Fig. 9(a), it can be seen that there is a large range of low Mach number area in the tip passage of the solid wall casing under this condition. The blockage condition within the entire passage is quite severe, resulting in poor flow capacity. From the leakage flow lines, it can be seen that there are a large number of the leakage flow lines in the tip passage, and some of the leakage flow lines go through the neighbouring blades.
From Fig. 9(b), it can be seen that CT0.2C has a slight improvement on the compressor circulation capability, the area of the low-energy zone in the tip passage is reduced. But not to a large extent, and the leakage streamlines are obviously reduced compared with the SW. It can be clearly seen that part of the leakage streamlines from the leading edge of the blade tip are sucked into the self-recirculating casing. However, the flow condition within the passage is still poor at this time. The degree of curling of the leakage streamlines near the low-energy region is relatively low, and the increase in stall margin obtained by this structure is the smallest. As the circumferential coverage ratio increases, the improvement in the compressor flow capacity by CT0.4C increases significantly. The low-energy zone in the tip passage is virtually eliminated. A large number of the leakage flow lines from the leading edge of the blade tip are drawn into the self-recirculating casing.
Compared with SW, the leakage flow line generated near the trailing edge is obviously deflected to the downstream direction. It is very favourable to improve the blockage of the tip passage, at which time the flow in the tip passage is better. CT0.6C has the best effect on the improvement of the compressor flow capacity, and the low-energy zone in the tip passage is completely eliminated. Compared to CT0.4C, the leakage streamlines from the leading edge are closer to the blade suction surface and the leakage streamlines from the trailing edge are deflected downstream at a greater angle in the CT0.6C case. The increase in stall margin obtained by this structure is the largest among the three casing structures.
To illustrate the influence of different self-recirculating casings on the tip flow capacity of the compressor, Fig. 10 shows the distribution of the relative airflow angle along the blade span for the inlet and outlet of four schemes for the time-averaged results, where the relative airflow angle is defined as follows:
 \begin{align} \theta = \arctan \left( {\frac{{{w_z}}}{{{w_t}}}} \right) * \frac{{180}}{\pi }\end{align}
where
 ${w_t}$
represents the tangential component of the relative velocity of the airflow, and
 ${w_z}$
represents the axial component of the relative velocity of the airflow. The circumferentially averaged results are taken for analysis. From Figure 10(a), it can be seen that with the self-recirculating casing, the inlet flow angle above 70% of the blade span increased, and the extent of the increase increased with the circumferential coverage ratio. This means that the angle between the airflow and the circumferential direction becomes larger. The angle-of-attack of the incoming flow will decrease accordingly. It is conducive to delaying the occurrence of the flow instability.
From Fig. 10(b), it can be seen that in the range of more than 90% of the blade tip, the outlet flow angle of the four schemes has undergone a significant reduction. The reduction of the flow angle indicates that the tangential component of the relative velocity of the airflow has increased. This aggravates the blockage in the passage. It can be seen that the outlet relative flow angle above the 90% blade span increases with the self-recirculating casing treatment compared to SW. This indicates that three casing structures can reduce the degree of the blockage of the compressor at the tip passage. Comparing the three casing schemes, the outlet flow angle above the 90% of the blade span gradually increases as the circumferential coverage ratio increases. This suggests that an increase in the circumferential coverage ratio strengthens the ability of the self-recirculating casing to improve the flow conditions at the blade tip.
Distribution of the relative airflow angle between compressor inlet and outlet along blade span. (a) Inlet relative flow angle and (b) outlet relative flow angle.

Figure 11 gives the absolute Mach number cloud and streamline distributions inside the self-recirculating casing with different circumferential coverage ratios. The same radial height section was taken for different self-recirculating casing structures, and the time-averaged results are taken for analysis. BL and IN represent the self-recirculating casing bleeding position and injection position, respectively.
Mach number and streamline distribution inside the self-recirculating casing structure (time-averaged results). (a) CT0.2C, (b) CT0.4C and (c) CT0.6C.

It can be seen that a large vortex structure exists inside all three self-recirculating casing, which is formed by the airflow with high tangential velocity when entering the casing. From Fig. 11(a), it can be seen that the low Mach number region basically occupies the entire bleeding section, which leads to the difficulty of the gas flow flowing smoothly into the self-recirculating casing. The suction capacity of this structure is poor. At the same time, the absolute Mach number of the airflow in the injection section of this structure is also low. The circumferential dimensions of both CT0.4C and CT0.6C can ensure that the airflow can complete the correction of the flow direction, so that the airflow can smoothly pass through the bleeding section. In comparison, the vortex structure inside the CT0.4C is still inside the bleeding section, occupying about 1/2 of the area of the bleeding section. This has a detrimental effect on the bleeding action of the self-recirculating casing. The swirl structure inside the CT0.6C is already in the bridge section of the self-recirculating casing and is farther away from the bleeding section, so it is easier for the airflow to enter into this structure. However, the swirl area of the internal airflow in CT0.6C is much larger than the swirl area in CT0.4C. The large swirl area will cause larger flow losses. Looking only at the distribution of the low-velocity area, the area of the CT0.4C is the smallest. This suggests that while excessive circumferential sizing can increase the bleeding flow in a self-recirculating casing, it can also increase the flow losses.
To investigate the influence of the self-recirculating casing on the compressor efficiency, the distribution of the basic performance along the blade span is given in Fig. 12. The inlet and outlet measurement points of the basic performance are aligned with the axial position of the total performance measurement points. From Fig. 12(a), it can be seen that below the 55% blade span, the total pressure ratio with different casing varies basically the same along the blade span. In the range of the 55% to 90% blade span, the total pressure ratio with self-recirculating casing is slightly higher than that of solid wall casing. The total pressure ratio increases with the increase of the circumferential coverage ratio. Above 90% span, due to the bleeding and injection of the self-recirculating casing, which will increase the internal flow loss of the compressor. Generally speaking, the total pressure ratio of SW within this range is slightly higher than that of the compressor with the self-recirculating casing.
The spanwise distribution of basic performance (time-averaged results). (a) Absolute total pressure ratio and (b) isentropic efficiency.

As can be seen in Fig. 12(b), the isentropic efficiency of the compressors in the four schemes are basically the same below 75% span. In the 75% to 95% span, the efficiency of the SW is consistently lower than that of the self-recirculating casing compressor. The isentropic efficiency in this span increases with the increase of the circumferential coverage ratio. It indicates that the self-recirculating casing has a good effect on improving the isentropic efficiency in this range. And the self-recirculating casing with a large circumferential coverage ratio can improve the isentropic efficiency more obviously. Above 95% span, since the larger the circumferential coverage ratio of the self-circulation is, the greater the airflow flow loss caused by the suction and injection effects of the self-recirculating casing will be. Therefore, the isentropic efficiency within this range decreases as the circumferential coverage ratio of the self-recirculating casing increases. In summary, although the casing treatment reduces the flow loss caused by the tip blockage, the stronger this ability is, the greater the new flow loss brought about by the bleeding/injection effect will be. On the total performance curve, the difference in efficiency between different casing compressor is not significant.
The time-averaged results alone do not fully illustrate the differences in the stability enhancement effects of the self-recirculating casing with different circumferential coverage ratios. Figure 13 gives the relationships between the global blockage ratio with respect to the moment of time for the tip passage of different schemes. The dimensionless bleeding flow rate with respect to the moment of time for the self-recirculating casing. Where the global blockage ratio is defined by intercepting a total of 30 sections perpendicular to the Z-axis from upstream to downstream of the blade passage. Take 80% of each section above the blade span to calculate the blockage ratio. The ratio of the sum of the areas with relative axial velocities less than 0 within the 30 sections to the total area of these sections is the final result of the global blockage ratio at that moment in time. The specific definitions are as follows:
 \begin{align} {{\rm{B}}_a} = \frac{{\sum\nolimits_{i = 1}^z {{A_b}} }}{{\sum\nolimits_{i = 1}^z {{A_f}} }} \end{align}
where z is the number of sections (z = 30),
 ${A_b}$
is the area occupied by the axial component of relative velocity less than 0 within the section and
 ${A_f}$
is the area of the section at different axial positions. The global blockage ratio magnitude is used to quantify the degree of blockage in the passage. The dimensionless method for the bleeding flow is consistent with the previous section. The horizontal coordinate T in the figure refers to the physical moment, and the number of physical time steps set for a single passage in the unsteady calculation is 20.
Variation of compressor global blockage ratio and the self-recirculating casing bleeding flow rate with moments. (a) The global blockage ratio of the compressor at different moments and (b) the self-recirculating casing bleeding flow at different moments.

From Fig. 13(a), we can see that the global blocking ratio of SW always stays at a relatively high level, and the fluctuation of the global blocking ratio with respect to the moment is relatively small. This indicates that the flow condition in the SW tip passage at any moment is poorer and the blockage is more serious. With the self-recirculating casing treatment, the degree of blockage was significantly reduced. But there were some differences in the ability of self-recirculating casing with different circumferential coverage ratios to reduce the degree of blockage in the compressor tip passage. Overall, the degree of the blockage in the passage gradually decreases as the circumferential coverage ratio increases. Meanwhile, after the self-recirculating casing treatment is adopted, there are obvious fluctuations in the change of the global blockage ratio in the tip passage over time, and this is particularly evident in CT0.2C.
From Fig. 13(b), it can be seen that the bleeding flow rate of the self-recirculating casing increases with increasing circumferential coverage ratio.The bleeding flow rate of CT0.2C is consistently kept at a low level. Whereas the bleeding air volume of CT0.4C is in general between that of CT0.2C and that of CT0.6C, the global blockage ratio of this structure is also in between that of the other two structures. Although the bleeding flow rate of CT0.6C was lower than that of CT0.4C in the range of T5 to T10, the bleeding flow rate of CT0.6C was significantly highest in the other moments. Taken together, the CT0.6C has the largest bleeding flow rate of the three self-recirculating casing, and the bleeding flow rate of this structure stays at a high level at most moments. Precisely because of this, the fluctuation of the blockage ratio in the tip passage of this structure over time is the smallest, and the degree of blockage is also the smallest.
4.2.2 Analysis at m2 (the CT0.4C near-stall mass flow point)
To confirm the existence of the vortex fragmentation in the passage, this paper introduces the parameter of dimensionless helicity, which is defined as:
 \begin{align} {H_n} = \frac{{\overrightarrow W \cdot \overrightarrow \xi }}{{| {\overrightarrow W } | \cdot | {\overrightarrow \xi } |}} \end{align}
where
 $\overrightarrow W $
is the relative velocity vector and
 $\overrightarrow \xi $
is the vortex vector. The dimensionless helicity refers to the tightness of the leakage vortex line around the leakage vortex core, and takes values between -1 and 1. The dimensionless spin of the leaky vortex core is close to 1. ξ=1 corresponds to fully aligned vortex lines. When an abrupt change in the value of the dimensionless helicity results in a change of sign (for example, from 1 to -1), it generally indicates the leakage vortex expansion fragmentation.
In Fig. 14, 16 radial sections uniformly distributed along the axial direction from the leading edge to the trailing edge of the blade are captured. Each radial section is perpendicular to the Z-axis. Figure 14 gives a cloud diagram of the dimensionless helicity distribution in the tip passage of SW and CT0.4C. Where SW is under the m1 flow point and CT0.4C is under the m2 flow point, both of which are taken as time-averaged results for analysis.
Cloud of dimensionless helicity distributions for compressors (time-averaged results). (a) SW (m1 flow point) and (b) CT0.4C (m2 flow point).

Figure 14(a) shows that there is obvious vortex fragmentation in the SW tip passage. However, observing Fig. 14(b), no obvious vortex fragmentation occurs in CT0.4C under the m2 flow point. This indicates that the self-recirculating casing is still able to suppress the occurrence of the vortex fragmentation in the tip passage of the compressor under the near-stall condition.
To further analyse the main causes of the flow instability inside the CT0.4C compressor, a cloud plot of the relative Mach number distribution at the 98% blade span with two different self-recirculating casing structures at the m2 flow rate is given in Fig. 15. Time-averaged results were taken and analysed. It can be seen in the figure that CT0.4C produces a partial low-energy region near the bleeding position (i.e. region I). This indicates that the structure has a limited ability to divert air and cannot completely eliminate the low-energy area in the passage at this flow rate, while also creating a large low-velocity zone at the trailing edge of the blade (i.e. region II). Both low-energy area contributed significantly to the degree of the blockage in the passage. The internal circulation in the tip passage at CT0.6C was relatively good. Although there is a low-energy zone created near the trailing edge of the blade, the blockage in the passage is low and the airflow still passes smoothly through the tip passage.
Cloud plot of the 98% span relative Mach number (time-averaged results). (a) CT0.4C (m2 flow point) and (b) CT0.6C (m2 flow point).

The relative velocity vectors at 98% span for two self-recirculating casing compressors at the m2 flow point are given in Fig. 16. Time-averaged results were taken and analysed. As can be seen in Fig. 16(a), although there is a portion of the low-energy area in the middle of the tip passage, the direction of the relative velocity of the airflow in the low-energy zone is pointing out of the passage as a whole. And there is no the serious blockage occurring in this region. Whereas the blockage caused by boundary layer separation was severe near the trailing edge of the blade. Most of the airflow flows towards the pressure surfaces of the adjacent blades, and the direction of the relative velocity of the airflow is almost parallel to the frontal line of the blades. This is very detrimental to the circulation of the tip passage. From Fig. 16(b), when the circumferential coverage ratio of the self-recirculating casing increases, the low-energy area in the middle of the tip passage disappears and the flow condition in this region is good. Although boundary layer separation also occurred near the trailing edge, it had less of an effect on the overall passage. Most of the airflow can still flow smoothly through the passage.
98% blade span relative velocity vector plot (time-averaged results). (a) CT0.4C (m2 flow point) and (b) CT0.6C (m2 flow point).

To illustrate the cause of low-energy region at blade tip, Fig. 17 shows leakage flow streamline diagrams of compressor blade tip clearance under two different casings based on time-averaged results. In the figure, leakage streamlines within first 35% of blade axial chord length are red lines, those within 35%–70% of axial chord length are green lines, and leakage streamlines beyond 70% of axial chord length are blue lines.
The leakage flow line distribution (time-averaged results). (a) CT0.4C (m2 flow point) and (b) CT0.6C (m2 flow point).

From Fig. 17(a), it can be observed that the leakage flow line curl is significantly lower in the first 35% axial chord length range. Part of the leakage flow generated in the middle of the blade cannot be eliminated by the self-recirculating casing and interacts with the leakage flow within the leading edge. This is the main reason for the formation of the low velocity region in the first half of the CT0.4C tip passage. Due to the blockage created in the first half of the tip passage, the airflow is reduced. The airflow is more severely affected by the adverse pressure gradient of the compressor at the trailing edge. As a result, after the 70% axial chord length, part of the leakage flow returns and even flows into the passage. There is also a portion of the streamline that flows over the neighbouring blades. These can lead to increased the blockage of the rear portion of the tip passage. The greater degree of the blockage is the main reason for the instability of the flow inside the compressor.
Observation of Fig. 17(b) shows that a self-recirculating casing with the 60% circumferential coverage ratio at this point is effective in suppressing the development of the leakage flow lines up to the 70% axial chord length. The red leakage flow line has a high degree of curl, which helps to eliminate blockage in the first half of the tip passage. After the 70% axial chord length, the leakage flow line can flow smoothly out of the passage without generating a large low-energy area. In short, the self-recirculating casing with a large circumferential coverage ratio is able to better suppress the interaction between the leakage flow lines. This eliminates the low-energy area in the tip passage and allows the compressor to operate stably at smaller flow rates.
Figure 18 shows the rotor suction surface limiting streamline distribution for the compressors with different casing at the flow points m1 and m2, respectively. The time-averaged results were analysed. In the figure, LE and TE represent leading edge and trailing edge, respectively. Observation of Fig 18(a) and (b) shows that at the m1 flow point, the limiting streamline separation line on the suction surface is closer to the trailing edge for both structures. That is, the suction surface boundary layer separation initiation position is closer to the trailing edge. In contrast, at the m2 flow point, the limiting streamline on the suction surface is significantly shifted towards the leading edge of the blade. This suggests that the boundary layer separation onset is shifted forward, which has a detrimental effect on the flow in the latter part of the passage. However, there is no significant difference in the separation onset location of the limiting streamlines under the action of different circumferential coverage ratios self-recirculating casing.
Limiting streamline distribution of blade back surface (time-averaged results). (a) CT0.4C (m1), (b) CT0.6C (m1), (c) CT0.4C (m2) and (d) CT0.6C (m2).

To further compare the blockage of the tip passage of the compressor with different casing, Fig. 19 shows the blockage ratio of the SW at the m1 flow point and the blockage ratio of the two self-recirculating casing structures at the m1 and the m2 flow points, respectively. The time-averaged results were analysed. The blockage ratio definition is consistent with the previous section. A total of 23 sections perpendicular to the axial direction were intercepted from the leading edge of the blade. The measurement configuration comprises 20 sections within the blade passage and 3 sections downstream of the trailing edge to quantify flow blockage induced by the low-energy region near the blade exit. The section above 80% span of each section is taken to calculate the blockage ratio, and the area with a horizontal coordinate greater than 1 in the figure is the downstream portion of the trailing edge at the blade tip. The blue area in the figure indicates the self-circulating bleeding position, i.e. 0.25Ca to 0.55Ca.
The blockage ratio for compressor tip passages (time-averaged results).

It can be seen from Fig. 19 that in the range above 0.25Ca, the blade tip blockage ratio of the compressor with casing treatment under the m2 flow point is much higher than that of the compressor with the same structure under the m1 flow rate. This shows that the effect of the self-circulating casing air injection on the compressor decreases significantly under the m2 flow point. Within the range of 0.25Ca to 0.55Ca, as the compressor flow rate decreases, the blockage degree of CT0.6C remains almost unchanged and stays at a relatively low level. However, CT0.4C exhibited significantly higher flow blockage. It suggests that the self-recirculating casing with a large circumferential coverage ratio has more suction capacity and is able to reduce the level of blockage in the passage at lower flow rates. The blockage ratio of the compressor with two different casing increases significantly at the m2 flow point for a range greater than 0.7Ca. This is due to the fact that the self-recirculating casing bleeding position is far from the trailing edge and cannot effectively suppress the generation of the leakage flow near the trailing edge. It can be seen that CT0.4C has the highest blockage ratio at the m2 flow rate in the range greater than 0.7Ca. It shows that the blockage area near the trailing edge at the m2 flow rate is also one of the important causes of the flow instability inside the compressor.
Figure 20 gives the variation of the momentum ratio (MR) of the compressor blade tip as a function of the flow rate. Where the blade tip momentum ratio is defined as the ratio of the leakage flow through the tip clearance surface to the main flow axial momentum through the blade tip above 90% of the blade span. The specific defining equation is as follows:
 \begin{align} MR = \frac{{{M_t}}}{{{M_z}}} = \frac{{\int { \pm \rho {{(\!-\! {W_t}\sin \varphi - {W_z}\cos \varphi )}^2}d{A_1}} }}{{\int { \pm \rho {W_z}^2d{A_2}} }} \end{align}
where
 ${M_t}$
represents the momentum of the leakage flow perpendicular to the chordal direction of the blade tip,
 ${M_z}$
represents the axial momentum of the main flow above 90% of the blade span,
 $\rho $
represents the density of the local airflow,
 ${W_t}$
represents the tangential component of the relative velocity,
 ${W_z}$
represents the axial component of the relative velocity and
 $\varphi $
represents the mounting angle of the blade tip. The tip momentum ratio reflects, to some extent, the relative strength of the leakage flow to the main flow.
The curve of the variation of the tip momentum ratio with the compressor flow rate (time-averaged results).

It can be seen from the figure that the tip momentum ratio of SW increases with the decreasing flow rate. This indicates that the ability of the main flow in the tip section to resist the development of the leakage flow in the tip clearance decreases as the flow rate decreases. This causes the junction of the leakage flow and the main flow in the tip passage to move towards the leading edge. This exacerbates the degree of the blockage in the tip passage and ultimately leads to the flow instability within the compressor. It is easy to see that the momentum ratio of the blade tip portion is reduced after the adoption of the self-recirculating casing. It is shown that the self-recirculating casing can effectively suppress the tip clearance leakage flow, thus reducing the degree of the blockage in the tip passage and enhancing the blade tip momentum ratio. It can be seen that the axial momentum ratio at the blade tip decreases with increasing circumferential coverage ratio for the same flow condition. It is shown that the larger the circumferential coverage ratio is, the more effective the self-recirculating casing is in suppressing the clearance leakage flow.
5.0 Conclusion
In this paper, three self-recirculating casing processing structures with different circumferential coverage ratios are designed and single passage unsteady numerical simulations are carried out. The effects of the self-recirculating casing with different circumferential coverage ratios on compressor stability and performance are analysed, and the flow mechanisms of the self-recirculating casing with different circumferential coverage ratios affecting compressor stability are revealed. The main conclusions are as follows:
-
(1) As the circumferential coverage ratio increases, the capacity of the self-recirculating casing to handle stability enhancement increases. When the circumferential coverage ratio is 20%, the stability enhancement of the self-recirculating casing is low, with an SMI of only 3.09%. When the circumferential coverage ratio was increased to 40%, the stability enhancement of the self-recirculating casing improved and the SMI reached 19.74%. When the circumferential coverage ratio was increased to 60%, the maximum amount of stall margin improvement obtained from the self-recirculating casing was 49.05%.
-
(2) As the circumferential coverage ratio increases, the bleeding flow rate of the self-recirculating casing increases, which can better suppress the expansion of the leakage flow and reduce the degree of blockage within the passage. This enables the compressor to operate stably at a smaller flow rate. In addition, as the circumferential coverage ratio increases, the onset position of the separation of the limiting streamline on the tip surface does not change significantly. This indicates that the self-recirculating casing treatment under the study cannot suppress the occurrence of airflow separation on the suction surface of the blade, but a self-recirculating casing with a large circumferential coverage ratio can reduce the range of airflow separation.
-
(3) At different flow rates, the self-circulation casing can effectively prevent the occurrence of vortex fragmentation in the tip passage of the compressor. However, only when the circumferential coverage is relatively large can the development of leakage streamlines be effectively suppressed. When the circumferential coverage is relatively small, the self-recirculating casing fails to effectively eliminate the interaction between the leakage streamlines, and an excessively high adverse pressure gradient can further deteriorate the flow near the tip trailing edge. This causes the separation point of the boundary layer on the suction surface of the tip to move towards the leading edge of the blade and exacerbates the degree of blockage in the tip passage. The flow separation near the trailing edge of the blade and the mixing of the leakage flow within the tip passage are important reasons for the internal flow instability of the compressor after the treatment casing is adopted.
-
(4) Regardless of the changes in the circumferential coverage ratio, a vortex structure will always be generated in the internal airflow of the self-recirculating casing. If the circumferential coverage ratio of the self-recirculating casing is too small, the airflow in the bleeding section of the self-recirculating casing will find it difficult to correct its flow direction. The vortex structure almost fills the entire air extraction section, reducing the suction capacity of the self-recirculating casing. If the circumferential coverage ratio is relatively large, the axial dimension of this vortex structure will increase to some extent, but it will not expand to the circumferential position of the bleeding section, thus reducing the degree of blockage in the bleeding section. However, it will still cause a certain amount of flow loss.
Acknowledgements
The authors are thankful for the support of the National Natural Science Foundation of China (No. 51006084), and the Key Program of National Natural Science Foundation of China (No. 51536006).
Conflict of interest
The authors declare that they have no conflicts of interest.