

Since the inauguration of President Donald J. Trump, the rise of protectionism and economic nationalism has caused tremendous changes in US-China relations. One of the most significant events is the outbreak of the US-China trade war and the associated technology war (Dupont, Reference Dupont2020; Williamson, Reference Williamson2021). The outbreak of COVID-19 has further intensified de-globalization and decoupling trends (Schell, Reference Schell2020; Williamson, Reference Williamson2021; Witt, Reference Witt2019; Witt, Li, Välikangas, & Lewin, Reference Witt, Li, Välikangas and Lewin2021), weakening the bilateral interdependence between the world's two largest economies (Li, Reference Li2019). As economic decoupling may become the new normal and reshape the global economic landscape, it is instructive to draw a clear picture of the potential scale and economic damage associated with US-China trade decoupling, and thus in turn trigger policy and practical responses for reducing losses at the firm, national, and global levels.
This research note focuses on potential trade decoupling and develops a novel exposure index to quantify the shares of GDP (in China, the US, and other economies) that are exposed to the decoupling. We develop the measure from the global value chain perspective (Gereffi, Humphrey, & Sturgeon, Reference Gereffi, Humphrey and Sturgeon2005; Kano, Reference Kano2018). The exposure index reflects the extent to which an economy's value added is at risk if the US-China trade linkage would be cut off. The exposure level of an economy depends on its direct and indirect trade linkages with the US and China. Our exposure index also measures the economic risks of both domestic-owned and foreign-owned enterprises (often multinational enterprises, MNEs) in different economies when faced with decoupling.
We construct an exposure index based on a flourishing strand of literature using inter-country input-output (ICIO) tables (see e.g., Koopman, Wang, & Wei, Reference Koopman, Wang and Wei2014; Los, Timmer, & de Vries, Reference Los, Timmer and de Vries2016; Tian, Dietzenbacher, & Jong-A-Pin, Reference Tian, Dietzenbacher and Jong-A-Pin2019). This is because simple custom trade statistics provide little insight into the potential impact of trade decoupling on an economy's value added. In the era of pronounced international production fragmentation, the back-and-forth trade in intermediates (often through MNEs) obscures the links between local value-added and the values gained from trade (Baldwin, Reference Baldwin2016; Johnson & Noguera, Reference Johnson and Noguera2012). Nevertheless, we can overcome these problems by developing our measure based on an ICIO model.
Multinational enterprises (MNEs) are at the forefront of the evolution of globalization, and the value-added created by MNEs is more globally distributed than that by domestic-owned enterprises. To capture the heterogeneous impact of trade decoupling on MNEs and domestic-owned enterprises, we adopt the OECD ICIO tables which distinguish firms’ ownerships with respect to their production function and mix of inputs.[Footnote 1] To measure the economic exposure of an economy to US-China trade decoupling properly, we need to link trade to value added. Applying a hypothetical extraction method (Chen, Los, McCann, Ortega-Argilés, Thissen, & van Oort, Reference Chen, Los, McCann, Ortega-Argilés, Thissen and van Oort2018; Dietzenbacher, van Burken, & Kondo, Reference Dietzenbacher, van Burken and Kondo2019; Los et al., Reference Los, Timmer and de Vries2016) to the ICIO table, we can obtain the domestic value added (DVA) of a region that is linked to US-China trade. When divided by regional GDP, we identify indicators of the share of GDP exposed to decoupling. Our approach splits value added in a region into: (i) parts that are embodied at least once (in value chains) in US-China trade between China and the US; and (ii) other parts that have no linkage with China or the US. We define part (i) as the value added that is at risk due to its exposure to the disruption of US-China trade. Please refer to Appendix I for technical details.
We consider two scenarios in this study: complete decoupling and partial decoupling. In the former scenario, we examine an extreme situation where all industries are affected by US-China trade decoupling. In the latter scenario, only technology-intensive industries will suffer from decoupling. One key assumption in our model is that all economies function well without any other frictions in the short term, aside from trade decoupling. Our calculation of economic damage could be rather conservative and likely underestimates the effect of possible trade decoupling. In reality, however, trade decoupling of the world's two leading economies is likely to trigger a tsunami in transnational investment, global financial markets, science and technology fields, etc. The effects of such great uncertainty are not accounted for in our calculation. Our analytical framework can also be extended to analyze the potential damage of other bilateral and multilateral decoupling shocks, and even de-globalization.
SCENARIO 1: COMPLETE DECOUPLING
We first study the complete decoupling scenario as a baseline investigation. As shown in Figure 1, the global level of economic exposure to US-China trade decoupling is 0.88% of the world GDP. Unsurprisingly, China suffers the highest level with 3.65% of its GDP being exposed to complete trade decoupling. The US has a lower level of exposure, displaying 1.04% of its GDP. The Chinese economy is much more dependent on exports than the US economy, even though China has been striving to reduce reliance on exports over the years. At the present time, the Chinese economy is still more dependent on the US economy than vice versa in terms of trade. Hence the economic impact of trade decoupling may exert great pressure on China. Recalling that China's annual GDP growth rate has declined to around 6% and that of the US was lower than 3% (or around 2% in some years) in recent years, 3.65% and 1.04% represent substantial damage to both the Chinese and US economies. Moreover, if the propagated effects on investment, finance, technology, and other fields could have been accounted for, the impact of US-China trade decoupling on the world economy, China, the US, and other economies would be magnified to a much larger extent.
Share of GDP exposed to complete US-China trade decoupling
Notes: Four ASEAN countries (Brunei, Cambodia, Laos, and Myanmar) are not included in our calculation due to data unavailability. The EU includes the United Kingdom.

In an era of global supply chains, the economic activities of production for US-China trade require inputs not only from the US and China but also from other economies. The decoupling of US-China trade thus brings collateral damage to other economies besides the US and China. For instance, the production of China's electronic product exports to the US imports considerable amounts of intermediates from South Korea. Once US-China trade was cut off, the output of China's electronic products would decrease, which reduces the requirement of imported intermediates from South Korea, and further causes value-added losses for South Korea. Using the ICIO model in Appendix I, we can account for the indirect transmitted impacts of US-China trade decoupling on other economies. Figure 1 shows that the exposure rates of Asian economies are clearly higher than that of NAFTA and European economies. Heterogeneous exposure levels for different economies can be attributed to their divergent intermediate trade linkages with the Chinese economy and US economy. Accounts based on the ICIO table exhibit that a substantial proportion of China's imports from South Korea (75.75%), Chinese Taipei (74.93%), and ASEAN (71.06%) are intermediate imports. Therefore, these three economies are the three most exposed regions. Although China imported the most from the EU in 2016, a relatively small proportion (57.24%) of imports were intermediates, which makes the EU a less exposed economy.
SCENARIO 2: PARTIAL DECOUPLING
Considering the full decoupling scenario is largely hypothetical, partial decoupling, i.e., technology decoupling, may be more realistic. The economic exposures mainly come from the decoupling of technology-intensive industries[Footnote 2] (The Economist, 2020a, 2020b; Helberg, Reference Helberg2020; Witt, Reference Witt2019). As shown in Figure 2, 2.1% of China's GDP is exposed to US-China trade decoupling of technology-intensive industries, and this index for the US is 0.43% of its GDP. Recalling that 3.65% of China's GDP and 1.04% of the US are exposed to complete trade decoupling, it is clear that technology decoupling has a greater impact on China's economy than that of the US (i.e., 57.5% vs. 41.3% in their respective weights).
Share of GDP exposed to the US-China trade decoupling of technology-intensive industries

Chinese Taipei and South Korea exhibit an even higher level of exposure than the US itself, with their exposure indices being 1.32% and 0.60%, respectively. This is because both Chinese Taipei and South Korea provide substantial technology-intensive intermediates (especially computer, electronic, and optical products) for production activities conducted in China, and both the Chinese Taipei and Korean economies are more dependent on such intermediate trade than the US economy is dependent on the US-China trade of technology-intensive products.
SECTORAL EXPOSURES
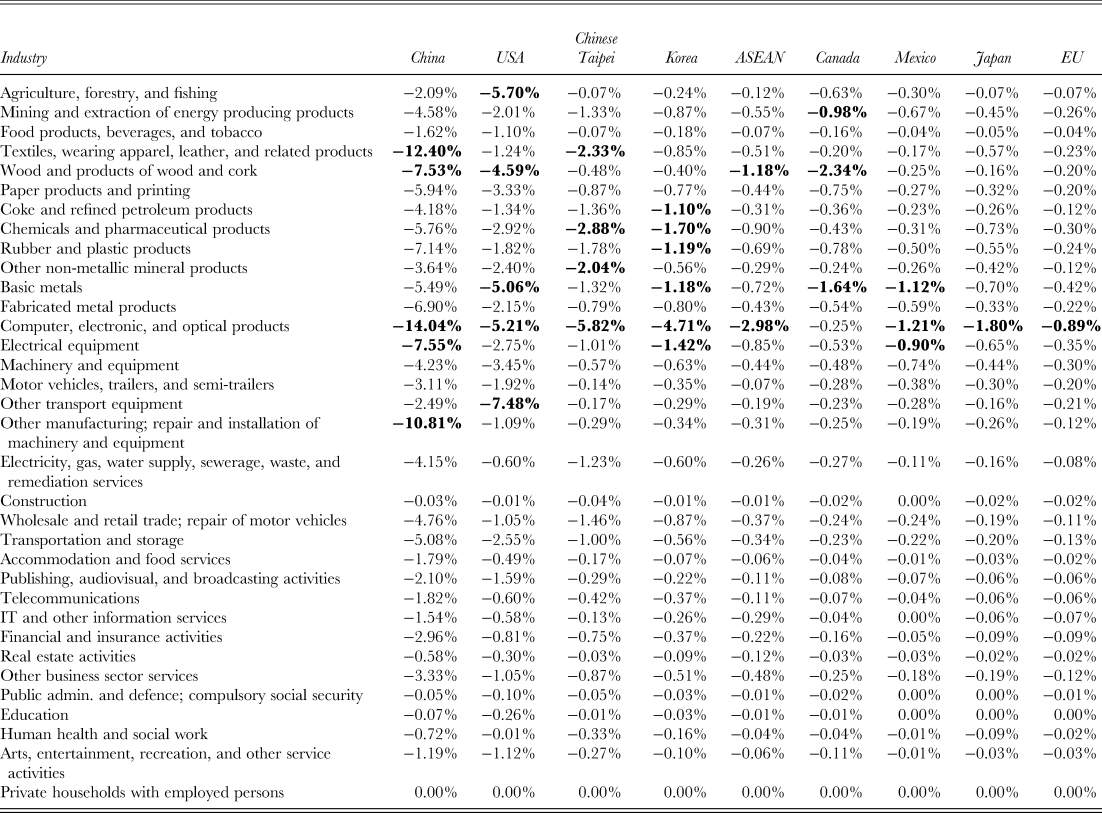
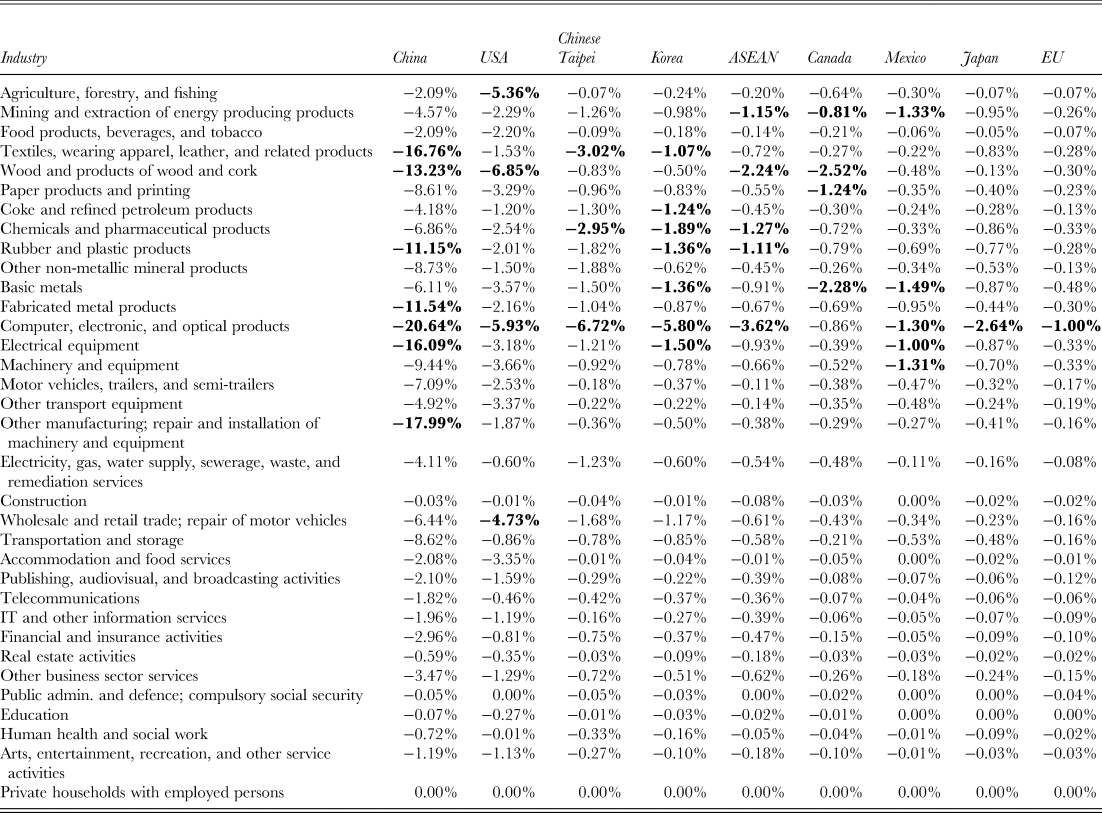
We further investigate the impact of decoupling on different sectors, domestic-owned firms, and foreign-owned firms. Economic exposures present substantial sectoral heterogeneities as well. The typical globally fragmented industries (e.g., computer, electronic, and optical products, and electrical equipment) display high exposure levels and may hereby suffer more from the disruptive decoupling. An important observation is that foreign-owned firms (MNEs) exhibit higher level of exposure no matter where they are located, indicating that MNEs are at the forefront when faced with the decoupling challenge. Once parts of global value chains suffer from disruption, MNEs would be the first to suffer losses. MNEs’ pursuit of low-cost overseas production and China's thirst for export markets have resulted in China's position as the ‘world's factory’ in recent decades. As a result, MNEs’ Chinese affiliates are very vulnerable to the sharp downturn of US-China relations. Please refer to Appendix II for detailed results on the sectoral exposure levels.
DISCUSSION
In this research note, we present the empirical results for the case of potential US-China trade decoupling, which reveals that China's economy relies more on external economies than the US, especially for technology-intensive industries. The results corroborate that China faces unprecedented uncertain situations and challenges. The economic boom of China has been fueled by the ‘go-global’ strategy and engagement in global value chains in recent decades. In the latest 14th-Five-Year plan prospecting development from 2021 to 2025, a more inward-facing economic paradigm shift has been popping up in the discussion. It is crucial for the country to accelerate ‘dual-circulation’ where the domestic economic cycle plays a leading role while international economic circulation remains as a supplement. It can be predicted that a general trend is that China's exposure to and reliance on the global economy will continue to decline (Woetzel et al., Reference Woetzel, Seong, Leung, Ngai, Manyika, Madgavkar, Lund and Mironenko2019).
We stress that ‘complete decoupling’ between the US and China remains an unappealing prospect. The cost of restructuring global value chains can be prohibitive, and in some instances, impractical. Despite the chorus of political decoupling and economic re-shoring discussions, as long as China represents a sizable share of global growth, investment in China from MNEs will remain robust to gain profits from its large and growing domestic market. To unleash the economic vitality of the domestic market, the economic growth of China will unbalance away from governmental investment and emphasize the crucial role of domestic consumption. Thus, we emphasize here that the inward-oriented dual-circulation model will not squeeze out foreign MNEs; rather, the release of domestic market potential may trigger new opportunities for foreign investors.
Meanwhile, we should also bear in mind that the power wrestling and ideological differences between the US and China make partial decoupling inevitable, especially in the high-tech sector. The ongoing devastating effects of the pandemic and the technology war are strengthening the US resolve to lower its reliance on China in terms of strategic supplies and ensure its monopolistic position in crucial technological domains. It is clear that the list of critical and strategic products and sectors will grow, which will be accompanied by more aggressive policies to ensure value-chain security.
China is developing strategies to help enterprises survive from the tremendous changes in US-China links and reduce economic losses. One of China's alternatives is to decrease its economic distance from Asian and European economies. For instance, the Regional Comprehensive Economic Partnership (RCEP) has currently been signed among China, Japan, South Korea, Australia, New Zealand, and the 10 members of ASEAN. It will progressively lower tariffs and allow freer movement of products within the region, boosting investment and promoting closer economic links. The most disruptive battleground between the US and China will be in next-generation technologies. The US has adopted technological sanctions on Chinese firms (e.g., Huawei and ZTE), and the ban was followed by America's allies. Yet, as shown in our results, MNEs bear the brunt of losses from potential decoupling. It has been seen that MNEs that rely heavily on the Chinese market are urging their home-country government to relax restrictions on Chinese companies.[Footnote 3] In the short term, Chinese firms could diversify their suppliers of core intermediate products, for example, by switching to import more semiconductors from South Korea. In the longer term, China should strengthen its technological research and development to resolve many technological ‘bottlenecks’ through market-oriented ‘open innovation’. Specifically, we can foresee that institutional and financial support towards R&D activities that can reduce China's reliance on bottleneck technologies controlled by foreign giants will continue to grow.
APPENDIX I
Technical Details
We adopt an ICIO table which distinguishes firm ownership in Table A1 (see Cadestin et al., Reference Cadestin, De Backer, Desnoyers-James, Miroudot, Rigo and Ye2018 for more detailed introduction of the table). Using such a table, we account for the heterogeneity among firms with respect to their production function and mix of inputs.
Stylized inter-country input-output table distinguishing firm ownership

We define the square matrix ${\bf A} = {\bf Z}( {\hat{{\boldsymbol y}}} ) ^{{-}1}$ as the direct input coefficients matrix. The sub-matrices, for example, ${\bf A}_{CC}^{DD} = {\bf Z}_{CC}^{DD} ( {\hat{{\boldsymbol y}}_C^D } ) ^{{-}1}$
 (or ${\bf A}_{CC}^{DF} = {\bf Z}_{CC}^{DF} ( {\hat{{\boldsymbol y}}_C^F } ) ^{{-}1}$
 ) denotes the sector-wise intermediate inputs from China's domestic-owned firms and used by China's domestic-owned firms (or foreign-owned firms) for producing one unit of output. The product market clearing condition is ${\bf y} = {\bf Z} + {\bf Fu} = {\bf Ay} + {\bf Fu}$
 , and the solution is given by the well-known static input-output model:

where ${\bf u}$ stands for the summation vector consisting entirely of ones. ${\bf I}$
 is an identity matrix with ones on the diagonal and zeros elsewhere.
Let ${\bf v}^{\prime} = {\bf w}^{\prime}( {\hat{{\boldsymbol y}}} ) ^{{-}1}\;$ be the row vector representing sector-wise value-added per unit of output. This yields:

In this study, we are interested in the extent to which the GDP of economy r is at risk. We can thus replace the vector ${\bf v}^{\prime}$ with a vector (vr)′;, which is a vector of equal length, but in which all coefficients apart from those for the industries in r have been set to zero:

Equation (3) allows us to compute, for example, the part of South Korea's GDP that can be attributed to final demand for the output of China by final users in the US. The production of massive trade between China and the US may require intermediate inputs from South Korea. The economic activities in the production of such intermediate inputs generate value added in South Korea. These indirect linkages can be empirically sizable, in particular in view of the increasing international fragmentation of production processes. By virtue of the use of the global Leontief inverse, equation (3) takes these indirect effects into account. We move forward from equation (3) and develop the following equations:

with


(4a) and (4b) yield value added in economy r in a hypothetical situation that the US cuts off all the direct trade linkages with China. The use of the hypothetical input-output model in (4a) ensures that indirect effects are also taken into account. In a international sense, the effects of US-China trade decoupling on other economies are accounted for. In a sectoral sense, the inter-sectoral effects are also included. Even if China's services industry may not export to the US, part of its GDP is exposed to the decoupling as some of its services might be supplied to industries which do export to the US. (5b) hypothetically extracts all the intermediate and final trade between China and the US, mimicking the case of complete trade decoupling. Our index for the GDP exposure to the decoupling is now given by

APPENDIX II
Sectoral Exposures to Decoupling
Sectoral exposures to complete US-China trade decoupling for domestic-owned firms

Sectoral exposures to complete US-China trade decoupling for foreign-owned MNEs

Sectoral exposures to US-China trade decoupling of technology-intensive industries for domestic-owned firms

Sectoral exposures to US-China trade decoupling of technology-intensive industries for foreign-owned MNEs