Introduction
Macrosomia is defined as a full-term newborn whose birth weight is above the 90th percentile or 4000 g in China. The incidence of macrosomia has increased to 4.7–13.1% worldwide, and the prevalence of macrosomia in China increased from 3.4 to 11.67% from 2005 to 2011.Reference Yang, Peng and Wei 1 The increasing incidence of macrosomia has become a serious problem in developing countries.Reference Koyanagi, Zhang and Dagvadorj 2 Macrosomia is not only closely associated with short-term, birth-related problems, such as surgical delivery, birth injuries, pre-eclampsia and haemorrhage,Reference Samaras, Elrick and Storms 3 but also can have long-term consequences for the offspring, including obesity, type II diabetes mellitus, and cardiovascular diseases. Animal studies have shown that macrosomia is an independent risk factor for adult metabolic syndrome.Reference Hermann, Dallas and Haskell 4
The ‘programming’ hypothesis proposes that adult metabolic syndrome, combining insulin resistance, hypertension, coronary heart disease, hyperlipidaemia, and adult obesity, is programmed by the abnormal intrauterine environment.Reference Barker 5 The placenta, which serves as the exchange interface for nutrition and energy between mother and foetus, plays a critical role in ensuring the proper growth and development of the foetus in utero.
The human transcriptome comprises protein-coding RNAs and non-coding RNAs. For many years, non-coding RNAs were considered non-functional, but in recent years, it was found that non-coding RNAs can function in post-transcriptional regulation. Long non-coding RNAs (lncRNAs) are defined as endogenous non-coding RNAs that are characterized by lengths of more than 200 nucleotides. Studies have showed that the dysregulation of lncRNAs may paly role in carcinogenesis,Reference Xie, Nie and Sun 6 – Reference Wei, Luo and Sun 8 inflammationReference Luo, Pan and Wang 9 and immunity.Reference Satpathy and Chang 10 However, the relationship between lncRNAs and non-diabetic macrosomia is still unknown.
In this study, we examined the expression of lncRNAs and mRNAs in the placenta of macrosomia births and normal birth weight newborns using Arraystar Human LncRNA Microarray V3.0, which contains ~30,586 lncRNAs and 26,109 protein-coding transcripts, and we certified the results using quantitative polymerase chain reaction (qPCR). Our results may provide new insights into the programming hypothesis and demonstrate a possible mechanism linking placentation and macrosomia.
Materials and methods
Collection and preparation of samples
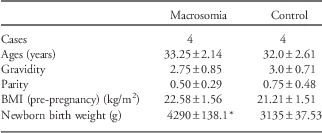
Human placentas were collected from full-term, singleton patients who were delivered by operation at Shengjing Hospital of China Medical University from September 2014 to July 2015. The exclusion criteria included hypertension, gestational diabetes, thyroid disorder, placenta previa, multiple pregnancy, assisted reproductive treatment, foetal malformation, premature of membrane rupture and other pregnancy complications. All newborns in this study were delivered by Caesarean section. Each placenta was collected from the maternal side of the placenta 2 cm away from the umbilical cord insertion site within 30 min after delivery, and was divided into 1 cm3 samples, and then frozen in liquid nitrogen and stored at −80°C. Clinical data for the patients and newborns are presented in Table 1. The number of patients included in the microarray profile was four in each group, and we examined 30 samples in each group using qPCR to verify the microarray data. Informed consent was obtained from each patient, and the study was approved by the Institute Research Ethics Committee of Shengjing Hospital.
Maternal and neonatal characteristics of the study population examined by microarray profile

BMI, body mass index.
Data are presented as the means±s.e.m.
*P<0.01, compared with the control group.
RNA isolation
Total RNA was isolated from the placenta samples using TRIZOL reagent (Invitrogen, NY, USA) according to the manufacturer’s protocol. RNA quantity and quality were measured using a NanoDrop ND-1000 instrument. RNA integrity was assessed by standard denaturing agarose gel electrophoresis.
RNA labelling and microarray hybridization
The global profiling of human lncRNAs and protein-coding transcripts were performed using Arraystar Human LncRNA Microarray V3.0. Sample labelling and array hybridization were performed according to the Agilent One-Colour Microarray-Based Gene Expression Analysis protocol (Agilent Technology, Santa Clara, USA) with minor modifications. Briefly, mRNA was purified from total RNA after removing of ribosomal RNA (rRNA) (mRNA-ONLYTM Eukaryotic mRNA Isolation Kit; Epicentre, Wisconsin, USA). Then, each sample was amplified and transcribed into fluorescent complementary RNA (cRNA) along the entire length of the transcripts without 3' bias utilizing a random priming method (Arraystar Flash RNA Labeling Kit; Arraystar, Rockville, USA). The labelled cRNAs were purified using an RNeasy Mini Kit (Qiagen, Hilden, Germany). The concentration and specific activity of the labelled cRNAs (pmol Cy3/μg cRNA) were measured using a NanoDrop ND-1000 instrument. One microgram of each labelled cRNA was fragmented by adding 5 μl of 10×blocking agent and 1 μl of 25×fragmentation buffer, the mixture was then heated at 60°C for 30 min and finally, 25 μl of 2×GE hybridization buffer was added to dilute the labelled cRNA. Hybridization solution (50 μl) was dispensed into a gasket slide, which was then assembled with the lncRNA expression microarray slide. The slides were incubated for 17 h at 65°C in an Agilent Hybridization Oven. The hybridized arrays were washed, fixed and scanned using the Agilent DNA Microarray Scanner (part number G2505C). The microarray was performed by Kang Chen Biotech, Shanghai, China. Agilent Feature Extraction software (version 11.0.1.1) was used to analyse the acquired array images. Quantile normalization and subsequent data processing were performed using the GeneSpring GX v12.1 software package (Agilent Technologies). To identify differentially expressed lncRNAs, we performed a fold change filtering between the paired samples (macrosomia v. control) (fold change ⩾2.0, P-value cut-off is 0.05). The threshold for upregulation of lncRNAs was fold change ⩾2.0 (P⩽0.05) and the threshold for downregulation of lncRNAs was fold change ⩽−2.0 (P⩽0.05). So was the threshold for mRNAs. P-value is calculated by t-test.
GO and pathway analysis
The gene ontology project provides a controlled vocabulary to describe gene and gene product attributes in any organism (http://www.geneontology.org). The ontology covers three domains: Biological Processes, Cellular Components and Molecular Functions. Fisher’s exact test is used to determine whether there is more overlap between the differential expression (DE) list and the GO annotation list than would be expected by chance. The P-value denotes the significance of GO term enrichment in the DE genes. The lower the P-value, the more significant the GO Term (P⩽0.05 is recommended). Pathway analysis is a functional analysis that maps genes to KEGG pathways (http://www.genome.jp/kegg/). The P-value (EASE-score, Fisher’s P-value or Hypergeometric P-value) denotes the significance of the pathway correlated to the conditions. The lower the P-value, the more significant the pathway is (the recommended P-value cut-off is 0.05).
Quantitative real-time PCR
Total RNA was extracted and reverse transcribed using the GoScript Reverse Transcription System (Promega, Madison, WI, USA), and the expression of lncRNAs and mRNAs was measured using the Go Taq qPCR Master Mix (SYBR green assay) (Promega, Madison, WI, USA). 18 s was used as an internal control. qPCR amplifications were performed using the ABI PRISM 7500 Sequence Detection System (Applied Biosystems, Waltham, USA). The conditions were used as follows: 10 min at 95°C, followed by 40 cycles of 15 s at 95°C, and 30 s at 60°C. A dissociation curve was drawn to ensure the validity of each qPCR product. The reaction was repeated three times, and the fold change of lncRNA and mRNA expression were calculated using the
 $${\rm 2}^{{{\minus}\Delta \Delta C_{t} }} $$
method. P-values <0.05 were considered statistically significant.
Statistical analysis
The Student’s t-test was used to analyse significant differences using SPSS 18.0 software. P-values <0.05 were considered statistically significant.
Results
Thousands of lncRNAs and mRNAs were differentially expressed in the placenta of macrosomia births
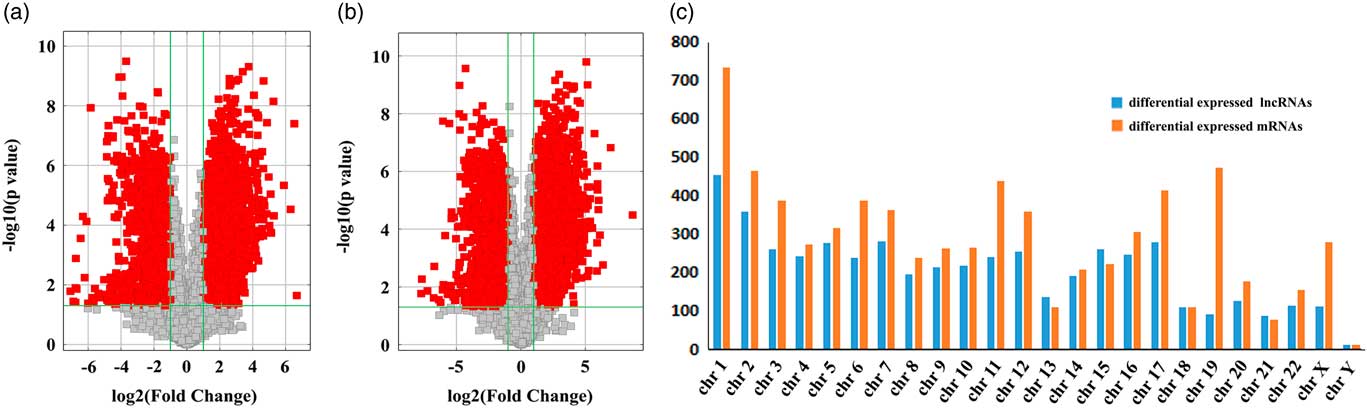
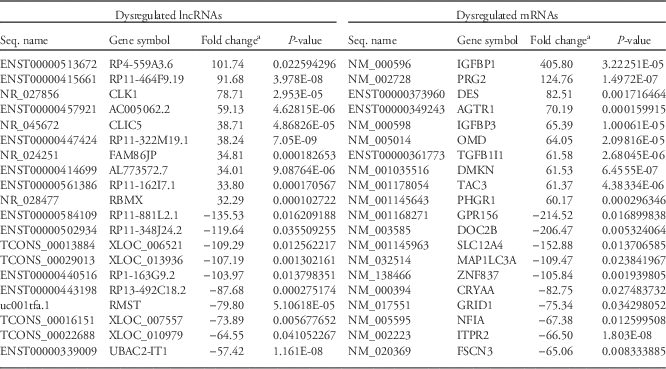
To study the potential role of lncRNA in the placenta of macrosomia births, we used microarray analysis to determine the lncRNA and mRNA expression profiles of macrosomia and normal birth weight newborns’ placentas. The data showed that 2929 lncRNAs and 4574 mRNAs were upregulated in macrosomia placentas compared with normal birth weight placentas (fold change ⩾2.0, P<0.05), and 2127 lncRNAs and 2511 mRNAs were downregulated (fold change ⩾2.0, P<0.05) (Fig. 1a and 1b). The chromosome distribution of differentially expressed lncRNAs and mRNAs were calculated (Fig. 1c). The microarray data discussed in this article have been deposited at the National Center for Biotechnology Information (NCBI) Gene Expression Omnibus (GEO) and are accessible as (GEO) Series accession number GSE74485. The top 10 dysregulated lncRNAs and mRNAs are listed in Table 2.
(a) Volcano plot of the long non-coding RNA (lncRNA) expression microarray profile. The x-axis represents fold change of lncRNAs of the macrosomia group compared with the control group; upregulation of lncRNAs is shown by positive fold changes (>0), and the downregulation is shown by negative fold changes (<0), The threshold for fold changes representing differential expression was ⩾2, and P⩽0.05 were considered significant. The red plots represent significantly differentially expressed lncRNAs. P-value is calculated by t-test. (b) Volcano plot of the messenger RNA (mRNA) expression microarray profile. The red plots represent differentially expressed mRNAs in the macrosomia group compared with the control group (fold change ⩾2, P⩽0.05). P-value is calculated by t-test. (c) Chromosome distribution of differentially expressed lncRNAs and mRNAs.

The top 10 upregulated and downregulated lncRNAs and mRNAs

a Fold change: positive numbers represent upregulation, and negative numbers represent downregulation.
GO analysis and pathway analysis
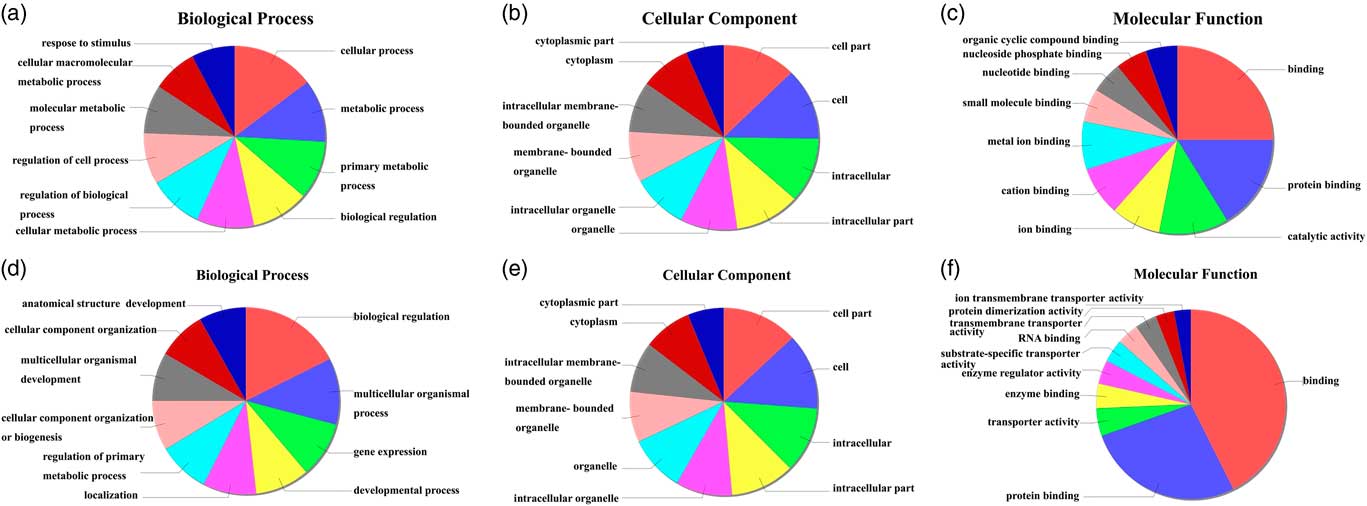
GO analysis was performed to determine the gene and gene product enrichment in biological processes, cellular components and molecular functions. Fisher’s exact test was used to determine whether the overlap between the differentially expressed gene list and the GO annotation list was greater than that expected by chance (P<0.05, Fig. 2). We found the most enriched GOs that were targeted by over-regulated transcripts were cell process (ontology: biological process) (Fig. 2a), cell (ontology: cellular component) (Fig. 2b) and binding (ontology: molecular function) (Fig. 2c) and that the most enriched GOs that were targeted by under-regulated transcripts were biological regulation (ontology: biological process) (Fig. 2d), cell (ontology: cellular component) (Fig. 2e) and binding (ontology: molecular function) (Fig. 2f).
Gene ontology enrichment analysis of the differentially expressed profiles. Gene ontology enrichment analysis provides a controlled vocabulary to describe differentially expressed transcript attributes in all organisms. The ontology covers three domains: biological processes, cellular components and molecular functions (P<0.05 are recommended); (a, b, c) gene ontology enrichment analysis of upregulated mRNAs. (d, e, f) Gene ontology enrichment analysis of downregulated messenger RNAs (mRNAs).

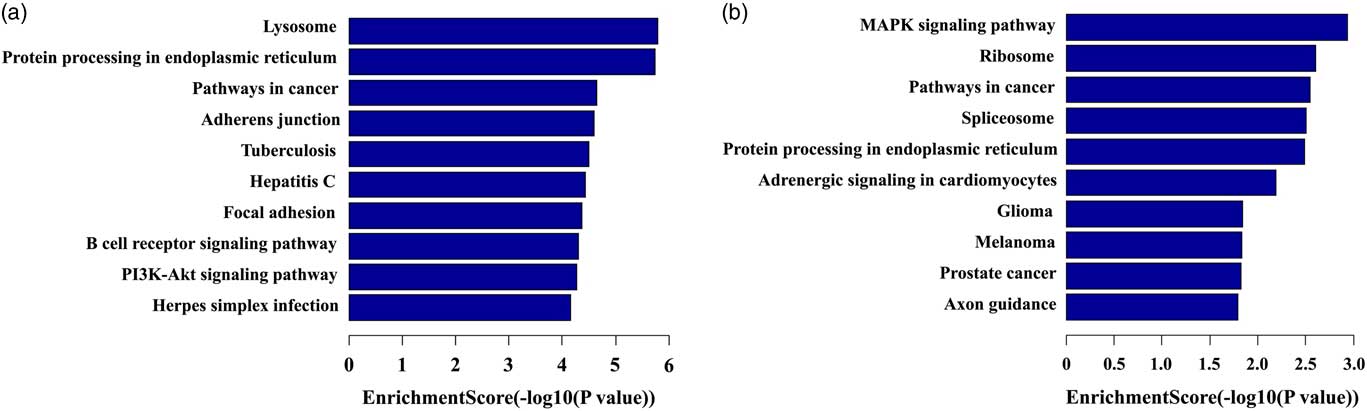
Pathway analysis indicated that 77 pathways corresponded to upregulated transcripts and that the most enriched network was Lysosome – Homo sapiens (human), comprising 55 targeted genes. Furthermore, this analysis showed that 23 pathways corresponded to downregulated transcripts and that the most enriched network was the mitogen-activated protein kinase (MAPK) signalling pathway – H. sapiens (human), comprising 50 targeted genes (P<0.05, Fig. 3).
Pathway analysis of differentially expressed messenger RNAs (mRNAs). (a) Pathway analysis of upregulated expressed mRNAs between the macrosomia group and the control group. (b) Pathway analysis of downregulated expressed mRNAs between the macrosomia group and the control group.

Validation of the microarray data using qPCR
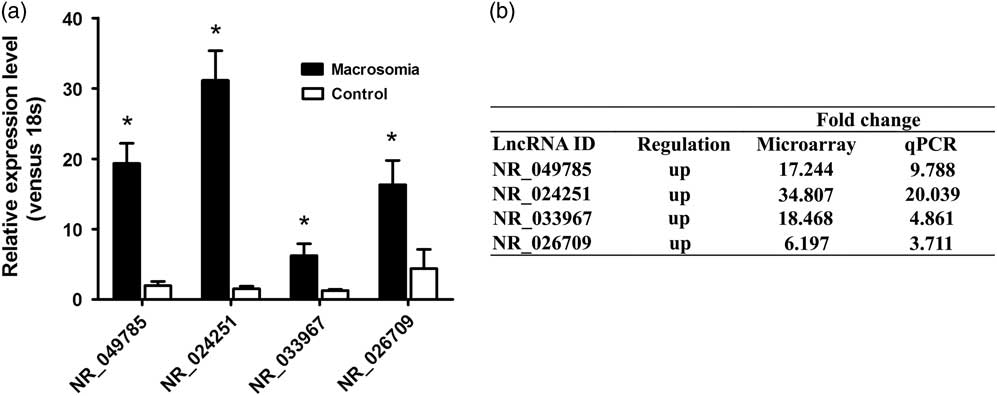
We collected 30 samples in each group for qPCR validation and randomly chose four lncRNAs (NR_049785, NR_024251, NR_033967, NR_026709) from the differentially expressed lncRNAs between the two groups. The results showeing the expression of lncRNAs are shown in Fig. 4a. The expression of lncRNA-SNX17 (NR_049785) of the macrosomia group (19.35±2.84) was upregulated 9.788-fold compared with the control group (1.98±0.59) (P<0.01); the expression of lncRNA-FAM86JP (NR_024251) of the macrosomia group (31.14±4.22) was upregulated 20.039-fold compared with the control group (1.55±0.34) (P<0.01); the expression of lncRNA-SLC2A1-AS1(NR_033967) of the macrosomia group (6.24±1.69) was upregulated 4.861-fold compared with the control group (1.28±0.16) (P<0.01); and the expression of lncRNA-CLEC4M of the macrosomia group (16.32±3.44) was upregulated 3.711-fold compared with the control group (4.40±2.72) (P<0.01). We also compared the obtained qPCR results with the microarray data. The comparison is shown in Fig. 4b.
Comparison of quantitative polymerase chain reaction (qPCR) data for differentially expressed long non-coding RNAs (lncRNAs) in placenta tissues between the macrosomia group and the control group. (a) The level of lncRNA was calculated relative to 18 s (internal control) using the
 $${\rm 2}^{{{\minus}\Delta \Delta C_{t} }} $$
method. Error bars indicate standard errors. *P<0.01. (b) The qPCR results were consistent with the microarray data.

Discussion
The incidence of metabolic syndrome is increasing in China each year. Macrosomia, as an independent risk factor for adult metabolic syndrome,Reference Hermann, Dallas and Haskell 4 not only leads to increasing birth trauma, hypoglycaemia, polycythaemia, and NICU admission rates, but also results in high caesarean section rates in China.Reference Akin, Cömert and Turan 11 The foetal development is a complex process that requires the delicate regulation of many factors, including hormones, growth factors, cytokines, and receptors.Reference Moog, Entringer and Heim 12 , Reference Kridli, Khalaj and Bidarimath 13 The placenta, as the only connection between the mother and infant for nutrition exchange and material supplementation, is critical for ensuring normal foetal development in utero. Studies have shown that abnormal placentation is closely related with the pathogenesis of pregnancy-related diseases, such as preeclampsia, foetal growth restriction, and abortion.Reference Redman and Staff 14 – Reference Kim, Yoon and Lee 16 It has also been demonstrated that placentation may be related with the regulation of macrosomia.Reference Sabri, Lai and D’Silva 15
LncRNAs represent a type of non-coding RNAs that are distinguished by being longer than 200 nucleotides in length. LncRNAs exhibit high tissue specificityReference Djebali, Davis and Merkel 17 and play important roles in chromatin remodelling, transcription, and post-transcriptional regulation.Reference Mercer, Dinger and Mattick 18 In 2013, Zou et al. found that upregulation of the lncRNA SPRY4-IT1 inhibited the proliferation and invasion of the trophoblast cell line HTR-8SV/neo.Reference Zou, Jiang and Yu 19 Another study showed that 738 lncRNAs were differentially expressed in the placentas of pre-eclampsia patients,Reference He, He and Xi 20 which suggests that lncRNAs may be involved in pathological pregnancy. Thus far, no studies have examined the relationship between lncRNA expression and placentation in non-diabetic macrosomia births.
Our study first examined the global lncRNA and mRNA expression profiles in the placenta of non-diabetic macrosomia births, and the results showed that thousands of lncRNAs and mRNAs were differentially expressed. We randomly chose four differentially expressed lncRNAs to validate the microarray results, and the results showed that the microarray results were consistent with the qPCR data. LncRNA NR_049785 is a 2482-bp lncRNA, which is transcripted from the SNX17 gene, located in chromosome 2. SNX17 is a member of the Phox-homology (PX) domain-containing protein family and has been shown to mediate internalization, recycling, and the protection from degradation of multiple cell surface proteins including P-selectin,Reference Lee, Retamal and Cuitiño 21 integrin β1,Reference Böttcher, Stremmel and Meves 22 members of the low-density lipoprotein receptor familyReference Stockinger, Sailler and Strasser 23 and ApoER2,Reference Sotelo, Farfán and Benitez 24 and regulation of the endocytosis rate of receptors.Reference Stockinger, Sailler and Strasser 23 LncRNA NR_024251 is a pseudogene and is also known as family with sequence similarity 86 member J (FAM86JP) with a length of 2068 bp; as yet, no study on its function has been conducted. LncRNA NR_033967 is a natural antisense lncRNA of SLC2A1 (1138 bp), which is located in chromosome 1. SLC2A1 is also known as glucose transporter 1 or GLUT1. Studies showed the basal membrane content of SLC2A1 can be increased by IGF-I, thus upregulating the basal membrane transport of glucose, leading to increased transepithelial glucose transportReference Baumann, Schneider and Malek 25 ; the expression of SLC2A1 can also be affected by hypoxia, which is highly correlated with the pathogenesis of foetal growth restriction and pre-eclampsia.Reference Baumann, Zamudio and Illsley 26 SLC2A1 is reportedly over-expressed in the placentas of gestational diabetic women and may contribute to foetal macrosomia in diabetic pregnancy.Reference Gaither, Quraishi and Illsley 27 The upregulation of lncRNA NR_033967 might be a complementary mechanism to that of SLC2A1 gene. LncRNA NR_026709 is transcribed from CLEC4M (2248 bp),which is located in chromosome 19, and is also known as DC-SIGNR. CLEC4M encodes a transmembrane protein, and can induce ERK1/2 and Akt phosphorylation and activation in dentrReference Caparrós, Munoz and Sierra-Filardi 28 ; the extracellular-signal-regulated kinase signalling pathway may be the common pathway in the regulation of trophoblast invasion and proliferation,Reference Zhang, Chen and Xing 29 , Reference Prakash, Suman and Morales Prieto 30 and trophoblast cell proliferation and invasion defects are expected to lead to severe delays in the development of the placenta and cause abnormalities of the embryo. The lncRNAs chosen for the qPCR validation were related to placental development and nutrition exchange, which may be related to the mechanism of macrosomia pathogenesis. To detect the function of the differentially expressed lncRNAs and their possible relationship with the differentially expressed mRNAs, we performed GO analysis and Pathway analysis and identified that the PI3K-AKT signalling pathway, the MAPK signalling pathway, the focal adhesion pathway, the B cell receptor signalling pathway, and the protein processing in the endoplasmic reticulum and lysosome pathway were significantly differentially expressed in the macrosomia placentas. These results suggest that abnormal placentation may participate in the foetal development in utero and in the regulation of the long-term programming of adult diseases. Our study first examined the possible relationship between lncRNA and macrosomia, however, there are still limitations. Placentas used in microarray profile and qPCR were collected in Shengjing Hospital, for the reason of regional restriction. Also only pregnancy women in north China were included in the study. Our study could not rule out the effects of foetus gender on lncRNAs’ and mRNAs’ expression in the placenta. In the validation test, we only analysed some lncRNAs by qPCR, and did not examine the regulatory mechanism of the lncRNAs and their relationship with the target genes. We are planning to study the function of these lncRNAs and their impact on the biological behaviour of trophoblasts in the near future.
This is the first study on lncRNA expression in non-diabetic macrosomia, and contributes to our understanding of the epigenetic regulation network of macrosomia in utero. This study also provides new insights into the programming hypothesis of macrosomia.
Acknowledgements
The work is supported by grants from the National Natural Science Foundation of China (No. 81300492 and No. 81601289).
Conflicts of Interest
None.