The function of immunoglobulins (Ig) in bovine milk and colostrum is to protect the mammary gland and the calf with an immunological defence against pathogens (Korhonen et al. Reference Korhonen, Marnila and Gill2000; Lilius & Marnila, Reference Lilius and Marnila2001). IgM antibodies, which originate from plasma cells in smaller amounts than IgG, are more efficient in complement fixation (Marnila & Korhonen, Reference Marnila, Korhonen, Roginski, Fuquay and Fox2002). In contrast, the secretory IgA plays a major role in the innate immune system preventing microorganisms and foreign proteins from penetrating the mucosal surfaces (Mestecky et al. Reference Mestecky, Russell and Elson1999). It also neutralizes toxins and infectious microorganisms.
In mature milk, immunoglobulins account for only 1–2% of the protein (Larson et al. Reference Larson, Heary, Devery and Devery1980). In serum, IgM and IgA occur at concentrations of about 3·0 mg/ml and 0·4 mg/ml, respectively (Butler, Reference Butler1994). Total Ig levels in milk are around 0·7–1·0 mg/ml. Immunoglobulins in the lacteal secretions continue to be of high scientific interest because of the synthesis and transfer mechanisms and their economic importance to animal and human health (Larson et al. Reference Larson, Heary, Devery and Devery1980).
Concentration of the bovine Ig milk is affected by various factors including breed, age, health status and lactation stage of the animal (Butler, Reference Butler1986, Reference Butler1994; Larson et al. Reference Larson, Heary, Devery and Devery1980; McFadden et al. Reference McFadden, Besser, Barrington, Welch, Burns, Davis and Popay1997; Norderhaug et al. Reference Norderhaug, Johansen, Schjerven and Brandtzaeg1999). However, there are conflicting data regarding the relationship between these factors and milk IgA and IgM levels. A previous study evaluated factors affecting milk immunoglobulin, mainly IgG, concentrations in milk (Liu et al. Reference Liu, Wang, Bu, Cheng, Zhang, Wei, Zhou, Zhou, Hu and Dong2009). Furthermore, most studies to date have only assessed IgA and IgM concentrations in colostrum or colostrum-based productions (Korhonen et al. Reference Korhonen, Marnila and Gill2000) and there are only a few studies concurrently relating factors influencing IgA and IgM concentrations in normal bovine milk.
The purpose of this study was to determine whether lactation number, stage of lactation, daily milk production, milk composition and somatic cell score (SCS) have an association with milk IgA and IgM concentrations.
Materials and Methods
Cows
A total of 284 Chinese Holstein cows were chosen from more than 1600 cows from one farm. The cows selected had not shown any signs of mastitis (by checking for presence of redness, swelling, hardness and pain in the udder, or presence of clots in milk) for 2 months prior to inclusion in the study. All cows were housed under the same conditions and were fed a total mixed ration (TMR) three times daily. Mean parity of lactating cows used in this study was 2·52±1·61 (range 1–8) and average daily milk production was 22·22±6·29 kg (range 9·6–37·9 kg).
Production data
Lactation number, stage of lactation and daily milk production data were obtained electronically from the China Dairy Herd Improvement System of Ministry of Agricultural Milk and Dairy Inspection and Supervision Center (Beijing).
Milk sample collection
From each animal, duplicate milk samples were collected at 09.00, 16.00 and 22.00 on each sampling day using a robotic sampling system (WestfaliaSurge 9JGD-YG-32, Germany). Samples were mixed in a ratio of 4:3:3 by volume for morning, afternoon and evening milk. One set of milk samples (50 ml), preserved with bronopos-B2 (Sigma, USA) was analysed for fat, protein, lactose, total solids and somatic cell count (SCC) by near mid-infrared procedures using a MilkoScan Minor machine (MilkoScan 4000, Foss Electric, Hillerød, Denmark). Another set of milk samples (30 ml), used for IgA and IgM concentration determination, was centrifuged at 10 000 g at 4°C for 15 min to remove fat (Legend Mach 1.6/R, Sorvall, Germany). Skimmed milk and serum samples were frozen at −80°C until analysed.
Determination of IgA and IgM concentrations in milk
Determination of IgA and IgM concentrations in milk samples was performed by commercial sandwich enzyme-linked immunosorbent assay (ELISA) using the bovine IgA and IgM ELISA Quantitation Kit (Bethyl Laboratories, Montgomery TX, USA). Procedures were according to manufacturer's instructions. Standard IgA and IgM solutions (200 μg/ml) were used to construct the standard curve. Milk samples were diluted 1:2000 and 1:1000, respectively, for IgA and IgM quantification. Intra-assay variation was determined from 10 successive analyses of a milk sample in three different dilutions (1:1000, 1:2000, 1:3000). Inter-assay variation was evaluated with the same three milk samples in 10 different runs.
Statistical analysis
Stage of lactation, daily milk production and SCC of cows were classified during ANOVA analysis according to the method of Hagiwara et al. (Reference Hagiwara, Kawai, Anri and Nagahata2003) as shown in Table 2. Somatic cell count data were converted into SCS [SCS=log2 (SCC/100 000)+3] to eliminate effect of lactation day and period of sampling on SCS (Shook, Reference Shook1982). Measured IgA and IgM concentration (μg/ml) data were transformed into logarithmic form, and distribution of milk IgA and IgM concentration (log) was assessed by a chi-square test for goodness of fit.
Data of IgA and IgM concentration (log) were classified according to lactation number, daily milk production, stage of lactation and SCS, and data were analysed by multifactor ANOVA of SAS 9.0 (SAS Institute, Cary NC, USA). Correlation coefficients among milk IgA and IgM concentration (log) with production parameters and milk composition were analysed using multiple correlation analysis. Using results of multiple correlation analysis, traits that were strongly correlated with IgA and IgM concentration (log) were analysed for path analysis and prediction regression equation with PROC REG and PROC STEPWISE procedures. Milk traits were defined as independent variables, and IgA or IgM concentration (log) as dependent variables. The decision coefficient was calculated from the following formula: R2=2∗P∗r−P2 (R2 is decision coefficient, P is direct path coefficient, r is simple correlation coefficient). Significance and high significance were assumed at P<0·05 and P<0·01, respectively.
Results
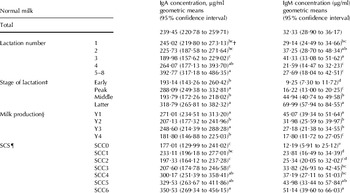
Milk IgA and IgM concentrations from Chinese Holstein cows ranged from 37 to 957 μg/ml and from 6 to 195 μg/ml, respectively. Geometric means of milk IgA and IgM concentrations were 239 and 32 μg/ml, respectively. Concentrations of IgA and IgM in normal lactating cows were found to be normally distributed after log transformation (chi-square test for goodness of fit, P>0·05). The 95% confidence interval for milk IgA and IgM concentrations was 221–260 μg/ml and 29–36 μg/ml, respectively.
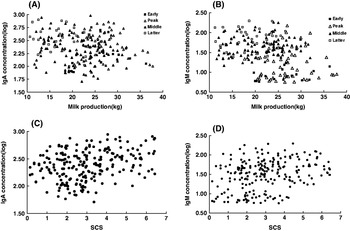
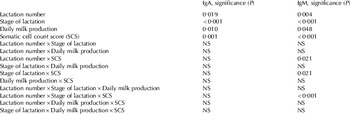
According to multifactor ANOVA analysis, lactation number, stage of lactation, milk production and SCS were significantly (P<0·05) associated with milk IgA and IgM concentrations (Tables 1 and 2). For the cows selected (no mastitis for 2 months) in this study, the cows in lactation numbers 3 and 5–8 had the lowest and highest milk IgA concentrations (log) respectively. However, the cows in lactation numbers 4 and 3 had the lowest and highest milk IgM concentrations (log) respectively. Milk IgA concentrations (log) decreased to minimum for lactation numbers 1–3 but then increased as the lactation number increased. However, IgM concentrations (log) increased to peak from lactation numbers 1 to 2 or 3, and then decreased to minimum at lactation number 5–8. Plots of IgA and IgM concentrations (log) in normal milk on milk production using grouped stage of lactation as a plotting symbol are shown in Fig. 1 (A,B). As daily milk production increased, IgA and IgM concentrations (log) decreased (P<0·05) slowly. Stage of lactation had a positive association with IgA and IgM concentrations (log) while interaction of daily milk production and stage of lactation had no significant association with Igs concentrations. Milk IgA and IgM concentrations (log) increased (P<0·05) as SCS increased as shown in Fig. 1 (C,D).
Relationships of IgA and IgM concentrations (log) in normal milk to production parameters. (A) and (B) show relationship of IgA and IgM concentrations (log) to milk production and stage of lactation. (C) and (D) show relationships of IgA and IgM concentrations (log) to somatic cell count score (SCS) and stage of lactation.

Factorial analysis (factorial ANOVA) for IgA and IgM concentrations (log) in milk from normal lactating cows

IgA and IgM concentrations in normal milk from lactating cows

† Values in the same row and variable without a common superscript letter are significantly different (P<0·05)
‡ Stage of lactation was classified as follows: Early: 15–49 d from parturition; Peak: 50–109 d from parturition; Middle: 110–219 d from parturition; Late: 220–the end of lactation.
§ Milk production: milk production was divided into four groups as follows: Y1<20 kg; 20 kg⩽Y2<25 kg; 25 kg ⩽Y3<30 kg; Y4⩾30 kg
¶ Somatic cell count score: Somatic cell count score was classified by the number of milk somatic cell as follows: 0⩽SCC0<18 000; 18 000⩽SCC1<36 000; 36 000⩽SCC2<71 000; 71 000⩽SCC3<142 000; 142 000⩽SCC4<283 000; 283 000⩽SCC5<566 000; 566 000⩽SCC6<1132 000
Correlations between production parameters, milk composition and IgA, IgM concentrations (log) were determined. Results showed that milk IgA concentrations (log) were correlated (P<0·01) with lactation number, daily milk production, milk lactose and SCS. Of these correlation factors, lactation number (r=0·16) and SCS (r=0·29) were positively correlated, whereas daily milk production (r=−0·17) and milk lactose (r=−0·18) were negatively correlated. Milk IgM concentrations (log) were correlated (P<0·01) with stage of lactation, daily milk production, milk protein and SCS. Stage of lactation (r=0·63), milk protein (r=0·42) and SCS (r=0·30) were positively correlated, and daily milk production (r=−0·30) was negatively correlated.
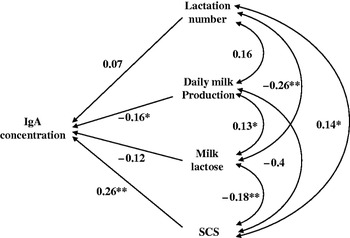
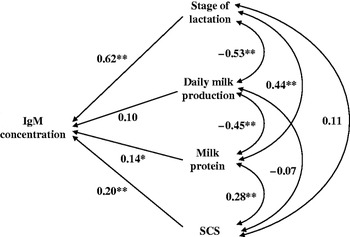
Multiple correlation analysis found all four traits were significantly correlated with IgA and IgM concentrations. Path analysis was employed to further analyse direct and indirect factors associating with IgA and IgM concentrations (log) in milk (Figs 2 and 3). It was found that SCS and daily milk production had a direct action (P<0·05) on IgA concentrations (log) with direct path coefficients of 0·26 and −0·16. Stage of lactation, milk protein and SCS also had a direct action (P<0·05) on IgM concentrations (log) with direct path coefficients of 0·62, 0·20 and 0·14. Other factors, such as lactation number and milk lactose had more indirect effects on IgA concentrations (log), and milk production had more indirect effect on IgM concentrations (log).
Path diagram for relationships among IgA concentrations (log) in milk with lactation number, stage of lactation, milk lactose and Somatic cell count score (SCS). *: P<0·05; **: P<0·01.

Path diagram for relationships among IgM concentrations (log) in milk with lactation number, stage of lactation, daily milk production and milk protein percent. *: P<0·05; **: P<0·01.

Besides relative effects of parameters to Ig concentrations, absolute effects were decision coefficients that needed to be analysed. For IgA, SCS had highest decision coefficient of 0·09, indicating that SCS was the decisive principal factor. For IgM, stage of lactation had highest decision coefficient of 0·42, indicating that it was the decisive principal factor. For IgM, daily milk production had a negative coefficient of −0·07, indicating that it was the most restricted factor. Coefficients of factors for IgA and IgM concentrations were just 0·360 and 0·494, respectively. All factors assessed in this study accounted for 36·0% and 49·4% contributions to changes in IgA and IgM concentrations in milk, respectively.
Optimal regression equations were constructed to assess linear associations of all production factors and milk composition with IgA and IgM concentrations (log) in normal milk. For IgA, best optimal regression equation was as follows: Y1=21·18+0·05X8, where Y1=IgA concentration (log), X8=SCS. The R-square was 0·35 and was highly significant (P<0·01). For IgM, best optimal regression equation was as follows: Y2=0·82+0·004X2+0·06X8, where Y2=IgM concentration (log), X2=stage of lactation, X8=SCS. The R-square was 0·49 and was highly significant (P<0·01).
Discussion
This study showed that milk IgA and IgM concentrations in dairy cows were associated with lactation number. For the cows selected (no mastitis for 2 months) in this study, the older cows had higher milk IgA. Path analysis revealed that lactation number was not the strongest contributing factor for IgA concentration, while it was the highest significant contributing factor for IgM. Results presented in this study were similar to those reported by Devery-Pocius & Larson (Reference Devery-Pocius and Larson1982) who found that age was a major factor affecting amount of bovine colostral immunoglobulins. T lymphocyte regulation of antibody production and function was also found to decrease with age in both mice and man (Kishimoto et al. Reference Kishimoto, Tomino, Kotegawa, Saito, Kuroki, Mitsuya and Hisanitsu1978). Although higher concentrations of immunoglobulins in colostrum of cows with several lactations had been noted (Oyeniyi & Hunter, Reference Oyeniyi and Hunter1978), to our knowledge there were few studies on possible relationship of age with total amount of immunoglobulins secreted in normal milk. Our study evaluated additional factors associating with IgA and IgM concentrations in normal milk. Williams et al. (Reference Williams, Spooner and Thomas1975) measured serum Ig in Ayrshire cows and found age was correlated with IgM in serum. We also measured IgM concentrations in serum (data not shown) but no relationship was found between lactation number (age) and IgM in serum. Other factors such as breed, age, and udder health have been found to influence the immunoglobulin concentrations in milk (Butler et al. Reference Butler1994; McFadden et al. Reference McFadden, Besser, Barrington, Welch, Burns, Davis and Popay1997).
Variation of milk IgA and IgM concentrations among different stages of lactation was evaluated. For the cows selected (no mastitis for 2 months) in this study, the cows in peak and latter periods had the highest IgA concentrations, and the cows in latter period had the highest IgM concentrations. Direct path coefficient between stage of lactation and IgM concentration was 0·62 and was highly significant (P<0·01), which indicated that IgM concentration had was positively and directly correlated with stage of lactation. West et al. (Reference West, Oftedal, Carpenter, Krames, Campbell and Sweeney2007) and Mazengera et al. (Reference Mazengera, Kennedy, Burnside, Wilkie and Burton1985) found that IgA and IgM concentrations in milk increased from 14 d to the end of lactation. This pattern could be explained by an enhancement of the selective transport process of Ig in the mammary gland from peak to the later lactation period. Daily milk production acted as a diluting factor, so that higher concentrations of IgM or IgA might be expected at the end of lactation. Other Igs such as IgG1 concentration in milk were similar at 30 and 150 d of lactation, but significantly different at the end of lactation (Caffin et al. Reference Caffin, Poutrel and Rainard1983).
In the present study, IgA and IgM concentrations were found to be highly correlated with milk production. For the cows selected (no mastitis for 2 months) in this study, the cows with lowest milk production had higher IgA and IgM concentrations, but there was no linear regularity. A possible explanation might be other interactions among production parameters (a plot of these data can be found in Fig. 1) or large inter-variation of the dairy cows. Milk production was found to be the direct influencing factor that was most significant in the path analysis. Igs concentration decreased with elevated milk production which probably resulted from the dilution effect of milk production (Caffin et al. Reference Caffin, Poutrel and Rainard1983). These workers thought that level of milk yield acted as a dilution factor, so at the end of lactation, higher concentrations of IgG might be expected. Variation of IgM concentrations in this study also supported this hypothesis.
For the cows selected (no mastitis for 2 months) in this study, the cows with higher SCS had the higher IgA and IgM concentrations. Since elevated SCS was related to decreased milk production, some researchers believed that SCS had an association with IgA and IgM concentrations indirectly through the change of milk production (Lindmark-Månsson et al. Reference Hagiwara, Kawai, Anri and Nagahata2000; Sharif & Muhammad, Reference Sharif and Muhammad2008). However, we found based on path analysis that SCS was the significant direct, not just indirect, factor associated with both IgA and IgM concentrations. SCS has been used as an index for evaluating health status of the udder and milk quality, and also as a selection criterion for mastitis resistance in dairy cattle (Philipsson et al. Reference Philipsson, Ral and Berglund1995; Suriyasathaporn et al. Reference Suriyasathaporn, Schukken, Nielen and Brand2000). Some somatic cells such as lymphocytes accumulating in mammary gland play an important role in controlling the immune response and produce many different antibodies (Sharif & Muhammad, Reference Sharif and Muhammad2008). Furthermore, increased vascular permeability allows more antibodies to pass into milk. Others believe mammary gland cells are injured and broken during elevated SCS, so causing many antibodies to be released into milk (Schallibaum, Reference Schallibaum2001). The high correlations between IgA and IgM concentrations and SCS might possibly be used as a complementary test for SCS and possibly as a diagnostic test for subclinical mastitis in dairy cattle.
Among milk components, only milk protein and lactose were found to be correlated with IgM and IgA concentrations, respectively. Direct action of milk protein on IgM concentration was significant (P<0·05), indicating that milk protein could also be related to IgM concentrations. Path analysis demonstrated that all factors assessed in this study accounted for 36·0% and 49·4% of the change of IgA and IgM concentrations in milk, indicating that parameters measured in this study were not sufficient to fully explain variability in IgA and IgM concentrations. Milk IgA and IgM concentrations may be influenced by Ig receptors and hormones as well as age, parity, breed, nutritional status and stage of lactation. More and more research is focusing on epithelial polymeric Ig receptor (pIgR) which mediates IgA and IgM transcytosis through mammary gland cells (Mostov & Kaetzel, Reference Mostov, Kaetzel, Ogra, Mestecky, Lamn, Strober, Bienenstock and McGhee1999; Kumura et al. Reference Kumura, Sone, Shimazaki and Kobayashi2000) and secretion into the lumen (De Groot et al. Reference De Groot, Van Kuik-Romeijn, Lee and De Boer2000). Therefore, further studies are still needed to more fully understand factors associating with IgA and IgM in milk. Our laboratory is now assessing what associations may exist between IgA concentration and transport with gene heliotypes and mRNA expression of pIgR in the mammary gland.
This work was partly supported by National Natural Science Foundation of China (30871837), Beijing Municipal Natural Science Foundation (6092017) and National International Cooperation Program (2009DFB30530), P. R. China.