1. Introduction
There is mounting empirical evidence linking environmental degradation emanating from agricultural production intensification by farmer-households to the decline in agricultural productivity, concomitantly putting the sustainable development and poverty reduction goals in grievous jeopardy (Barbier and Hochard, Reference Barbier and Hochard2018; Mirzabaev et al., Reference Mirzabaev, Strokov and Krasilnikov2023). If current land degradation trends continue, Africa could lose 50 per cent of its usable cultivated area by 2050 (IOM and UNCCD, 2019). Although sustainable land management practices (SLMPs) generate long-term benefits for farmers (Kassie et al., Reference Kassie, Teklewold, Jaleta, Marenya and Erenstein2015), adoption remains low, so land degradation and soil erosion persist (Di Falco and Bulte, Reference Di Falco and Bulte2013; Abdulai and Huffman, Reference Abdulai and Huffman2014; Wossen et al., Reference Wossen, Berger and Di Falco2015). Abdulai and Huffman (Reference Abdulai and Huffman2014) suggest this may stem from resource and information constraints, while Wossen et al. (Reference Wossen, Berger and Di Falco2015) note that research on SLMP adoption focuses mainly on economic incentives and overlooks the role of social support in filling these gaps (McCarthy et al., Reference McCarthy, Kilic, Brubaker, Murray and De La Fuente2021; Kairiza et al., Reference Kairiza, Kembo, Magadzire and Chigusiwa2023). This oversight is particularly relevant in developing countries where formal financial and insurance markets are often incomplete (Di Falco and Bulte, Reference Di Falco and Bulte2011).
This study examines how social support systems promote SLMP adoption in resource-constrained settings with weak formal institutions. Defining social support is complicated by contextual variation (Baycan and Öner, Reference Baycan and Öner2023). In institutionally dense, developed contexts, it typically refers to voluntary associations, social trust and reciprocal networks (Woolcock and Narayan, Reference Woolcock and Narayan2000; Lin et al., Reference Lin, Cook and Burt2017). In settings with weak formal institutions, it emphasizes kinship and obligatory familial ties, where support stems from cultural norms and community expectations rather than immediate reciprocity (Baycan and Öner, Reference Baycan and Öner2023; Kairiza et al., Reference Kairiza, Kembo, Magadzire and Chigusiwa2023).
This study operationalizes social connection through two proxies: local relatives support (LRS), capturing kinship-based, obligation-driven support, and membership in informal credit and savings groups (IGM), capturing voluntary, reciprocity-based support. Using these measures, we identify the latent social mechanisms linking farmer-households to their communities around shared goals like sustainable land management. The objective is to determine whether LRS or IGM plays a stronger role in promoting SLMP adoption.
The dependent variable is the number of soil conservation practices adopted by the farmer-household out of five possible practices: (i) minimum tillage, (ii) contour ridges or contour planting, (iii) planting of fodder trees, (iv) watershed management or protection and (v) sustainable harvesting of forest products. The selection of these practices is informed by those promoted under Zimbabwe’s Land Degradation projects supported by the United Nations Small Grants Programme (UNDP, 2022).
We examine how social support affects the number of SLMPs adopted by farmer-households, using three nationally representative cross-sectional surveys from Zimbabwe’s Vulnerability Assessment Committee covering 2021–2023. Identifying this effect is complicated by two issues: self-selection into social support networks, which biases ordinary least squares (OLS) estimates (Di Falco and Bulte, Reference Di Falco and Bulte2013; Wossen et al., Reference Wossen, Berger and Di Falco2015), and the count nature of the dependent variable. We address these challenges using Hasebe’s (Reference Hasebe2020) endogenous switching model (ESM) with a count outcome (ESC), applied previously in Ma et al. (Reference Ma, Vatsa, Zheng and Guo2022) and Kairiza et al. (Reference Kairiza, Pallegedara and Chigusiwa2024). Unlike standard endogenous switching or propensity score matching (PSM), ESC simultaneously corrects for selection bias from observed and unobserved factors and models the count nature of SLMP adoption. This yields more robust estimates of the treatment effects of social support.
Our findings show that self-sufficient households are more likely to access IGM support and less likely to rely on LRS, and that spatial proximity to supported neighbours increases a household’s own access to support. Social support increases SLMP adoption, and households without it would have adopted more practices had they received it. IGM, as self-enforcing support based on mutual reciprocity, has a stronger effect on adoption than LRS, which depends on relatives’ benevolence. This suggests policy should expand access to self-enforcing social support to improve SLMP uptake among rural households.
The rest of the paper is organized as follows. Section 2 briefly explains the Zimbabwean context of environmental degradation and conservation efforts. Section 3 provides a discussion of our data and the estimation techniques we use in the study, while Section 4 gives a discussion of the empirical results. Section 5 highlights the main conclusions and policy implications of the study.
2. Background and literature review
2.1. Background: environmental, agricultural and institutional settings in Zimbabwe
Zimbabwe is a signatory to the UN 2030 agenda and its three land-focused conventions: the United Nations Convention to Combat Desertification, the United Nations Convention on Biological Diversity and the United Nations Framework Convention on Climate Change (Nyandiga and Currea, Reference Nyandiga and Currea2017). Land is critical for rural, rain-fed-dependent populations, which is why the UN targets agriculture-dependent regions, especially Africa, for sustainable land management projects (UNDP, 2022). In Zimbabwe, the UN Small Grants Programme has supported Land Degradation projects, covering conservation farming, genetic diversity conservation and water harvesting. Specific practices include reduced tillage, diversified cropping, fodder trees, organic agriculture, contour ridges and watershed protection. Yet few independent, large-scale studies have evaluated what drives adoption of these initiatives in contexts like Zimbabwe.
Agriculture underpins Zimbabwe’s economy, supporting 70 per cent of the population for their livelihoods (World Bank, 2023). The rural population, which accounts for 67.6 per cent of the country’s total population (World Bank, 2023), is especially vulnerable to agricultural shocks. More than 80 per cent of rural households rely on rain-fed agriculture (GOZ, GCF and UNDP, 2023). Productivity is constrained by semi-arid conditions affecting 75 per cent of the land area (Hachigonta et al., Reference Hachigonta, Nelson, Thomas and Sibanda2013), leading to crop failures in three out of five years. Intensifying droughts (Chigusiwa et al., Reference Chigusiwa, Kembo and Kairiza2023; Kairiza et al., Reference Kairiza, Pallegedara and Chigusiwa2024, Reference Kairiza, Kembo and Chigusiwa2025) and population growth on limited land (Jayne et al., Reference Jayne, Chamberlin and Headey2014) have driven a rise in unsustainable land use in Zimbabwe. Practices like overgrazing, heavy chemical use and synthetic fertilizers have degraded soil health, increased erosion, reduced biodiversity, accelerated desertification and heightened food insecurity among the rural poor.
Zimbabwe, among other sub-Saharan countries, faces disproportionately high land degradation risk, with severe consequences for the population. About 10 per cent of soils are at high erosion risk due to their sodic nature, and deforestation averages 313,000 hectares annually, the highest rate in southern Africa (Nyandiga and Currea, Reference Nyandiga and Currea2017). Growing population pressure on scarce land disproportionately affects vulnerable groups like low-income households and women with limited land titles, underscoring the need for more efficient land use. Institutional and policy support for sustainable land management remains inadequate and ineffective across sub-Saharan Africa, including Zimbabwe (Bah and Kossivi, Reference Bah and Kossivi2025). This gap perpetuates underdevelopment and makes social networks essential for survival, especially among rural farming households.
2.2. Literature review
Farmer-households face rising productivity losses from climate change and population pressure, making adoption of adaptive strategies like SLMPs increasingly urgent. Climate change increases the frequency and severity of extreme weather: higher temperatures, altered rainfall and prolonged droughts (Chigusiwa et al., Reference Chigusiwa, Kembo and Kairiza2023; Kairiza et al., Reference Kairiza, Pallegedara and Chigusiwa2024, Reference Kairiza, Kembo and Chigusiwa2025), which amplifies covariate shocks across farming communities. At the same time, growing population density strains limited land, eroding soil fertility (Jayne et al., Reference Jayne, Chamberlin and Headey2014), while non-catastrophic climate change events decrease productivity (Kind et al., Reference Kind, Botzen and Aerts2020). These pressures disproportionately affect low-income households, heightening exposure to both covariate and idiosyncratic shocks. While social support systems like food sharing can buffer idiosyncratic shocks, they are less effective against covariate shocks. The role of such local support in promoting adoption of adaptive strategies like SLMPs to build resilience against both types of shocks remains underexplored.
SLMPs can help farmer-households manage both idiosyncratic and covariate shocks by raising individual productivity and, through better-managed land, boosting collective output at the community level. Evidence supports this: communities in Ethiopia practising sustainable land and watershed management before 2002 had 24 per cent higher production value seven years later (Schmidt and Tadesse, Reference Schmidt and Tadesse2014), and SLMP adoption in Malawi shielded households against drought and flood shocks (McCarthy et al., Reference McCarthy, Kilic, Brubaker, Murray and De La Fuente2021). Despite these benefits, adoption remains low because SLMPs require substantial resources (Abdulai and Huffman, Reference Abdulai and Huffman2014; McCarthy et al., Reference McCarthy, Kilic, Brubaker, Murray and De La Fuente2021). In Malawi, farmers with more productive assets are more likely to adopt them (McCarthy et al., Reference McCarthy, Kilic, Brubaker, Murray and De La Fuente2021). Where resources are scarce, the trade-off between short-term welfare and long-term agricultural investment likely constrains adoption.
When resources are limited and households lack the means to cope with shocks, they rely on social support to achieve self-sufficiency (Fluit et al., Reference Fluit, Bortolotti, Broekhuis and van Teerns2023). Modernist social support theories, such as those of Lin et al. (Reference Lin, Cook and Burt2017) and Woolcock and Narayan (Reference Woolcock and Narayan2000), trace support to social development and emphasize attributes like trust, norms and networks (Prandini, Reference Prandini2014). In contrast, in traditional or underdeveloped societies, family and kindred ties, bordered on civic duty, play a dominant role and cannot be overlooked (Di Falco and Bulte, Reference Di Falco and Bulte2011; Baycan and Öner, Reference Baycan and Öner2023).
Behavioural economics and cognitive neuroscience highlight how cognitive and emotional processes jointly shape decision-making in social contexts (Sanfey et al., Reference Sanfey, Rilling, Aronson, Nystrom and Cohen2003; Luo and Yu, Reference Luo and Yu2015). This distinction maps onto two forms of social support. In traditional societies, kinship-based systems act as ‘implicit insurance’, driven by emotional bonds and cultural obligations with indirect, long-term reciprocity (Di Falco and Bulte, Reference Di Falco and Bulte2011; Hoff and Sen, Reference Hoff, Sen, Bowles, Durlauf and Hoff2011; Baycan and Öner, Reference Baycan and Öner2023). By contrast, voluntary groups like informal savings associations operate on ‘calculated reciprocity’, where members make cognitive, forward-looking decisions based on expected mutual benefits and explicit or implicit contracts (Hoff and Sen, Reference Hoff, Sen, Bowles, Durlauf and Hoff2011; Ksoll et al., Reference Ksoll, Lilleør, Lønborg and Rasmussen2016; Kairiza et al., Reference Kairiza, Kembo, Magadzire and Chigusiwa2023). Consequently, resource-rich, future-oriented households tend to join such groups, while resource-constrained households with immediate needs rely more on familial support.
Because group membership is deliberate, participation in mutually beneficial activities like SLMP adoption tends to be self-enforcing. Unlike unconditional kinship support, groups such as IGMs create a structure for collective action with defined boundaries, collective-choice rules, and mechanisms for monitoring and graduated sanctions (Ostrom, Reference Ostrom2015). Members have a shared interest in enforcing norms, since defection, such as failing to maintain watersheds or overexploiting common resources, undermines both collective and individual benefits (Becchetti et al., Reference Becchetti, Castriota and Conzo2016; Kahsay and Bulte, Reference Kahsay and Bulte2024; Fang et al., Reference Fang, Jiang, Chen and Delgado2025). The threat of social sanctions, reputational loss and exclusion from credit incentivizes cooperation (Ksoll et al., Reference Ksoll, Lilleør, Lønborg and Rasmussen2016). IGMs also accelerate information diffusion, spreading sustainable farming practices through peer learning and demonstration effects (Wossen et al., Reference Wossen, Berger and Di Falco2015).
Empirical evidence supports this mechanism. Peer monitoring within forest user groups in Ethiopia increases effort in managing common property resources (Kahsay and Bulte, Reference Kahsay and Bulte2024), while compulsory sharing invites free riding (Di Falco and Bulte, Reference Di Falco and Bulte2013). Subjective satisfaction from group cooperation also improves adoption of mutually beneficial practices in common-pool resource settings (Becchetti et al., Reference Becchetti, Castriota and Conzo2016), and endogenous social effects shape technology adoption, such as clean fuel choices among rural households in China (Fang et al., Reference Fang, Jiang, Chen and Delgado2025).
In contrast, unconditional assistance from local relatives can reduce compliance with social norms, since recipients have no reputation to uphold and feel less obligated to reciprocate. Di Falco and Bulte (Reference Di Falco and Bulte2013) found that larger kinship networks in Ethiopia’s Nile basin significantly reduce adoption of soil and water conservation technologies, and Benin and Pender (Reference Benin and Pender2006) show that heterogeneity within social groups undermines collective action in grazing land management. This suggests households relying on kinship support are less likely to adopt SLMPs at the community level than those in voluntary, self-enforcing, mutually reciprocal groups.
These findings suggest households rely on distinct forms of support depending on their resources and social capital. Households with sufficient resources tend to take a proactive, cognitive approach, joining mutual assistance groups to mitigate shocks strategically. Those with limited resources and reciprocation capacity rely more on familial support, effectively drawing on an unofficial ‘family tax’.
3. Farmer-household survey data descriptions and empirical strategy
3.1. Data
We use data emanating from three nationally representative pools of annual cross-sectional surveys of rural households collected by the Zimbabwe Vulnerability Assessment Committee from 2021 to 2023. For each round, the sampling frame covered all 60 rural districts of the country and applied 2-stage stratified random sampling to select a target sample of 15,000 farmer-households for each annual cross-section. The total number of valid household interviews conducted for the three pooled surveys was 42,614; their annual distribution is given in Table 1.
Number of observations and adoption of SLMP

Table 1 Long description
The table reports survey sample sizes by year and the share of respondents adopting different counts of sustainable land management practices, plus adoption rates for five specific practices, for 2021 to 2023 and overall. The sample is evenly split across years: 13,759 in 2021 (32.3%), 14,130 in 2022 (33.2%), and 14,725 in 2023 (34.6%), totaling 42,614. The distribution of how many practices were adopted shifts over time: adopting none falls from 0.591 in 2021 to 0.458 in 2022 and 0.227 in 2023, while adopting one rises from 0.237 to 0.404 to 0.571. Adoption of two practices stays relatively stable (0.117, 0.116, 0.161), and three or more practices remain uncommon in every year (each category at or below 0.032 in 2021 and at or below 0.030 in 2023). For specific practices, minimum tillage increases from 0.226 in 2021 to 0.393 in 2022 and 0.478 in 2023, and contour ridges rise from 0.265 to 0.229 to 0.389. Planting fodder trees remains low (0.042, 0.026, 0.054), as do watershed management or protection (0.073, 0.035, 0.048) and sustainable harvesting of forest products (0.078, 0.026, 0.060). Values in parentheses are standard errors for the reported estimates, except where the table reports percentages.
Note: Values in parentheses, except for percentages, are standard errors.
3.2. Description of key variables
3.2.1. Number of SLMPs practised by farmer-households
Our dependent variable is the number of SLMPs practised by farmer-households in the year leading up to the survey. The variable is measured by counting the number of SLMPs practised by the farmer-household out of the following five practices: (i) Minimum tillage, (ii) Contour ridges/contour planting, (iii) Planting of fodder trees, (iv) Management or protection of the watershed and (v) Sustainable harvesting of forest products. Our variable,  ${\text{SLM}}{{\text{P}}_i} \in {\mathbb{Z}_ + }$, such that
 ${\mathbb{Z}_ + } = 0, \ldots ,5$.
3.2.2. Measures of social support
We measure the farmer-household’s social support, 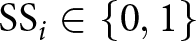 ${\text{S}}{{\text{S}}_i} \in \left\{ {0,1} \right\}$, using two binary proxies, namely LRS and IGM. The first proxy is derived from the question: ‘Did your household receive any support in the year leading up to the survey from local relatives?’ Based on that question, the variable,
 ${\text{S}}{{\text{S}}_i}$, takes the value of 1 if the farmer-household answered in the affirmative and 0 otherwise. The second proxy variable for social support is based on the question: ‘Does your household contain a person who is a member of a local informal savings and credit association?’
 ${\text{S}}{{\text{S}}_i}$ again takes the value of 1 if the farmer-household answered in the affirmative and 0 otherwise. Informal savings and credit associations in Africa provide more than financial services; they offer flexible, family-prioritized membership and standardized governance that extends to broader social activities (Ksoll et al., Reference Ksoll, Lilleør, Lønborg and Rasmussen2016). We therefore focus on local measures of social support, such as assistance from local relatives and membership in local informal groups, rather than broader networks. Local ties give households both a stronger stake in local environmental outcomes and the ability to monitor and enforce behaviour, reinforcing positive practices and deterring harmful ones in SLMP adoption.
3.2.3. Household’s peers who receive social support
For each household, i,  ${P_i}$, is the distance-weighted number of neighbours,
 $j$, within household
 $i$’s 10 km radius whose
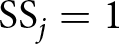 ${\text{S}}{{\text{S}}_j} = 1$. We utilized the GPS coordinates of the households to calculate the distances between household
 $i$ and all the households whose
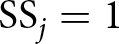 ${\text{S}}{{\text{S}}_j} = 1$. Therefore, for each household
 $i$,
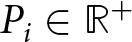 ${P_i} \in {\mathbb{R}^ + }$.
 ${P_i}$ is necessary for identifying the ESC model (Hasebe, Reference Hasebe2020).
3.3. Econometric framework and estimation strategy
3.3.1. Model selection
Estimation of the effects of social support on the number of SLMPs practised by farmer-households is confounded by self-selection associated with receiving social support, which is influenced by both observed and unobserved confounders (Di Falco and Bulte, Reference Di Falco and Bulte2013; Wossen et al., Reference Wossen, Berger and Di Falco2015). Previous studies estimating the impact of binary treatment variables using observational data have employed various methods, including PSM (Abadie and Imbens, Reference Abadie and Imbens2016), the Inverse Probability Weighted Regression Adjustment estimator (Chigusiwa et al., Reference Chigusiwa, Kembo and Kairiza2023; Zheng and Ma, Reference Zheng and Ma2023) and the ESM (Hasebe, Reference Hasebe2020; Ma et al., Reference Ma, Vatsa, Zheng and Guo2022). We use the ESM as our primary approach because it addresses self-selection bias from both observed and unobserved factors, producing unbiased estimates of social support’s impact on SLMP adoption. The ESM jointly estimates one selection equation for receiving social support and two outcome equations for SLMP adoption (one for adopters and one for non-adopters) under a maximum likelihood framework that assumes lognormal latent heterogeneity between the treatment and outcome models.
The estimation of the impact of social support on the number of SLMPs practised by the households is further complicated by the count nature of our dependent variable, which necessitates approaches that consider variations in count-dependent variables (Hasebe, Reference Hasebe2020; Ma et al., Reference Ma, Vatsa, Zheng and Guo2022). We therefore resort to Hasebe’s (Reference Hasebe2020) ESC.
3.3.2. ESC model
In our case, the ESC uses conditional expectations to construct a hypothetical case of SLMP users had they not received social support and compares it with the actual case to provide self-selection corrected estimates of receiving social support on SLMP adoption. Using maximum likelihood estimation, ESC simultaneously estimates one selection equation (which determines receiving social support by farmer-households) and two outcome equations for those with 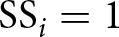 ${\text{S}}{{\text{S}}_i} = 1$ (Regime 1) and
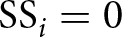 ${\text{S}}{{\text{S}}_i} = 0$ (Regime 2) as follows:
 \begin{equation}{\text{Selection equation:}}\,\,\Pr \left( {\text{SS}_i = 1 / X,P} \right) = \alpha + \lambda {P_i} + X_i^ / \gamma + {\varepsilon _i}\end{equation}
 \begin{equation}{\text{Regime 1:}}\,\,\text{SLMP}_{1i} = X_i^ / {\beta _{1i}} + {\eta _{1i}}\quad ({\text{if }}\text{SS}{_i} = 1)\end{equation}
 \begin{equation}{\text{Regime 2:}}\,\text{SLMP}_{0i} = X_i^ / {\beta _{0i}} + {\eta _{0i}}\quad ({\text{if }}\text{SS}{_i} = 0)\end{equation}
where 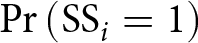 ${\text{Pr}}\left( {{\text{S}}{{\text{S}}_i} = 1} \right)$ represents the probability that the household receives social support and
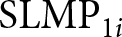 ${\text{SLM}}{{\text{P}}_{1i}}$ and
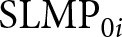 ${\text{SLM}}{{\text{P}}_{0i}}$ represent the
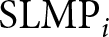 ${\text{SLM}}{{\text{P}}_i}$ in instances when
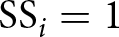 ${\text{S}}{{\text{S}}_i} = 1$ and
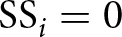 ${\text{S}}{{\text{S}}_i} = 0$, respectively.
 $X\,$is a vector of control variables that affects both selection and outcomes.
 ${P_i}$ is the distance-weighted number of neighbouring households receiving social support within a 10 km radius, used as the exclusion restriction for identification. Following Manda et al. (Reference Manda, Alene, Tufa, Abdoulaye, Wossen, Chikoye and Manyong2019), the selection equation requires an instrument excluded from the outcome equation. We chose 10 km based on evidence that it reflects a common daily walking distance in rural Zimbabwe for accessing services like healthcare (Mangundu et al., Reference Mangundu, Roets and Janse van Rensburg2023) and aligns with average school travel distances of 8.9–13.2 km reported by ZIMCODD (2024). Sensitivity tests at 5 and 15 km yielded consistent results.
The exclusion restriction isolates variation in neighbours’ social support to affect a household’s own support reception, but not direct SLMP adoption. SLMPs can be costly due to higher labour, infrastructure investment and short-term yield losses (Gebremikael et al., Reference Gebremikael, Hassan, Endris and Aweke2025). Households observe neighbours receiving support that eases these costs, which motivates their own demand for support through information flow, social pressure and shared norms, i.e., Manski (Reference Manski1993), endogenous social effects. Neighbours’ support does not directly compel SLMP adoption, since no enforceable social contract exists unless the household itself receives support. Thus,  ${P_i}$ influences SLMP adoption only indirectly, via its effect on the household’s likelihood of receiving support.
The validity of our instrument is supported by a simple falsification test following Di Falco et al. (Reference Di Falco, Veronesi and Yesuf2011). Specifically, when the number of SLMPs adopted is regressed on the full set of control variables  $\left( X \right)$, including our instrument
 ${P_i}$, the coefficient on
 ${P_i}$ is statistically insignificant
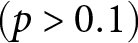 $\left( {p{\text{\ \gt \ }}0.1} \right)$. This suggests that, after controlling for household characteristics, the number of neighbours receiving social support has no direct, independent effect on SLMP adoption, thereby supporting its validity as an exclusion restriction.
 ${\varepsilon _i},\,{\eta _{1i}},\,{\text{and}}\,{\eta _{0i}}$ are error terms.
 $\alpha ,\,\lambda ,\,\gamma ,\,{\beta _{1i}}\,{\text{and}}\,{\beta _{0i}}\,$are parameters to be estimated. Because SLMP adoption is a count variable ranging from 0 to 5, and thus has a low mean and variance, we estimate Equations (2a) and (2b) using a Poisson model and report results in Section 4.2.1. Following Hasebe (Reference Hasebe2020), the Poisson distribution is used within the ESC framework for its robustness to misspecification; it yields consistent treatment effects even if the data are not truly Poisson, unlike the Negative Binomial, which is sensitive to distribution assumptions. It also allows straightforward maximum likelihood estimation with lognormal latent heterogeneity to capture unobserved factors in self-selected treatment contexts.
After estimating the parameter vectors $,\,\lambda ,\,\gamma ,\,{\beta _{1i}}\,{\text{and}}\,{\beta _{0i}}$, we calculate the treatment effects of social support on the number of SLMPs practised by farmer-households in rural Zimbabwe. Specifically, following Hasebe (Reference Hasebe2020), we estimate the average treatment effects in the total population,
 ${\mu _{{\text{ATE}}}}$, and the marginal treatment effect in the subpopulation that received the treatment and the subpopulation that did not,
 ${\mu _{{\text{ATT}}}}$ and
 ${\mu _{{\text{ATU}}}}$, respectively, as follows:
 \begin{equation*}{\mu _{{\text{ATE}}}} = E\left[ {{\text{SLM}}{{\text{P}}_1} - {\text{SLM}}{{\text{P}}_0} / X} \right],\end{equation*}
 \begin{equation*}{\mu _{{\text{ATT}}}} = E\left[ {{\text{SLM}}{{\text{P}}_1} - {\text{SLM}}{{\text{P}}_0} / X,{\text{S}}{{\text{S}}_i} = 1} \right],\end{equation*}
 \begin{equation*}{\mu _{{\text{ATU}}}} = E\left[ {{\text{SLM}}{{\text{P}}_1} - {\text{SLM}}{{\text{P}}_0} / X,{\text{S}}{{\text{S}}_i} = 0} \right].\end{equation*}
We present the results in Section 4.2.3. We also perform robustness checks using the PSM method and reveal that qualitatively, the PSM results reported in Supplementary Appendix Table A1 are the same as the ESM results in Section 4.2.3.
4. Results and discussion
4.1. Descriptive analysis
4.1.1. Sample observations
Table 1 shows that the total number of pooled farmer-households is 42,614, with the respective annual contributions being 13,759, 14,130 and 14,725 for 2021, 2022 and 2023, respectively. The table shows that, on average, the number of farmer-households that do not practice SLMPs is 42.1 per cent. This finding is consistent with earlier studies, which argue that many farmer-households are yet to adopt SLPMs (Di Falco and Bulte, Reference Di Falco and Bulte2013; Abdulai and Huffman, Reference Abdulai and Huffman2014; Wossen et al., Reference Wossen, Berger and Di Falco2015). The annual distribution of farmer-households not practising SLMPs reveals a declining trend over the three years. Specifically, the proportion of non-adopting households decreased from 59.1 per cent in 2021 to 45.8 per cent in 2022 and further to 22.7 per cent in 2023.
The lower panel of Table 1 shows the specific SLMPs adopted by farmer-households each year. The table shows that the adoption of Minimum tillage has been increasing over the years, with a total increase of 111.5 per cent between 2021 and 2023. Meanwhile, for all the other practices, adoption dipped from 2021 to 2022, but peaked again in 2023. The panel also shows that Minimum tillage has the highest adoption rate (37 per cent), while Planting of fodder trees has the lowest (4.1 per cent) on average. Our analysis of this result reveals that labour-saving technologies, such as minimum tillage, have the highest adoption rate and remain consistently popular among farmer-households, whereas technologies with the highest potential for free riding are the least popular. Research by Herrendorf et al. (Reference Herrendorf, Herrington and Valentinyi2015) and Gallardo and Sauer (Reference Gallardo and Sauer2018) supports this, showing that labour-augmenting technologies are adopted more quickly in agriculture than in other sectors.
SLMP adoption rose notably between 2021 and 2023, with non-adopters falling from 59.1 to 22.7 per cent. This likely reflects post-COVID agricultural recovery efforts by government and NGOs, expanded extension messaging on conservation agriculture and better rainfall in 2023 after earlier droughts. Households may also have sought greater self-sufficiency as COVID-19 weakened both formal and informal support systems. To isolate the effect of social support from these broader trends, our models include year fixed effects for 2021, 2022 and 2023.
4.1.2. Background characteristics by social support status
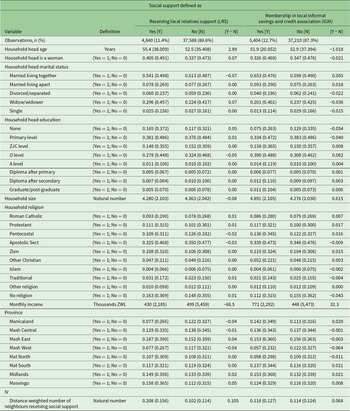
Table 2 shows the background characteristics of our sample, categorized by social support status, using the two social support measures adopted in this study. The table shows that 11.4 and 12.7 per cent of the rural farmer-households receive social support when it is defined as LRS and IGM, respectively. Table 2 also shows that households that receive social support differ in many aspects from those that do not receive social support. Specifically, households that receive social support live closer to a circle of neighbours who also receive social support.
Background characteristics by social support status

Table 2 Long description
The table compares household background characteristics across two social support measures: receiving support from local relatives and belonging to a local informal savings and credit group, each split into yes and no groups with a reported difference in means. For local relatives support, households are older on average (about 55 years versus 53), more likely to be female-headed (about 41 per cent versus 34 per cent), and more often widowed (about 30 per cent versus 22 per cent), with slightly lower monthly income (about 430 thousand ZWL versus 499 thousand ZWL). Education patterns for local relatives support show a higher share with no schooling and a lower share with O level compared with those without this support. For savings-group membership, households are larger (about 4.9 people versus 4.3) and have higher monthly income (about 771 thousand ZWL versus 448 thousand ZWL), and they are more often married living together (about 65 per cent versus 60 per cent). Savings-group members also have a higher share with O level education and a lower share with no schooling than non-members. Religious composition is broadly similar across groups, with small shifts such as slightly fewer reporting no religion among savings-group members. Provincial shares vary by support type, including lower representation of Manicaland and Mashonaland West among local relatives support recipients, and higher Manicaland representation among savings-group members. The instrument-related measure, distance-weighted neighbors receiving support, is higher among local relatives support recipients than non-recipients, while differences are small for savings-group membership. Values are means with standard deviations, and the reported differences come from two-tailed tests, so they describe associations rather than causal effects.
Notes: Standard deviations in parentheses. Total sample size is 42,614. The third and final columns show the results of the two-tailed t-test for the difference in the means. Defining Education: ZJC means Zimbabwe Junior Certificate, O level means Ordinary level and A level means Advanced level.
Table 2 also shows that, before controlling for confounders, the household profiles linked to LRS and IGM support differ sharply. LRS recipients are more likely to be headed by those who are older, female, widowed and have no formal education. IGM recipients tend to be headed by those who are younger, male, married, have higher income and have at least basic education. This suggests LRS support often stems from benevolence or emotional attachment, while IGM support reflects a proactive drive for self-resilience among more energetic, informed and resourced households.
The disparities in household characteristics between recipients and non-recipients of social support suggest self-selection bias, which can lead to biased OLS estimates of the impact of social support on the adoption of SLMPs, justifying the use of ESC.
4.1.3. Number of SLMPs adopted by social support status
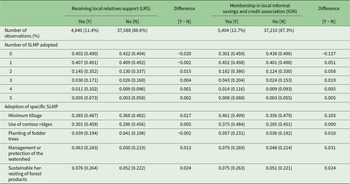
Table 3 shows that SLMP adoption varies significantly by social support status. Non-recipients of both LRS and IGM are more likely to adopt no SLMPs, but the effect is stronger for IGM non-recipients, who are 13.7 per cent less likely to adopt versus 2 per cent for LRS non-recipients. Households receiving IGM are also more likely to adopt all five SLMPs (sixth column), while LRS recipients tend to adopt either 2 or 5 practices (third column). This tentatively supports the hypothesis that social support, especially IGM, increases SLMP adoption.
SLMP adoption by social support status

Table 3 Long description
The table compares SLMP adoption outcomes by two social support indicators: receiving local relatives support and membership in a local informal savings and credit association. For each indicator, it reports group sample shares and the mean share of households adopting zero through five SLMP, plus adoption rates for five specific practices. Local relatives support shows minimal differences: adopting none is about 0.40 for those with support versus 0.42 without, and most other adoption-count differences are near zero. In contrast, association members are less likely to adopt none (0.30 versus 0.44) and more likely to adopt one (0.45 versus 0.40) or two practices (0.18 versus 0.12). For specific practices, association members have higher adoption of minimum tillage (0.46 versus 0.36) and contour ridges (0.38 versus 0.29), with smaller increases for watershed management (0.08 versus 0.05) and sustainable forest harvesting (0.08 versus 0.05). Planting fodder trees is low in all groups, with a slight increase among association members (0.06 versus 0.04) and little difference by relatives support. Values are means with standard deviations shown in parentheses, and the reported differences reflect simple mean comparisons rather than causal effects.
Notes: Standard deviations in parentheses. Total sample size is 42,614. The third and final columns show the results of a two-tailed t-test for the difference in the means.
The bottom panel of Table 3 shows the specific SLMPs adopted, categorized by social support status. The panel shows that access to IGM increases the likelihood of adopting all five SLMPs, with the most likely being Minimum tillage (10.5 per cent), while the least is Planting of fodder trees (1.8 per cent). In contrast, access to LRS increases the likelihood of three out of the five technologies, namely Minimum tillage (1.7 per cent), Management or protection of the watershed (1.3 per cent) and Sustainable harvesting of forest products (2.4 per cent). Our analysis suggests LRS is linked to the adoption of low-labour-intensity technologies where free-riding is difficult. For example, households must clear watersheds crossing their fields a few times a year; failure to do so causes flooding and direct yield losses.
4.2. Empirical findings
4.2.1. Determinants of farmer-households’ social support
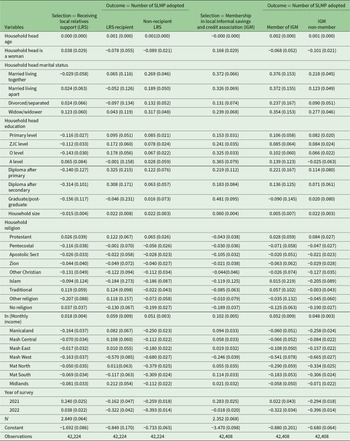
Results from the ESC regression are presented in Table 4. An Efficient estimator to fit the ESC model is the maximum likelihood estimator (Hasebe, Reference Hasebe2020). Using the stated method, we jointly estimate the selection Equation (1) and the two outcome Equations (2a) and (2b) to yield consistent estimates. The first stage of the estimation of ESC produces the selection equation results presented in the first and fourth columns of Table 4. The results from the second stage of estimation, whereby we produce estimates for the two outcome equations, are presented in the second and third columns when social support is measured as LRS, and in the fifth and sixth columns when social support is measured as IGM.
Determinants of social support and the number of SLMPs adopted: ESC model estimates

Table 4 Long description
The table reports ESC model coefficient estimates (with standard errors) for two selection processes and their associated outcomes: receiving support from local relatives and belonging to an informal savings and credit group, each paired with the number of SLMPs adopted. For both selection settings, monthly income is consistently positive for SLMP adoption, indicating that higher income is associated with adopting more SLMPs for recipients and non-recipients, and for group members and non-members. Household size is also positively related to SLMP adoption in all outcome columns, with the largest positive association among local-relatives-support recipients. Gender shows mixed patterns: female-headed households are associated with higher SLMP adoption among local-relatives-support recipients and among savings-group members, but lower adoption among non-recipients and non-members. Compared with the reference province, Mash West has the strongest negative association with SLMP adoption in both outcome models, and several other provinces also show negative associations, especially in the savings-group outcome. Year indicators suggest earlier survey years are associated with lower SLMP adoption than the reference year, particularly for 2022 in both outcome models. Education and religion coefficients vary by category and model, so differences should be interpreted relative to their stated reference groups and with attention to the reported uncertainty.
Notes: Standard errors in parentheses. The reference marital status is single, the reference education is no education, the reference religion is Roman Catholic, the reference province is Masvingo and the reference year of survey is 2023. Defining Education: ZJC means Zimbabwe Junior Certificate, O level means Ordinary level and A level means Advanced level.
Results in the fourth column show that households headed by currently or previously married heads are more likely to receive social support as IGM vis-à-vis those headed by single heads. On the other hand, the first column shows that only households that are headed by widows or widowers are more likely to receive social support as LRS, compared to those headed by single heads. This finding affirms our proposition that social support as LRS is primarily driven by emotional constraints, guided by compassion (Di Falco and Bulte, Reference Di Falco and Bulte2011; Hoff and Sen, Reference Hoff, Sen, Bowles, Durlauf and Hoff2011; Baycan and Öner, Reference Baycan and Öner2023).
The fourth column of Table 4 also shows a highly statistically significant effect of higher education levels on the likelihood of farmer-households receiving social support as IGM, relative to no education. On the other hand, the first column shows that education, particularly lower levels of education (Primary level, ZJC and O Level), reduces the likelihood of receiving social support as LRS compared to no education. These results confirm our proposition that group membership is influenced more by cognitive constraints, which are correlated to education levels, stemming from voluntary participation and expectations of mutual reciprocity (Di Falco and Bulte, Reference Di Falco and Bulte2011; Hoff and Sen, Reference Hoff, Sen, Bowles, Durlauf and Hoff2011; Baycan and Öner, Reference Baycan and Öner2023).
Although an increase in household income increases the likelihood of the farmer-household receiving both forms of social support, the increase in LRS due to a marginal increase in income can be attributed to the fact that rural households in Zimbabwe operate on extremely low incomes, with average monthly incomes ranging from US$75 in 2021 to US$116 in 2023 for households with an average size of four to five members (ZimVAC, 2021, 2023). Thus, a marginal increase in income for the poorest majority does not significantly elevate their income status, leaving them still reliant on assistance from relatives. It is also evident from the first and fourth columns that bigger household sizes, which we consider to be reservoirs of labour for highly labour-intensive agriculture, significantly increase the likelihood of a farmer-household receiving social support as IGM and reduce the likelihood of LRS. These results support our earlier conjecture that self-sufficient farmer-households tend to avoid LRS, which relies on compassion and benevolence. Instead, they opt for IGM, where they strategically connect with like-minded households to share risks and provide mutual support.
Lastly, the coefficient of the distance-weighted number of neighbours that receive social support, which is our identification restriction, is positive and statistically significant at the 1 per cent level of significance in both the first and the fourth columns. This suggests that spatial proximity to farmer-households that receive social support is related to the probability that the farmer-household also receives social support. These findings are consistent with earlier studies, such as Kairiza et al. (Reference Kairiza, Kembo, Magadzire and Chigusiwa2023) and Woolcock and Narayan (Reference Woolcock and Narayan2000), which found that families sharing the same social and economic relations tend to live near each other.
4.2.2. Determinants of the number of SLMPs practised by farmer-households
In this section, we focus on the second-stage results obtained using Poisson regression models. The second and third columns of Table 4 show the outcome equations for farmer-households that receive social support and those that do not when the measure of social support is receiving LRS. On the other hand, the fifth and sixth columns show the outcome equations for farmer-households that receive social support and those that do not when the measure of social support is IGM.
The results show that, compared to single-headed households, married or widowed/widower-headed households are more likely to adopt SLMPs if they receive IGM support, whereas LRS support only raises adoption among households without it. This suggests accountability, like marriage (current or past), fosters cooperation in community-benefiting activities, especially in voluntary risk-sharing groups. At the same time, the absence of unconditional LRS support also increases the likelihood of cooperation in adopting community-beneficial technologies. This finding suggests that while self-enforcing IGM support aids adoption of resilience-building practices like SLMPs where formal social security is weak, unconditional LRS creates indifference. This aligns with Baycan and Öner (Reference Baycan and Öner2023), who argue that there are contexts and geographies where some types of social support may produce detrimental effects on the collective well-being.
Notably, income is a key driver of SLMP adoption, significant at the 1 per cent level regardless of social support status, meaning the link between support and adoption holds across income levels. Household size shows a similar pattern: LRS presence, or absence of both LRS and IGM, increases adoption likelihood. This suggests financial and labour constraints limit adoption, consistent with Abdulai and Huffman (Reference Abdulai and Huffman2014) and McCarthy et al. (Reference McCarthy, Kilic, Brubaker, Murray and De La Fuente2021).
On the other hand, female-headed households appear to be more responsive to the absence of social support than their male counterparts in the adoption of SLMPs. Specifically, considering the subpopulation of farmer-households that do not receive social support (the third and sixth columns of Table 4). The third column indicates that, ceteris paribus, female-headed households that do not receive LRS are less likely to adopt an additional SLMP compared to male-headed households. Similarly, the sixth column reveals that female-headed households that do not receive IGM are less likely to adopt an additional SLMP than their male-headed counterparts. This suggests that lacking either form of social support has a stronger negative effect on SLMP adoption for female-headed households. While prior studies show that women cooperate more when they receive social support (Charness and Rustichini, Reference Charness and Rustichini2011; Kairiza et al., Reference Kairiza, Kembo, Magadzire and Chigusiwa2023), our finding that they are more affected by its absence in the context of socially beneficial technologies like SLMPs appears to be novel.
4.2.3. Treatment effects of social support on the number of SLMP adopted by farmer-households
To estimate the effect of social support on the number of SLMPs adopted, we compared actual adoption among recipients with the counterfactual, had they not received support. We calculate the above differences in the number of SLMPs adopted, conditional on the observable characteristics (ATE), receiving social support (ATT) and not receiving social support (ATU), and report the results in Table 5. ATE reveals the expected treatment effect for a random farmer-household drawn from the population, ATT shows the expected treatment effect for farmer-households that receive social support and ATU shows the expected treatment effect for farmer-households that do not receive social support. All three measures are consistent in magnitude and significance. Based on ATT, social support increases SLMP adoption by 7.0 per cent for LRS and 18.2 per cent for IGM, with a stronger effect for IGM. This aligns with Wossen et al. (Reference Wossen, Berger and Di Falco2015), who found that social support enhances adoption of improved land management practices in Ethiopia.
Treatment effects of social support on the number of SLMP adopted by the farmer-households: ESC model estimates

Table 5 Long description
The table reports estimated treatment effects of two types of social support on the number of SLMP adopted by farmer households. Social support is defined either as receiving support from local relatives or as membership in a local informal savings and credit association. For local relatives support, the average treatment effect is 0.084, the effect among those treated is 0.070, and the effect among those untreated is 0.086. For savings and credit association membership, the average treatment effect is 0.185, the effect among those treated is 0.182, and the effect among those untreated is 0.185. Across all three measures, membership in the savings and credit association shows roughly double the estimated impact compared with relatives support. Standard errors are small and similar across columns, indicating relatively precise estimates, but the values should still be interpreted as model-based associations rather than definitive proof of causality.
Notes: Sample size is 42,614. Values in parentheses are standard errors.
Our finding that IGM promotes SLMP adoption more effectively than LRS aligns with existing research. Kahsay and Bulte (Reference Kahsay and Bulte2024) showed that peer monitoring within Ethiopian forest user groups enhances common property resource management. Similarly, Becchetti et al. (Reference Becchetti, Castriota and Conzo2016) found that subjective satisfaction of social group cooperation improves adoption of mutually beneficial practices in common-pool resource management. In contrast, Di Falco and Bulte (Reference Di Falco and Bulte2013) found that having more local relatives available, providing compulsory/unconditional support, invites free riding and reduces the likelihood of adopting soil and water conservation technologies.
It is also worth noting that the estimated ATU of 8.6 and 18.5 per cent of the respective measures of social support on the number of SLMPs adopted by farmer-households indicate that, had the untreated self-selected into social support, they would have improved their adoption of SLMPs more than those that had social support.
4.2.4. Treatment effects of social support on the adoption of individual SLMPs
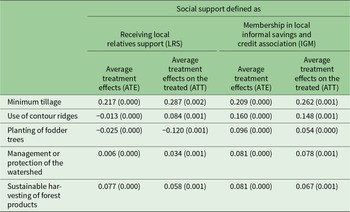
Table 6 shows the treatment effects of social support on the individual SLMPs adopted by farmer-households. Generally, the table reveals that, except for Minimum tillage, social support in the form of IGM is more effective in promoting the adoption of SLMPs than LRS, which agrees with the results in Section 4.2.3. The results also show a clear ordering of practice adoption among farmer-households, consistent with the preliminary findings in Section 4.1.3. Specifically, Minimum tillage is the most widely adopted practice, supported by both forms of social support, while Planting of fodder trees is the least popular. The anomaly where LRS outperforms IGM in supporting Minimum tillage adoption may stem from the technology’s labour-saving nature and potential to maximize private benefits through optimal utilization of private resources (Osewe et al., Reference Osewe, Mwungu and Liu2020).
Treatment effects of social support on the adoption of individual SLMP: ESC model estimates

Table 6 Long description
The table reports estimated treatment effects of two social support definitions on adoption of five individual sustainable land management practices, with results shown as average effects and effects among those treated. For receiving local relatives support, minimum tillage is strongly positive, with an average effect of 0.217 and a treated effect of 0.287. Under the same support, contour ridges and watershed management are near zero on average but positive among treated, while fodder tree planting is negative for both measures, especially among treated at minus 0.120. For membership in a local informal savings and credit association, all five practices show positive effects, led by minimum tillage with 0.209 on average and 0.262 among treated. Contour ridges also rise notably under association membership, with 0.160 on average and 0.148 among treated, contrasting with the near-zero average under relatives support. Sustainable harvesting and watershed management are modestly positive under both support types, generally larger for association membership than for relatives support. Standard errors are provided in parentheses, so small differences should be interpreted cautiously even when estimates appear precise.
Note: Standard errors in parentheses.
Unlike IGM, LRS appears to encourage self-interested behaviour that weakens collective action, consistent with Di Falco and Bulte’s (Reference Di Falco and Bulte2013) finding that compulsory sharing invites free riding. For labour-intensive practices like Contour ridges, LRS reduces adoption in the ATE, with only a marginal increase in the ATT. Both ATT and ATE results also show that LRS lowers adoption of non-excludable SLMPs such as Fodder trees. This suggests that unconditional support is linked to lower uptake of effort-intensive technologies and weaker community cooperation where benefits cannot be privatized.
5. Conclusions and policy recommendations
Using three pooled cross-sectional surveys of rural Zimbabwean farmer-households, we investigate the role of social support on SLMP adoption. We find that social support increases SLMP adoption. Specifically, households with higher income, larger size and more educated heads are more likely to receive support, as are those living near supported neighbours. Both ATEs and ATTs are positive and significant, showing that social support raises the number of SLMPs adopted. Counterfactual estimates for untreated households indicate they too would adopt more SLMPs if they received support.
Our findings suggest that social support can help close the information and resource gaps that constrain SLMP adoption in environmentally degraded areas of developing countries. Policies that encourage farmer participation in informal groups can expand access to knowledge, motivation and resources, thereby promoting the uptake of practices like SLMPs. For example, policymakers can support community conservation groups by providing free training and shareable tools, which strengthen local monitoring, reduce self-interested behaviour and ultimately increase SLMP adoption.
However, it is crucial to acknowledge that social support alone is not a panacea. Its effectiveness in promoting SLMPs is contingent upon addressing deeper structural constraints, including insecure land tenure, limited access to affordable agricultural inputs and credit from formal sources, and poor rural infrastructure. Effective policy should therefore combine support for social networks with efforts to remove these systemic barriers, creating an enabling environment for sustainable land management.
This study has several nuances that warrant consideration. Firstly, despite efforts to isolate the effect of social support, peer effects from neighbours’ SLMP adoption may persist; panel data and network analysis could help disentangle them. Secondly, our count measure treats all SLMPs equally and ignores intensity or quality; a weighted index accounting for labour, cost or effectiveness would be more informative. Thirdly, the findings likely generalize best to similar agrarian contexts in sub-Saharan Africa. Finally, while our cross-sectional design uses methods like ESC to address self-selection, panel data would better control for time-invariant heterogeneity and strengthen causal inference.
Supplementary material
The supplementary material for this article can be found at https://doi.org/10.1017/S1355770X26100655.
Data availability statement
The data that support the findings of this study are not publicly available due to confidential company data by the Zimbabwe Food and Nutrition Council (FNC), but are available from FNC on reasonable request at: info@fnc.org.zw.
Funding statement
No funding was received to assist with the preparation of this manuscript.
Competing interests
The authors declare that they have no known competing financial interests or personal relationships that could have appeared to influence the work reported in this paper.