I
Why isn't there one market for trading securities? Should the markets of the European Union be merged into one? Who will win the struggle for hegemony if not monopoly in the United States, the NYSE or Nasdaq? The complicated contemporary regulation of markets and the apparent endogeneity of key elements in microstructure make identification of an optimal architecture difficult. In this article, I look back to the largely unregulated pre-Securities Exchange Commission era in the United States. I focus on the years between 1900 and 1933, when there was vigorous competition among exchanges during a period of rapid technological change, both in production technologies and the information technologies used by the financial markets. Surprisingly, instead of leading to a concentration of trading in the largest market, there was fragmentation. The NYSE was the largest and most transparent market, but it struggled with other established markets and new rivals who attracted volume by their willingness to list new issues and quickly adjust their microstructure.
This development followed a pattern that had emerged in the nineteenth century when new industries, whose technologies were risky or difficult to evaluate, were not quickly accommodated by the dominant exchange. The more lenient listing and disclosure requirements of existing rival exchanges and new entrants provided these firms with easier access to the capital markets, while the dominant exchange lost market share and scrambled to catch up.
This article begins with a survey of the theoretical determinants of the choice of trading venue in Section II, which serves to highlight the factors that contributed to the continuing strength of rivals to the dominant exchange. Section III describes newly recovered seat prices for most early twentieth-century US stock exchanges. These data permit the construction of a measure of the aggregate value of the exchanges (the price of a seat times the number of seats) and their market shares. While measures of trading volume can provide a measure of an exchange's market share over a specific span of time, the aggregate value of an exchange is a forward-looking measure, reflecting the present discounted value of brokers' access to the floor of the exchange, and hence expectations of the exchange's future competitiveness. Section IV provides a narrative of the evolution of competing exchanges from the early nineteenth century to World War I, where there is less comparable data but a pattern for trading among the exchanges of concentration–dispersal–concentration was already evident. Finally, Section V examines the struggle among the exchanges in the boom years of the 1920s. It details the difficulties that the dominant NYSE faced during a period of rapid economic growth and technological change. This evidence suggests that while there are strong forces that concentrate orders on one exchange, as theory suggests, there is no reason to assume that other exchanges are unnecessary and do not provide vital services to the most dynamic sectors of the economy. Section VI concludes with how the Securities Exchange Commission (SEC) ended competition between the exchanges.
II
In the simplest model, trading should be concentrated in one market because of a network externality (Keim and Madhavan Reference Keim and Madhavan2000).Footnote 2 If a security is traded in two markets and order-processing costs are a decreasing function of volume, higher volumes will produce shorter holding periods and lower inventory costs in a quote-driven market (with market makers/dealers) or yield a faster matching of orders in an order-driven market. If one market has a cost advantage, its lower bid-ask spreads will attract more volume and lead to consolidation in a single market. Liquidity thus attracts more liquidity, and this positive trading externality should result in one trading venue. Yet, this simple prediction has not been realized, as there are additional dimensions to the choice of trading venue problem, including the heterogeneity of traders, listing rules, bundling of orders and capacity constraints. In this section, I review these factors for insights into the evolving competition among American stock exchanges from the early nineteenth to the early twentieth century. As there is no one encompassing model of the determinants of trading venues, the historical narrative in the next section provides an interpretive framework.
Most basic models of security market microstructure (Kyle Reference Kyle1985; Pagano Reference Pagano1989; Admati and Pfleiderer Reference Admati and Pfleiderer1988) assume that there are two basic types of traders: small traders (or liquidity traders) and large, active traders, typically institutions. In quote-driven markets, there is a third class of agents, dealers or market makers. Large traders are assumed to have better information about the financial conditions of firms compared to small traders because of economies of scale and scope in collecting the asymmetric information that pervades financial markets. From a historical point of view, the advantages of large traders are not constant, as the emergence of new industries and technologies may increase the asymmetry of information, thereby creating a dynamic.
Large traders would naturally like to exploit their superior information by trading with either small traders or dealers. While lacking the detailed and perhaps inside knowledge about firms, dealers are generally thought to have better information relative to small traders because they monitor the order flow of trades. Most models depict them as recouping any losses from trades with large traders by widening their spreads with small traders who pay a premium to be in a market where there is rapid disclosure of information.
The problem for a large trader is that placing orders discloses information that is picked up by the rest of the market. Large traders would like to avoid high transparency. They may seek to cloak their moves by dispersing orders in high volume markets or sending them to non-transparent over-the-counter or ‘upstairs’ markets. Consequently, the appearance of new industries whose risk is more difficult to ascertain will amplify this effect. Nevertheless, large and small traders need one another. The less well-informed small traders need to trade in a venue with large institutions to obtain better price information, while large traders need the mass of small traders to absorb their large trades. Consequently, there is a tendency for both large and small traders to congregate in the same trading venue. Specialist market makers may help to establish a venue by anchoring liquidity with their promise to provide it, contributing to the positive trading externality that concentrates activity in one venue.
The listing decision also influences the choice of trading venue. The listing decision is determined both by the issuing firm and the exchange. Whether a security will be listed by an exchange depends on the riskiness of the firm and the degree of disclosure required by the exchange. Even the best firms do not like to disclose their true risk because the absence of disclosure allows the insiders in the firm to trade using their inside information about the firm. Again, periods of rapid technological change will affect the listing choice by increasing the desire or ability of firms to limit disclosure.
Given their information disadvantage, small traders should prefer exchange-based rules that compel disclosure of information that would otherwise be expensive for them to acquire. Some have argued that if stock exchanges are allowed to set their own disclosure standards, ‘a race for the bottom’ will occur, as exchanges lowered their standards to attract new listings.Footnote 3 Lower standards would benefit insiders, and market makers would respond by increasing their spreads to the disadvantage of other traders. Yet, Huddart, Hughes and Brunnermeier (Reference Huddart, Hughes and Brunnermeier1999) contend that this fear is mistaken; and a ‘race for the top’ is more likely, where disclosure requirements would be raised and trading costs would fall. They argue that although corporate insiders control the listing decision for a firm and seek to exploit their information advantage by listing where there are weaker disclosure requirements, they will be attracted to the high-disclosure exchanges because of the greater depth provided by the liquidity traders, which gives them a disguise to conduct their trades. By setting high-disclosure rules, an exchange may become dominant because it attracts both small and large traders, thus generating good price information and liquidity. However, given the diversity of firms, there will be multiple exchanges, with differing disclosure standards. Low-risk, established or mature firms should be attracted to list on high-disclosure exchanges, and high-risk, new firms will list on low-disclosure exchanges, with fewer small traders and less liquidity.
Another key feature of competition between exchanges is capacity constraints, which in turn affects order flow and listing. All exchanges impose some limits on entry; and on the American exchanges, this constraint was achieved by fixing the number of seats for brokers and controlling their relationships with other exchanges. Minimally, the purpose of these requirements should act to control counterparty risk.Footnote 4 Some screening and monitoring of members is needed, in addition to a punishment mechanism to reduce this risk. Limiting entry by fixing the number of seats on an exchange may enhance the ability to control counterparty risk; but it may facilitate members' ability to extract some rents, raising the value of a seat. At the same time, this constraint will reduce the effectiveness of an exchange to efficiently process order flow.
Given a fixed number of brokers on the floor of an exchange and the need to trade a variety of securities at different geographically dispersed posts, higher order flow at some point will produce congestion, where the number of counterparties available at a post for a trade is reduced and consequently the bid-ask spread is increased (Davis, Neal and White Reference Davis, Neal and White2007). Higher volume here does not lower costs but raises them, reducing the attractiveness of the trading venue, and inciting a fragmentation of trading rather than concentration, as customers seek lower cost exchanges. Given the capacity constraint, the exchange may try to control flow by, for example, limiting orders to lots of 100 shares, forcing customers with odd lots to use other trading venues. In addition, fixing the number of brokers may lead them to become more selective, listing fewer securities. The highest-disclosure exchange with a fixed number of brokers may exclude securities that would be included if there were no restriction on entry. Other trading venues may thus obtain higher-quality securities than they would otherwise. Not only may these rivals gain business from these listings but they may also increase their trading in the high-disclosure exchange's securities because they may pick up odd lot orders that are excluded.
These factors inhibit the concentration of trading at one exchange. The tendency towards a fragmentation of trading will be aggravated if there is a technology shock, which creates new industries and firms, which require new listings and where it is not possible initially to distinguish between low- and high-risk firms. The aircraft industry in the 1920s and the dot.com companies of the 1990s are examples of this phenomenon. Consequently, either because of capacity constraints that limit listings or because new firms cannot provide the necessary information, new securities will not conform to the high-disclosure exchange's rules and they will list on low-disclosure exchanges. If small traders are risk averse, they will already engage in some trading of high-risk firms on low-disclosure exchanges, even if they are at an information disadvantage. When a low-disclosure exchange expands with new issues, it will attract more business from large and small traders, increasing its potential liquidity for any security. The result will be increased competition for the high-disclosure exchange and a threat to its dominant position. It must then provide more attraction for the new industries through a number of strategies. It may devise some subsidiary trading venue or merge with rival exchanges, even if this threatens to reduce members' rents. But it must meet the challenge; if enough liquidity builds up on the other exchanges, it may tip in favor of the rival exchange, leading to the demise of the dominant exchange. Thus, competition serves to keep the dominant exchange up to date in terms of its technology and the stocks it lists, enabling it to maintain its dominant position.
III
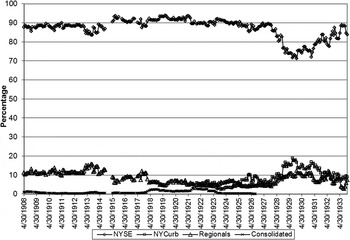
It is usually assumed that the NYSE has always been the dominant market. However, its position prior to 1933 was constantly challenged, reflecting the dynamics of the competition between the exchanges where entry of brokers was limited and where frequent booms and productivity shocks drove up order flow and listings. Figure 1 shows the competitive position of the NYSE between 1908 and 1933 by looking at the shares of the aggregate value of all US stock exchanges, where the last sale price of a seat times the number of seats yields the aggregate value of an individual exchange.
The relative shares of the aggregate value of US stock exchanges, 1908–33

While volume of trading might seem to be a more natural measure to compare the importance of exchanges, a broker's seat on an exchange provides a measure of the expected future value. Seats are capital assets whose price reflects the brokers' expectations about the future profits from the special access to the trading floor of the exchange. Their value is determined by the expected volume of activity on the exchange and the degree of competition among traders on the exchange and between the exchange and the rest of the market (Schwert Reference Schwert1977; Keim and Madhavan Reference Keim and Madhavan2000; White Reference White, Atack and Neal2009). Thus, the price of a seat gives a broker's opinion about the competitiveness of his or her exchange.
Beginning in 1908, the Bond and Quotation Record, a publication of the Commercial and Financial Chronicle, provided a monthly report on exchange seats for stock markets and commodities exchanges. Usually the number of seats on the exchange, the last sale and sometimes the bid and asked prices were given. The Record did not give a complete list of the exchanges, but instead provided information on the leading exchanges.
The regional stock exchanges reported in the Record were Baltimore, Boston, Chicago, the Chicago Curb, Cincinnati, Cleveland, Columbus, Detroit, Hartford, the Kansas Board of Trade, Los Angeles, the Los Angeles Curb, Louisville, Minneapolis-St Paul, New Orleans, Philadelphia, Pittsburgh, Portland, St Louis, Salt Lake City, San Francisco, the San Francisco Curb, Seattle, Washington, DC, and Wheeling. Some exchanges appear and disappear depending on their prominence and the activity of seat trading. This list from the Bond and Quotation Record sought to be comprehensive, covering all but the very smallest exchanges. Their exclusion is assumed to be a minor problem, as even the minor exchanges that were recorded were very small in terms of value of seats or volume compared to the larger exchanges.Footnote 5
The salient feature of Figure 1 is the NYSE's decline in the share of aggregate value of American stock exchanges. After accounting for approximately 90 percent of the total since 1908, the NYSE's share dropped to three-quarters during the years of the stock market boom. Although its long-term antagonist in New York, the Consolidated Exchange dwindled and then disappeared in 1926, the New York Curb Exchange grabbed a large share during the boom as did the vibrant regional exchanges. Although the snapshot from 1908 to 1933 gives the appearance of a one-time challenge to the NYSE's hegemony, the rise and fall of its share was part of a struggle that began in the early nineteenth century. To place the events of the 1920s in context, the next section reviews the battles between exchanges for dominance up to World War I.
IV
The NYSE's dominant position before World War I, seen in Figure 1, had been forged by a long struggle. The old New York Stock and Exchange Board (NYSEB) was formed in 1817. It restricted membership and operated indoors with a call rather that a continuous market. Those brokers who were not admitted carried out business on the curb, taking business that the NYSEB either ignored or that the curbstone brokers could capture. During the boom of the 1830s, the market grew faster than the brokers of the NYSEB could handle, and rival brokers formed the New Board in 1835, which handled many railroad securities (Garvy Reference Garvy1944). The New Board prospered until the crisis of 1837 when a majority of its members were ruined; it never recovered, disappearing in 1848.
The trading boom in gold, securities and other assets during the Civil War found the NYSEB woefully unprepared to handle increased volume; it admitted few new brokers and held only two calls a day. In reaction a group of brokers formed the Open Board of Stock Brokers in 1864. This group of younger brokers introduced many innovations, opening sessions to public observation and establishing a governing committee. The Open Board was only one of many exchanges that formed during the Civil War. Membership usually required only an annual subscription fee, and they provided a key service by offering a continuous market between the formal calls of the NYSEB. Recognizing the need for a continuous market, the NYSEB with its 533 members merged with the 354 member Open Board of Brokers and the 173 member Government Bond Department in May 1869. Outside brokers were expelled from its building and membership was fixed at 1,060 brokers with membership becoming salable in the newly named New York Stock Exchange (Garvy Reference Garvy1944). The only additional increase in size of the exchange occurred when, to finance the purchase of additional property to expand the exchange in 1879, 40 new memberships were sold, bringing the number of brokers to 1,100.
While this new NYSE was dominant, it faced challenges from new rivals, as new industries emerged that required the issue of securities to raise capital. Concentrating on the railroads, the NYSE admitted very few mining stocks that began to appear in the 1860s. To fill this void, several exchanges arose. The New York Mining Exchange appeared in 1864 and the New York Petroleum Stock Board in 1865. They merged in 1866 only to founder because of fraudulent dealings. In 1875, the New York Mining and Stock Board was formed, followed by the American Mining and Stock Exchange in 1876. Concerned about this development, the NYSE encouraged the revival of the New York Mining Exchange, concluding an agreement with its members not to deal in securities listed on the NYSE while the latter would not list any more mining stocks. This cooperative arrangement undermined the American Mining and Stock Exchange which merged with the New York Mining Exchange in 1877. The outmaneuvered New York Mining Exchange found a new source of securities with the development of the petroleum industry and reorganized in 1883 to become the New York Mining Stock and National Petroleum Exchange. In addition, a Miscellaneous Securities Board was organized, focusing of the new industrial securities (Garvy Reference Garvy1944). Meanwhile, outside of New York City, regional exchanges including those in San Francisco, Boston, Philadelphia and Denver thrived by listing mining and industrial stocks.
At this point, the brokers excluded from the NYSE made a bold move to seize its huge railroad securities business. In 1885, the New York Mining Stock and National Petroleum Exchange merged with the New York Petroleum Exchange and Stock Board and the Miscellaneous Securities Board to form the Consolidated Stock and Petroleum Exchange with a membership of 2,403, twice the size of the NYSE. This new giant began an assault on the NYSE. First, it broke off negotiations with the NYSE over dividing up the market and began to deal in railroad securities, charging lower commissions. The NYSE responded by forcing 400 of its members and their partners who had held seats on the Mining Exchange to resign from the Consolidated and prohibited all of its members from transactions with the Consolidated. Recognizing that its exclusion of various types of securities offered rivals an opening, the NYSE created an Unlisted Department where securities that provided only limited financial information could be traded. These efforts did not meet with immediate success and a long period of trench warfare ensued.
The Consolidated was formed at a time of rapid growth in the size of securities markets when the number of companies seeking to list rose sharply (O'Sullivan Reference O'sullivan2007). Although the NYSE increased its listings, it could not accommodate all those firms that were eager to be on the Big Board given its standards and hesitancy for admitting those in new industries. Not only was the Consolidated able to step into the breach, but it also traded NYSE-listed stocks, willing to take orders for odd lots under the 100 share NYSE minimum, opening earlier hours, and offering longer settlement times. By 1888, volume on the Consolidated reached 45 percent of the NYSE's volume, rising to a peak of 61 percent in 1894, before declining by more than half in the next decade.Footnote 6 Brown, Mulherin and Weidenmier (2006) find that competition from the Consolidated was strong enough to reduce bid-ask spreads on the NYSE by over 10 percent.
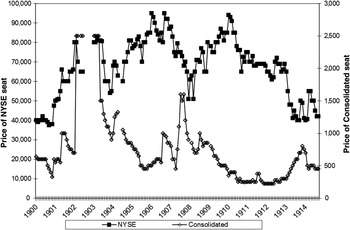
The struggle between these two New York exchanges before World War I can be seen in Figure 2 in the seat prices for the NYSE and the Consolidated Exchanges, which in 1908 had roughly the same number of seats, 1,100 and 1,240, respectively. As is immediately apparent, the value of business on the NYSE exceeded that on the Consolidated, as reflected in their seat prices, which are scaled differently on the vertical axes. They were both driven by the general movements of the market, as visible in the jump in seat prices during the boom of 1902-3; but sometimes Consolidated seat prices moved independently of NYSE prices. In 1907, seat prices for the Consolidated rose, benefitting from the listing of speculative copper stocks, only to suffer in the ensuing crash.
Seat prices on the NYSE and Consolidated Exchanges, 1900–14

The NYSE market still had greater depth than the Consolidated. In 1907, for example, the Big Board traded 156 million shares compared to the Consolidated's 45 million shares (Brown et al. Reference Brown, Mulherin and Weidenmier2008); and the latter often relied on NYSE quotations to trade NYSE listed securities. The struggle between the two exchanges reached a climax when the Consolidated began to directly obtain quotations, using Western Union's ticker service and charging only half the NYSE commission. The NYSE responded by inserting a clause into its 1900 contract with Western Union, forbidding the transmission of quotations to organizations and exchanges in New York City that competed with the NYSE. When the courts upheld an injunction, forbidding removal of the Western Union ticker from the Consolidated in 1909, the NYSE responded by vigorously enforcing its rule that prevented members from doing any business with a member of another exchange. This boycott reduced the Consolidated's business and led to a slow decline. According to Garvy (Reference Garvy1944), the Consolidated had a membership of 1,225 but only a third were active. The Consolidated's decline is witnessed in Figure 2, where there is a steady fall in seat prices, while those on the NYSE rose. So confident was the NYSE that it abolished the Unlisted Department in 1910, admitting many of its securities to the official listing.
Yet, the NYSE was well aware that there remained a potential for a new rival exchange, particularly among the brokers on the Curb who usually did not compete with the NYSE but cooperated and only traded unlisted securities. The curbstone brokers served as a complementary market, with members of the NYSE placing orders for unlisted stocks with the Curb brokers. Before World War I, one estimate put 75 percent of all transactions on the Curb as originating with NYSE members (Garvy Reference Garvy1944). Following its successful assault on the Consolidated, the NYSE listed many mining securities traded on the Curb, charging a commission for those stocks selling under $10 that was half the usual rate. The NYSE's objective was to prevent the Curb from organizing into a formal exchange. Nevertheless, the New York Curb Market was formed in 1911, but it submitted its constitution for approval to the NYSE. In its founding document, the Curb agreed to prohibit its members from dealing with brokers on the Consolidated.
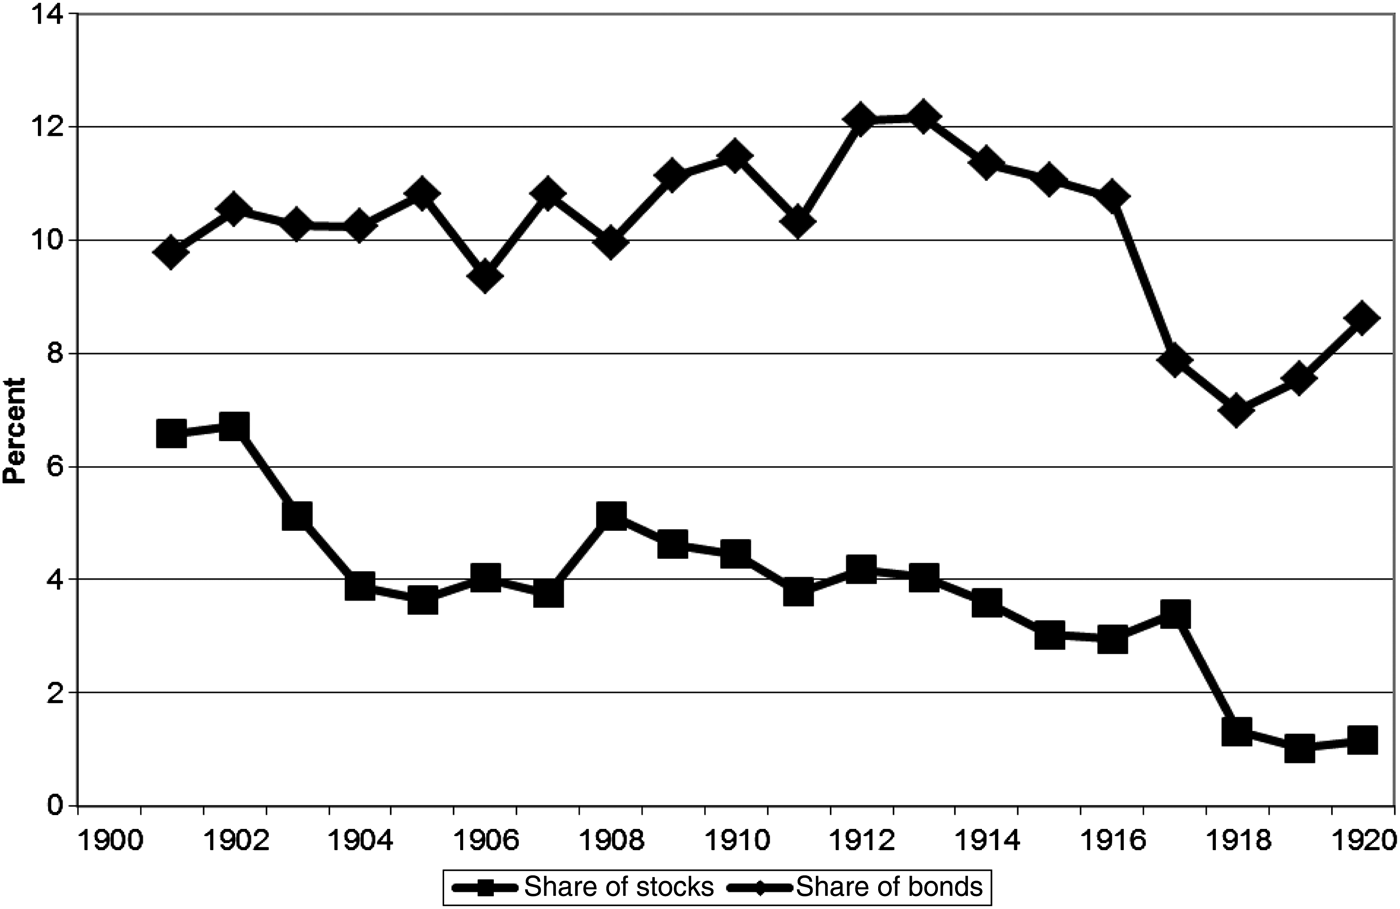
Not only did the NYSE weaken the Consolidated Exchange and secure the obeisance of the Curb, but it also seems to have gained ground on the regional exchanges. At about the time of the outbreak of World War I, the share of the regionals of total value of the markets fell below 10 percent in Figure 1 while the NYSE's share rose about 90 percent. This increase in the concentration of trading, with activity moving to the NYSE, may reflect the long-term gradual improvement in information technology. Focusing on Baltimore, Boston, Chicago, Philadelphia and Pittsburg, the largest markets, for which there is generally continuous data, Figure 3 shows the proportion of shares traded by these five markets and the NYSE and the proportion of the face value of bonds traded from 1900 to 1920. Although relatively modest in size compared to the NYSE, their market shares began to decline around World War I.
Regional markets' proportion of volume of shares traded and face value of bonds, 1900–20
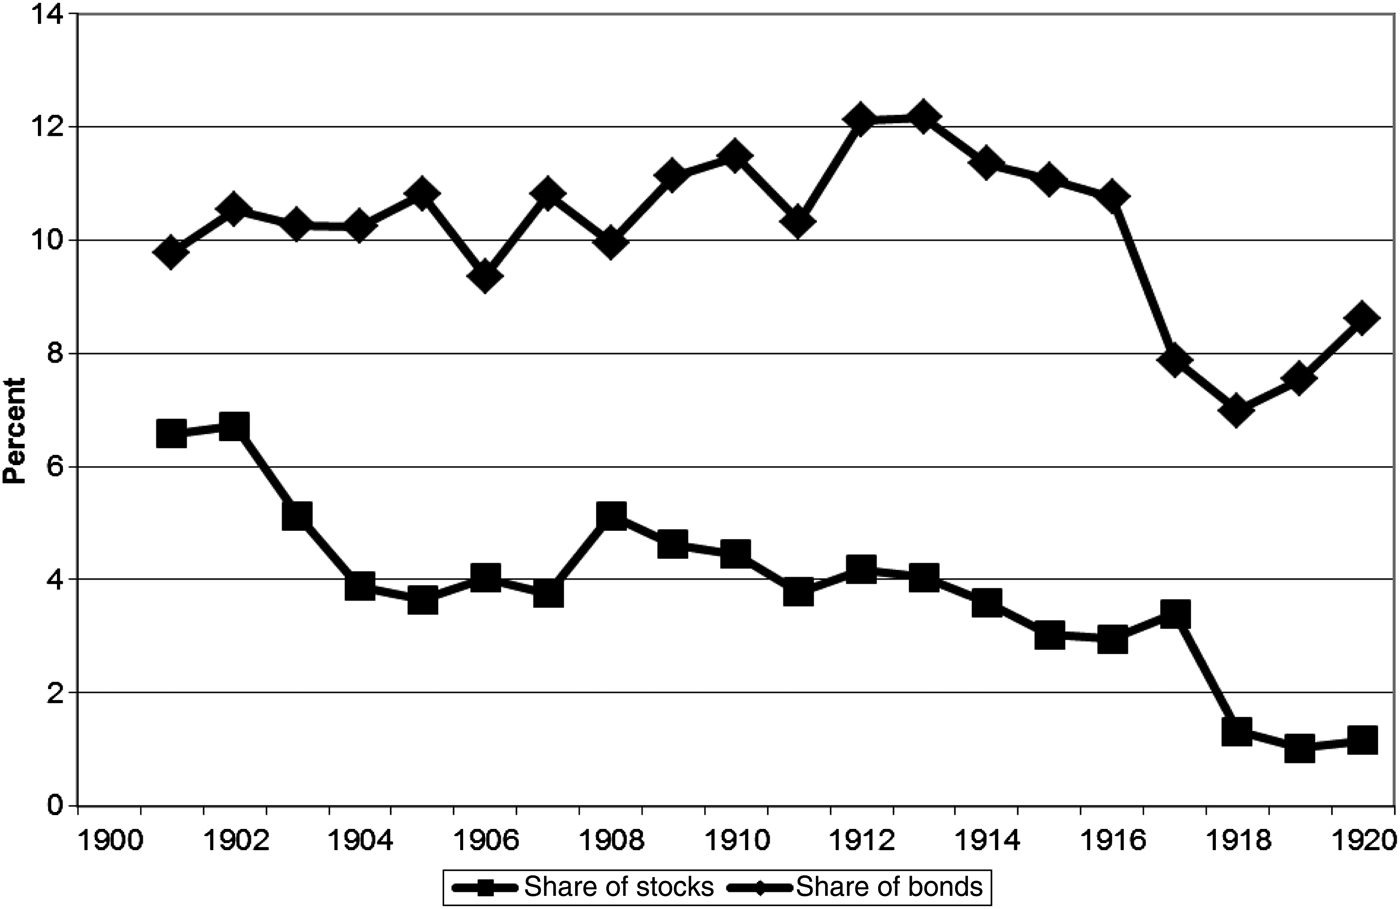
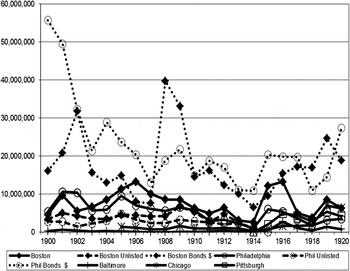
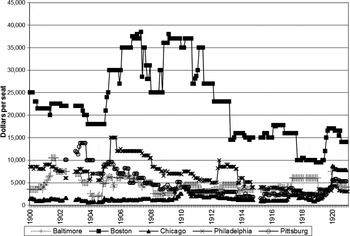
The flat or weakening position of the regional exchanges is also seen in Figure 4, which displays data on volumes for shares and face value in dollars for bonds traded on these exchanges. Both Boston and Philadelphia seem to have followed the lead of the NYSE and created Unlisted Departments to compete with outside brokers and then closed them shortly after the NYSE closed its Unlisted Department. If these were included in the totals, Boston's and Philadelphia's shares traded would be largely flat over time. Overall, it appears that these exchanges were losing ground to the NYSE. The low expectation for these exchanges is seen in Figure 5, which shows the prices of seats for exchanges for which there is regular information; prices are decidedly lower after 1910.
Activity on the regional exchanges 1900–20 (shares–volume, bonds–dollar face value traded)

Seat prices on regional exchanges, 1900–20

From the vantage point of the members of the NYSE, the exchange entered the 1920s in an enviable position. The Consolidated Exchange had been weakened; in 1922 there was a trading scandal from a series of brokerage failures that implicated its president. It rapidly lost business to the NYSE and finally closed in 1926 (Sobel Reference Sobel1970). The Curb market was tamed and a useful complement, while the regional exchanges were losing business. The increasing liquidity of the New York market was attracting more transactions, leading to a further concentration of business. It looked like the NYSE would have a secure hegemonic position in any future boom.
V
Yet, the 1920s proved an even greater challenge to the NYSE. In the boom years of the 1920s, the New York Stock Exchange found its position as the dominant securities market rapidly eroding even as it prospered and seat prices rose. New technologies made processing orders and the dissemination of price information easier, increasing order flow. Rising order flow should have served to lower bid-ask spreads, inducing further order flow and concentrating volume more in the NYSE; but instead, the shares of rival exchanges began to grow.
Typically, the fragmentation of markets is explained by barriers that raise the costs of inter-market trading. Cole (Reference Cole1944) and Arnold et. al. (Reference Arnold, Hersch, Mulherin and Netter1999) claimed that exchanges in the United States were not able to compete with one another effectively until the 1940s because of communications and regulatory barriers, which were only overcome when technologies first introduced in the 1920s – coast-to-coast stock tickers, open-end teletype, and low-cost long-distance phone rates – were fully diffused. While these authors argued that these changes only began to integrate the markets and force exchanges to merge after World War II, the key innovations were already having a profound impact in the 1920s. Vigorous competition was already present as seen in the previous section and viewed in Figure 1.
The 1920s bull market led to a general rise in the value of American stock exchanges. The aggregate value of the US exchanges soared from $220 million in January 1927 to $372 million a year later, climbing to a peak of $912 million in September 1929, before collapsing. Although the NYSE increased in value from $192 to $687 million from January 1927 to September 1929, it steadily lost market share as seen in Figure 1. Averaging 89 percent of all exchanges' value in 1927, the NYSE's share of aggregate value dropped to an average of 76 percent in 1929. It is no surprise that many NYSE brokers were alarmed, as the New York Curb Exchange increased its share from 7 to 13 percent and the regionals from 5 to 10 percent over the same period.
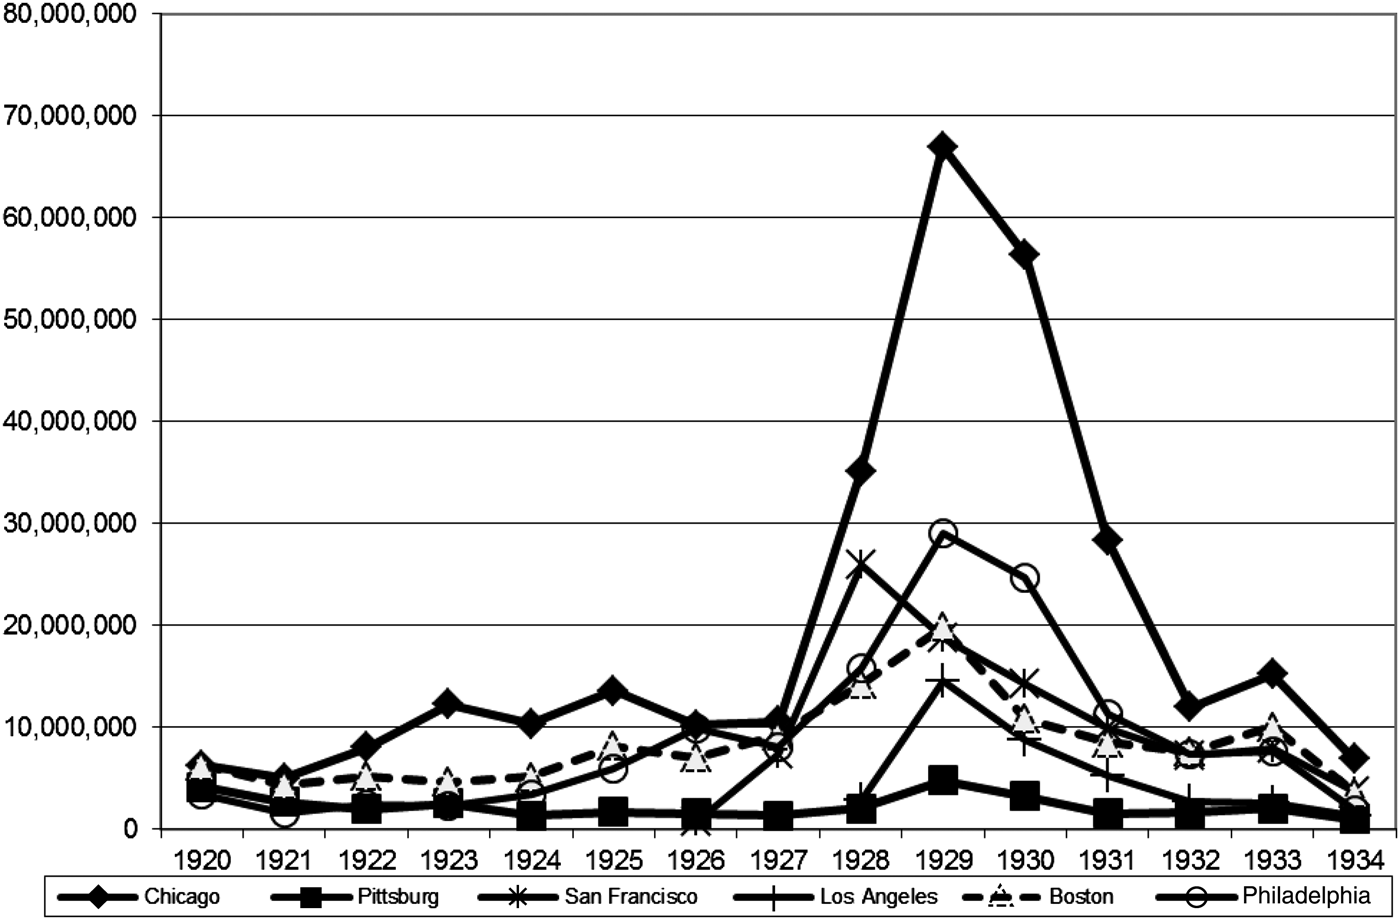
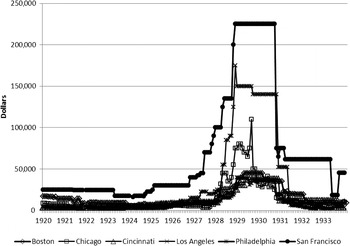
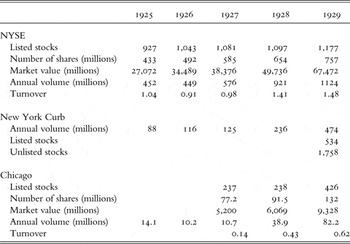
Even as orders were rising because of climbing turnover and new listings, the NYSE was losing ground relative to the regional changes. Yet, the exchange's relatively tough standards limited new listings by the ‘high tech’ firms of the day, which appeared on the New York Curb market and the regional exchanges. Although data on other exchanges are scarce for this period, Table 1 reveals the dimensions of the challenge faced by the NYSE. The New York Curb market was the NYSE's largest competitor but it also complemented the NYSE by taking listings that were below its standards. Chicago was one of the largest regional exchanges and the most agile. Before the boom, volume on the NYSE was five times greater than on the Curb and dwarfed activity on the Chicago exchange. Between 1927 and 1929, the NYSE's listings rose 12 percent, and turnover jumped from about 1.0 to 1.5. Yet, many more new issues were listed on the Curb and its volume rose more quickly. The Chicago Exchange did not participate in the boom until 1928. It had only 237 stocks listed on 1 January 1927 and 238 a year later. But Chicago responded; and by 1 January 1929 there were 426 issues, increasing to 519 at the beginning of 1930. Turnover, which had been a mere 0.14 in 1927, rose to 0.62 in 1928. Figure 6 shows the annual volume of the leading exchanges, and Chicago tops the charts, leaving its peers behind after the mid 1920s. Not surprisingly, its seat prices in Figure 7 rise sharply. However, the great expectations for the Los Angeles and San Francisco exchanges, which were rapidly expanded, led to the highest regional seat prices.
Volume on the leading regional exchanges (number of shares traded)
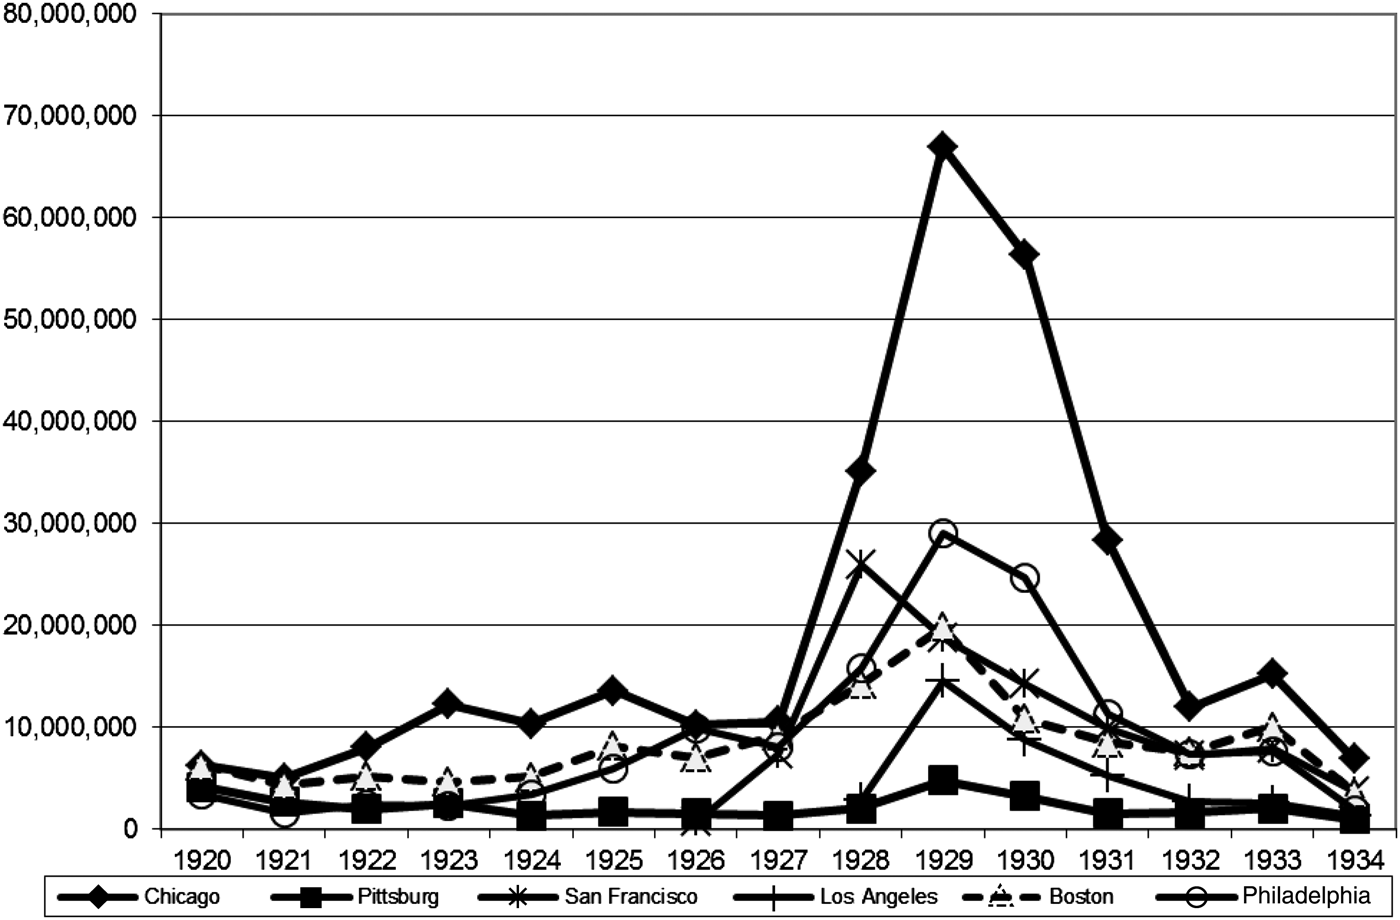
Seat prices on regional exchanges


To accommodate the demand to list new industries, some exchanges opened subsidiaries. In 1928, the Los Angeles and San Francisco stock exchanges created their own curb exchanges to trade securities that did not meet their listing standards.Footnote 7 The Los Angeles exchange saw its total volume increase from 27.1 million in 1927 to 49.4 million in 1928, with the total volume for both parent and curb exchanges reaching 67.8 million in 1928.Footnote 8 If added to the ‘big regional boards’ in Figure 6, the curb volumes would substantially increase volume and match seat price developments more closely. Aggressively pursuing new business, the Los Angeles exchange played a central role in the opening of the San Diego Stock Exchange in March 1929; and its members took half of the 40 San Diego seats.Footnote 9
These exchanges not only handled new regional business but poached trading from New York. Examining the volume reported in the Bank and Quotation Record for the Baltimore, Boston, Chicago, Cleveland, Detroit, Los Angeles, Philadelphia, Pittsburgh and San Francisco exchanges, Arnold et al. (Reference Arnold, Hersch, Mulherin and Netter1999), found that there was a significant overlap of trading on the US stock exchanges. In January 1929, 8.6 percent of the trading volume on the NYSE occurred in securities traded on regional exchanges, while the Curb had 27.7 percent of its volume in such securities. However, trading in New York stocks was much more important for the regional exchanges, where regional stocks only accounted for 63.7 percent of their trading volume, and NYSE and Curb market-listed securities representing the remainder. If the NYSE began to experience difficulties in processing orders, the regional exchanges were only too happy to seize its business.
The NYSE's loss of ground to competing exchanges is most visible in the listing of new stocks. Compared to all other exchanges, the NYSE had the strictest listing requirements. These were more precise and detailed than the regulations of any state blue sky law.Footnote 10 Even critics of the exchange lauded them and these rules formed the basis for the standards established by Schedule A of the 1933 Securities Act (Seligman Reference Seligman1995). The NYSE's Committee on Stock List consisted of five members who had the power to receive applications to list securities and to place those it had approved without explanation. Before a security could be listed on the NYSE, a firm had to file an application that described its capital structure, liabilities, property, officers, and provide five years of financial statements.Footnote 11 In addition, copies of its charter, by-laws, and resolutions were required plus the opinion of an outside legal counsel on the legality of the organization and its securities issues (Meeker Reference Meeker1922).Footnote 12 The purpose of these listing rules appears to have been to attract the small or liquidity traders and ensure that the NYSE would provide the deepest market. Discriminating in favor of large well-known issues where there was good information offered the less-well informed trader a less risky venue for investment. This position is evidenced in the Congressional testimony of H. K. Pomeroy, president of the NYSE. Before the 1912 Money Trust Investigation, Pomeroy explained that the exchange was concerned that if an issue was too small it would be a danger to its customers because ‘a small quantity of stock is more easily subject to manipulation than a large quantity’ (Meeker Reference Meeker1922).
In the face of increasing demand for listings, the NYSE tightened its standards during the boom. In 1923, more than 30 percent of NYSE listed firms were not required to provide shareholders with annual or quarterly financial statements, and only 242 of the 957 listed firms provided both. By 1933, all 1,157 listed firms provided annual reports and over 60 percent also gave their shareholders quarterly reports. In addition, by 1933, 85 percent of the listed firms were audited by independent certified public accountants (Seligman Reference Seligman1995).Footnote 13
The number of applications to list on the NYSE soared during the boom. There were 300 stock applications in 1927, 571 in 1928, and 759 in the first nine months of 1929. Very few of these were accepted. Assuming that de-listings were small, the small rise in the number of stocks traded on the exchange speaks to a very exclusive policy. In 1927 there were 927 stocks listed on the exchange, and by the end of the year there were 1,043 or an increase of 116 when there were 300 applications. For 1928, there was only an increase in 16 securities. And, in 1929, 80 stocks more were listed, though there had been 759 applications (NYSE, Yearbook, 1929-30).
In contrast, the New York Curb Exchange had weaker accounting and listing requirements. For an original listing, only one recent balance sheet and an income statement for the last three years were required. Smith (Reference Smith1937) found that information on subsidiaries, constituents, owned and controlled companies, and dividends paid by subsidiaries was not required by the Curb. The rules for the Curb's ‘unlisted stocks’ were much weaker. These issues could be admitted on application of a member and the information for admission could be taken from financial manuals or ‘authoritative sources’, such as Moody's (Seligman Reference Seligman1995). Statements presented to stockholders were to be certified by independent accountants, and companies were to maintain a policy of furnishing at least annual reports of the balance sheets profit and loss statements. Not surprisingly, there were only 534 listed stocks on the Curb, but 1,758 unlisted stocks in 1929 (New York Curb Exchange 1929). According to Smith (Reference Smith1937), the accounting requirements of the San Francisco, Chicago, Philadelphia and Boston exchanges were similar to but weaker than those of the NYSE, requiring a statement of earnings for five years if available, one recent income account, a balance sheet, and similar accounts for predecessor, constituent, subsidiary and owned or controlled companies.
Beyond its concern over signaling the quality of securities to small traders via its listing standards, the NYSE was held, perhaps, more severely in check by the difficulty of increasing its capacity to manage peak periods of orders. When trades in shares of an individual company rose, bid-ask spreads shrank. However, on days of peak demand, rising volume for numerous companies whose shares were traded at various posts created congestion on the floor of the exchange, as brokers scrambled to quickly execute all orders. As Davis et al. (Reference Davis, Neal and White2007) have shown, increases in total exchange volume on peak days led to large and significant increases in bid-ask spreads, making it more costly to trade on the NYSE and driving customers to other venues. As a mutual, the NYSE could increase its capacity by adding more seats to meet peak demand; but since its members governed the exchange, many were wary of diluting the value of their seats by increasing the total number. They were afraid that if additional seats (capacity) did not attract sufficiently increased volume, the value of their seats would decline.
Consequently, the exchange was hesitant to expand the number of seats and tried some alternative measures. Observing that retail investors were abandoning the bond market for the stock market during the boom, the exchange responded by reallocating posts on the floor from bonds to stocks, with municipals gradually being pushed off the floor of the exchange and onto the over-the-counter market, but this was a small improvement at best (Biais and Green Reference Biais and Green2005). The threat of losing the NYSE's dominant position finally enabled the management of the exchange to persuade its membership to take a leap of faith. Sustained by a straw poll that showed its membership was in favor of adding seats, the Governing Committee of the NYSE voted 31 to 1 on 24 January 1929 to increase capacity by 25 percent by giving each member a quarter seat. These quarters could be traded to form new seats, ensuring that any increase in the value of the exchange from improved efficiency would be captured by the existing members. In an event study, Davis et al. (Reference Davis, Neal and White2007), found that the belief that additional liquidity would be gained caused the price of seats to rise between 15 and 20 percent. These authors also estimated that the bid-ask spreads became less sensitive to surges in trading, although the spread might still jump on the highest-volume days. Presumably, the added capacity from a 25 percent expansion would then have allowed the exchange to increase its listings and regain some ground. However, brokers did not have the opportunity to discover for themselves whether the increase by 25 percent was enough. Initially, the October 1929 crash produced some high-volume days, but volume sagged as the Great Depression took hold and the New Deal intervened to regulate the exchanges.
VI
The crash brought a halt to the decline of the NYSE's position but it did not recover its dominant position until 1933. Yet, it was a pyrrhic victory because competitors' volumes had shrunk more than volume on the NYSE. The SEC now halted competition between exchanges. The playing field was leveled in the wake of the crash of 1929 when regulators raised the listing standards of the regional exchanges to the level of the NYSE (Arnold et al. Reference Arnold, Hersch, Mulherin and Netter1999). Firms that could list on the NYSE moved to New York, where the post-crash reduction in volume ensured plenty of capacity; and those that could not meet the new standards migrated to the over-the-counter market. New entry by exchanges was effectively barred by the SEC, weakening competition and returning the NYSE to its former position of dominance. Regulation thus played a key role in restoring the NYSE's hegemonic position. Slowing productivity growth in the third quarter of the twentieth century also assisted by reducing the demand for innovating secondary securities markets to serve new technology firms.Footnote 14 When a new wave of technologies arose in the last decade of the twentieth century and IPOs surged back to their pre-1929 levels, rival markets again challenged the ‘natural’ monopoly of the NYSE.Footnote 15