


1. Introduction
In mountainous areas, snowfall is temporarily stored during the winter because of topographic effects and low temperatures, and meltwater is released from snow cover in the spring. Meltwater generally contributes to river discharge and affects diurnal and seasonal variations in river discharge. Snowmelt modeling over a large area is therefore essential to understand hydrological processes in both snow-dominated and downstream areas.
The western part of Japan’s central mountain spine, facing the Sea of Japan, is one of the heaviest-snowfall regions in the world, despite relatively low latitude; a large part of this region is covered by seasonal snow (Reference Asaoka, Kominami, Takeuchi, Daimaru and TanakaAsaoka and others, 2007). As a cold, dry winter monsoon blows from the Eurasian continent during the winter, heat and vapor are transferred from the relatively warm sea surface to the lowest layer of the atmosphere over the Sea of Japan. This process decreases the stability of the lower atmosphere and leads to formation of cumulonimbus clouds, which are lifted over steep mountain slopes and release huge amounts of precipitation, resulting in average annual maximum snow depths of >2 m in some lowland areas (Reference Takeuchi, Endo and MurakamiTakeuchi and others, 2008). Snow depth increases with altitude in mountainous areas (Reference Yamaguchi, Abe, Nakai and SatoYamaguchi and others, 2011; Reference Asaoka and KominamiAsaoka and Kominami, 2012). Snowmelt in mountainous areas provides valuable water resources for lowlands (Reference Shinohara, Kumagai, Otsuki, Kume and WadaShinohara and others, 2009). Because the climate in most of this region is temperate, intense or prolonged snowmelt causes flooding in the lowlands. Snowmelt modeling over a large area is thus essential for adequate water resource management and flood control.
The degree-day method (Reference Rango and MartinecRango and Martinec, 1995), a type of temperature-index melt model, assumes that snowmelt is primarily a simple function of air temperature only. Snowmelt follows the principle of energy exchange between snow and the atmosphere. Physical energy-balance models (Reference Brun, David, Sudul and BrunotBrun and others, 1992; Reference YamazakiYamazaki, 2001; Reference Bartelt and LehningBartelt and Lehning, 2002) are effective for point-scale evaluation of snow processes but are often unsuitable for application over large areas because they require input of many meteorological variables and some of these variables must be interpolated with some uncertainty with remote weather stations. The degree-day method has been widely employed for spatial snowmelt modeling over large basins (e.g. Reference Molotch, Fassnacht, Bales and HelfrichMolotch and others, 2004) because temperature data are widely available and easy spatial interpolation of the data is possible. Moreover, despite its simplicity, the degree-day method often yields accurate results if an appropriate degree-day factor (DDF), a parameter of the degree-day method, is obtainable. The DDF is an empirical relationship between air temperatures and melt rates, and its determination requires primarily observational data (Reference Kominami, Tanaka and Endo Yand NiwanoKominami and others, 2005). It is well known that melt rates are heavily affected by meteorological factors and by geographic factors such as slope angle, aspect and latitude. Consequently, DDFs exhibit high spatial variability. In regions where the density of weather stations is low, use of DDFs obtained from point measurements is likely to introduce spatial uncertainly in the surrounding areas.
Satellite remote sensing with optical sensors is an effective way to monitor snow-cover area (SCA) over large regions. The spatial resolution of optical sensors is finer than that of weather stations or in situ data. Therefore, remotely sensed SCA data effectively compensate for the coarse resolution of weather stations or in situ data. Distributed snow models can simulate temporal variations in snow water equivalent (SWE) and snowmelt, and the temporal resolution of these models is finer than the acquisition period of remotely sensed cloud-free images. Thus, the combination of remotely sensed data and snow models is likely to decrease spatial uncertainty associated with spatial snow modeling. A distributed snow model and satellite-derived SCA data have been combined to reconstruct spatial distribution of SWE for small (<1000 km2; e.g. Reference Cline, Bales and DozierCline and others, 1998) and large basins (>1000 km2; e.g. Reference Molotch, Fassnacht, Bales and HelfrichMolotch and others, 2004). This approach requires a wide variety of observational data and many measurement sites to calibrate parameters for the energy-balance model. Satellite-derived SCA data have also been incorporated into a snow model that utilized the degree-day method (Reference Kazama, Izumi, Sarukkalige, Nasu and SawamotoKazama and others, 2008). This approach assumes that parameters calibrated by SCA are spatially constant, and therefore seems to be unsuitable for large areas. These problems are especially relevant for Japan because the cold region in Japan extends over 108 of latitude (35–458 N; Fig. 1) and consists of complex terrain. The DDF therefore varies greatly with the large area.
Location map and SWE observation sites. St.: site.

Few studies have attempted to apply the degree-day method in a fully distributed manner by allowing for spatially variable snowmelt estimates at each gridpoint. Reference Cazorzi and Dalla FontanaCazorzi and Dalla Fontana (1996) proposed a fully distributed model that computes variable melt rates for each grid element of a digital elevation model (DEM) and incorporates topographic effects. Reference HockHock (1999) proposed a model that varies the melt factor at hourly intervals and accounts for the spatial variation of clear-sky direct solar radiation. Reference Daly, Davis, Ochs and PangburnDaly and others (2000) used an antecedent temperature index to spatially distribute the snowmelt rate factor.
In this paper, we develop an optimized methodology suitable for application of gridded DDFs over a large area (>100 000 km2) by using a combination of satellite-derived SCA and a simple snow model that incorporates the degree-day method. This methodology makes it possible to obtain the gridded DDF. The aim of this methodology is to decrease the spatial uncertainty of the DDF for snowmelt modeling obtained with only remote weather stations. This approach is applied to Japanese cold regions (>250 000 km2) and is tested by comparing the results of SWE simulations against observations at stations. Finally, we evaluate the regional characteristics of the calculated DDFs over the Japanese snowy area.
2. Satellite Data
Observations of visible and short-wavelength infrared radiation with an optical sensor such as Satellite Pour l’Observation de la Terre/VEGETATION (SPOT-VGT) or the Moderate Resolution Imaging Spectroradiometer (MODIS) make it possible to identify SCA and develop better snow products. Microwave sensors are also valuable tools for monitoring snow cover or SWE, even under cloudy conditions. However, their coarse temporal and spatial resolution (e.g. 16 days and 15 km for the Advanced Microwave Scanning Radiometer for Earth Observing System (AMSR-E)) is insufficient for monitoring SCA during the snowmelt season and in complex topography. We used SPOT-4/VGT data for detection of SCA. The Centre National d’Études Spatiales (CNES), France, operates the SPOT-4 satellite, and the VEGETATION sensor is a large field-of-view instrument on board SPOT-4 that records in four spectral bands: two visible bands (0.43-0.47 and 0.61-0.68μm), one infrared band (0.78-0.89 μm) and one short-wavelength infrared band (1.58-1.75 μm). Short-wavelength infrared bands, as well as visible bands and shorter infrared bands, permit more precise detection of SCA. The swath width of SPOT-VGT is 2250 km, and observed data have a spatial resolution of ∼1 km at nadir after resampling to an equidistant cylindrical projection, geometric correction and radiometric calibration. Although SPOT-4 has a 1 day overpass interval, SPOT-VGT data are 10day composites of normalized-difference vegetation index (NDVI) data composited by the following procedure: (1) the day when the NDVI was at maximum is extracted from a 10 day sequence of daily NDVI; and (2) values for each band on the extracted date are recorded as representative of the 10 days in the composite data (Reference HolbenHolben, 1986; Reference Duchemin, Berthelot, Dedieu, Leroy and MaisongrandeDuchemin and others, 2002).
3. Methods
Our objective was to use remotely sensed SCA data and the snow model to optimize the DDF for each grid. Because this approach requires information about the duration of snow cover, it is applicable after the disappearance of snow and is useful for reconstructing the distribution of SWE with the snow model and analysis of melt runoff.
3.1. Degree-day factor
Snowmelt modeling using the degree-day method is most commonly formulated as follows (Reference Rango and MartinecRango and Martinec 1995):

where M is daily snowmelt rate (mm d−1), DDF is in mm °C−1 d−1, T a is the mean daily air temperature (°C) and Tb is a base temperature below which there is no snowmelt. A Tb of 0°C is generally used for snowmelt computation, and in this research we also set Tb to 0°C. We assumed that DDF was constant during the snow-cover season, and obtained gridded DDFs by assimilating cumulative snowmelt with cumulative snowfall during the snow-cover season as follows:
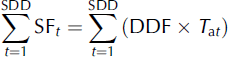
where SF t is daily snowfall (mm d−1) on day t and t=1 represents the first date of snow cover. The DDFs were obtained after acquisition of meteorological forcing data and snow disappearance date (SDD) information during the snow-cover season. We estimated spatial snowfall distribution and mean air temperature with spatial interpolation of observed meteorological data (see Section 3.2). We obtained the first date of snow cover for each gridpoint from the output of the snow model, and the SDD from the sequence of satellite-derived SCAs (see Sections 3.3. and 3.4).
3.2. Spatial meteorological data for model input
We used Automated Meteorological Data Acquisition System (AMeDAS) data, managed by the Japan Meteorological Agency (JMA), to interpolate gridded temperature and snowfall data with a resolution of 1 km. AMeDAS provides information on precipitation, air temperature, wind direction, wind speed and sunshine duration at daily and hourly intervals at about 840 stations (spacing of ∼21 km) in Japan. Among the 840 stations, snow depth is recorded at 200 stations in snowy areas. We estimated daily mean air temperature for each 1 km grid by interpolating observed data with a lapse ratio of 6.5°C km−1. To decrease the spatial variability of temperature around gridpoints due to topographic heterogeneity, we used 1 km average digital elevation data, which were calculated from the average elevations within 250 m intervals.
We also estimated daily snowfall for each gridpoint with daily precipitation at AMeDAS stations and the dependency of snowfall on elevation. First, we corrected daily precipitation for each AMeDAS station with the rain-gauge catch ratio of snowfall because wind during snowfall events generally degrades the capture efficiency of rainfall gauges. We assumed that the gauges caught 80% of snowfall (Reference Kominami, Tanaka and Endo Yand NiwanoKominami and others, 2005) and 100% of rainfall. Second, because at large spatial scales snowfall generally increases with elevation (Reference Asaoka, Kazama and SawamotoAsaoka and others, 2002; Reference Asaoka and KominamiAsaoka and Kominami, 2012), we calculated three precipitation values for each gridpoint according to the three closest AMeDAS stations as follows (Reference Motoya, Yamazaki and YasudaMotoya and others, 2001):

where PR is daily precipitation at elevation z (m), elv is the elevation (m) and C sf is the coefficient of the vertical gradient of snowfall with respect to height z and was assigned a value of 0.001 (Reference Kondo, Motoya and MatsushimaKondo and others, 1995; Reference Asaoka and KominamiAsaoka and Kominami, 2012). The subscript ‘obs’ refers to observation sites. This approach does not require use of the coefficient for rainfall because the snow model assumed that rainfall did not affect the mass balance of the snowpack. To separate snowfall from precipitation, we obtained a ratio s of snowfall to precipitation from the wet-bulb temperature T w by using the following equations (Reference YamazakiYamazaki, 2001):

T w is obtained from the daily temperature and water vapor pressure and can be approximated to be near 1.0°C as follows:

where e is the water vapor pressure (hPa). We used observed data at the closest sites among approximately 130 surface meteorological observatories managed by the JMA. We then calculated snowfall from the product of sand PR. Finally, we estimated snowfall for each gridpoint from a weighted distance average of the three estimated snowfall values.
3.3. Snow model
The snow model, in which the degree-day method is incorporated, estimates variations in SWE and snowmelt and then obtains the first day of snow cover for determination of DDF. We computed the mass balance of the snowpack for each gridpoint simply in terms of equivalent liquid water volume as follows:

where the time interval is 1 day. Physical processes such as heat fluxes and snowmelt infiltration should be incorporated into the model. However, the goals of this study were to estimate the spatial characteristics of snow cover over a large area and to evaluate the effect of incorporating satellite-derived SCAs into the model. We therefore assumed that the snowpack became saturated after rainfall or snowmelt infiltrated through the snowpack and that liquid water flowed from the bottom of the snowpack within 1 day. We conducted the snow model simulation for each 1 km grid during the period from 1 October 1999 (before snow cover) to 31 July 2000.
3.4. SDD extraction
We extracted the SDD for each gridpoint from the sequence of remotely sensed SCA. We determined snow-cover detection for each pixel by using the S3 index (Reference Saito and YamazakiSaito and Yamazaki, 1999) as follows:

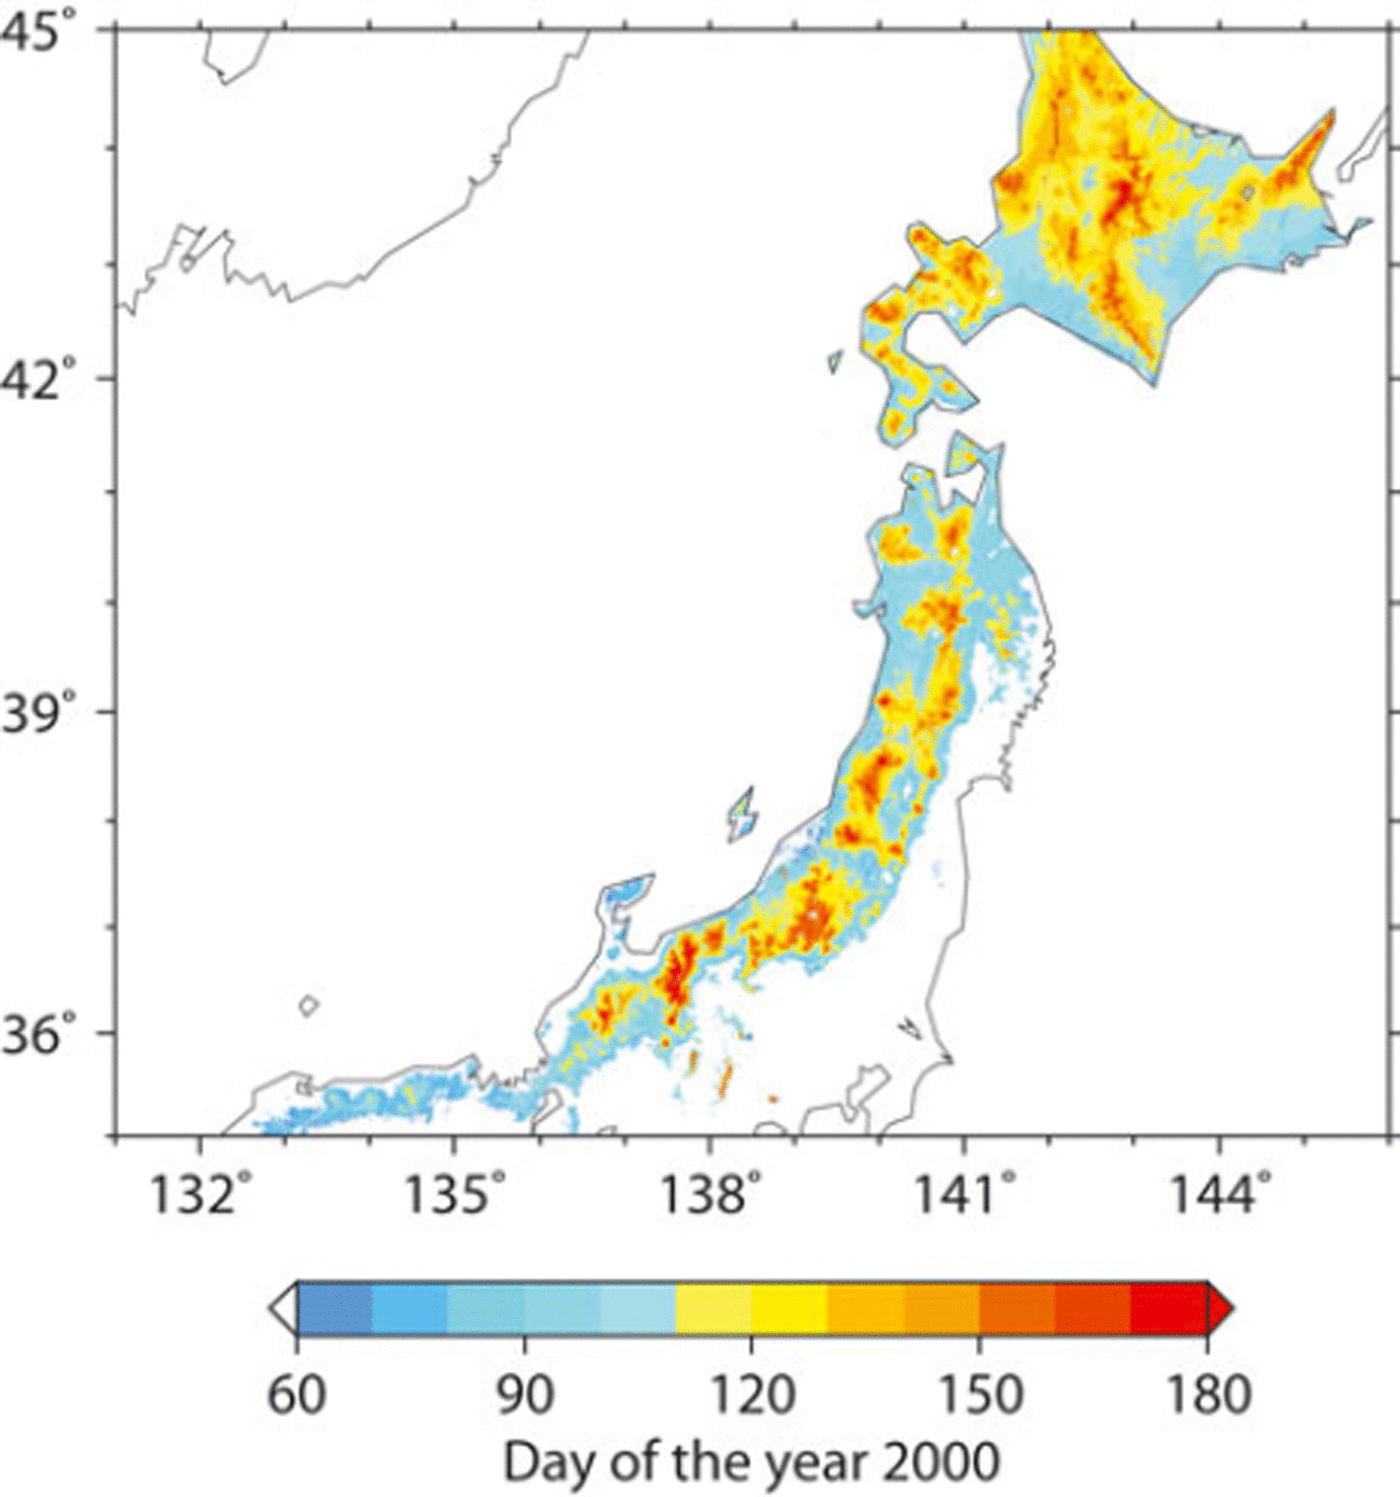
where Vis is reflectance at visible band, Nir is reflectance at near-infrared band and SWIR is reflectance at short-wavelength infrared band. We assumed that the values of Vis, Nir and SWIR were equivalent to the reflectance at the three SPOT-VGT wavelengths: 0.61–0.68, 0.78–0.89 and 1.58–1.75 μm, respectively. We mapped the pixels with S3 > 0.05 as snow-covered (Reference Shimamura, Izumi and MatsuyamaShimamura and others, 2006); otherwise, we mapped them as no-snow areas. We performed the snow-cover detection for 21 SPOT-VGT scenes from January to July 2000 and extracted the SDD for each grid of SPOT-VGT. We assumed that the SDD corresponded to the end of the fifth day of the 10 day SPOT-VGT composite. Although the spatial resolution of the SPOT-VGT and that of the meteorological dataset were almost the same, the associated gridpoints were not equal to each other. We therefore used a nearest-neighbor method to resample the extracted SDDs to the grid of a DEM with a resolution of 1 km. Figure 2 shows the SDD in the winter of 2000, derived from a sequence of SPOT-VGT scenes. We validated this method at more than 100 AMeDAS stations in snowy areas. We found that the satellite-derived SDDs were in agreement with >60% of the AMeDAS stations to within ±5 days and in agreement with >95% of the AMeDAS stations to within ±15 days (Reference Asaoka, Kominami, Takeuchi, Daimaru and TanakaAsaoka and others, 2007). Most of the errors in the satellite-derived SDDs were caused by the fact that the SDD was later than the observed date. We think these discrepancies were due to time lags in the extraction of SDDs; processing of extracted SDDs enabled us to detect cloud-cover conditions and to access post-dated data under clear-sky conditions if clouds covered the land surface on the day of actual snow disappearance.
SDD in 2000 derived from SPOT-VGT.
The normalized-difference snow index (NDSI; Reference Hall, Riggs and SalomonsonHall and others, 1995), one type of snow index, is widely applied for snow detection with visible band (green) and short-wavelength infrared bands. The NDSI was developed based on the reflectance characteristics of snow: the reflectance of snow is high in the green band and low in the near-infrared band. However, the detection of snow with the NDSI is not accurate for a snow-covered area that contains vegetation, because the reflectance in the green band decreases in such areas. It is necessary in such cases to determine the threshold value of the NDSI by referring to the NDVI (Reference Hall, Foster, Verbyla, Klein and BensonHall and others, 1998). The S3 index was proposed to identify snow-covered areas containing vegetation by using visible, near-infrared and short-wavelength infrared bands without reference to the NDVI. Therefore, S3 is more useful for snow-cover detection in snow-covered areas containing vegetation.
4. Results
4.1. Validation with observed SWE
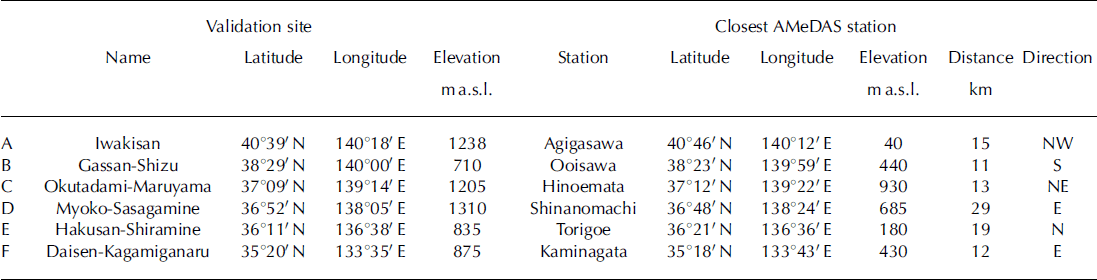
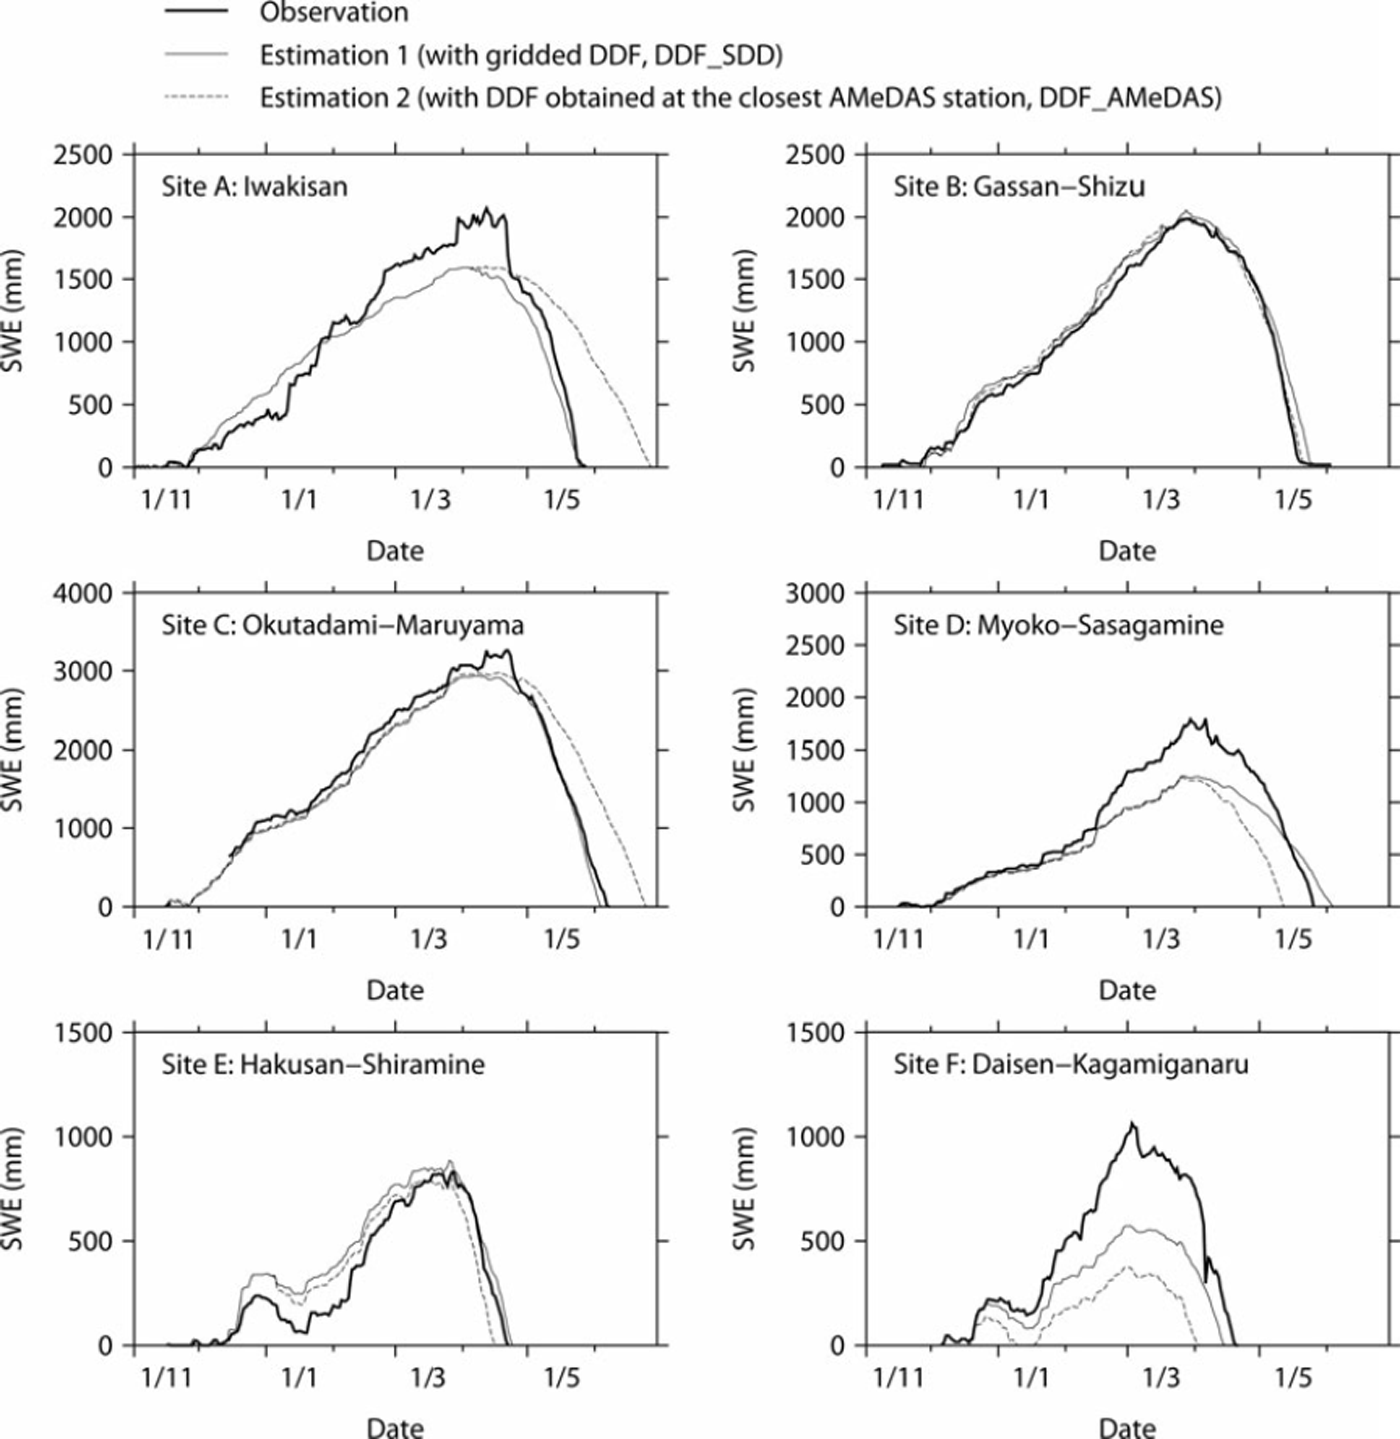
We tested the combination of the gridded DDF and the snow model that utilized the degree-day method by comparing the model results with SWE observations at the six sites shown in Figure 1 and Table 1. SWE data were provided by the National Research Institute for Earth Science and Disaster Prevention (NIED; Reference Yamaguchi, Abe, Nakai and SatoYamaguchi and others, 2011). We conducted two SWE simulations with different DDFs (DDF_SDD and DDF_AMeDAS) to confirm the efficiency of the gridded DDF. DDF_AMeDAS simulations employed the DDF from the AMeDAS station closest to the observation sites described in Table 1, which was optimized from observed temperature and precipitation over the period of observed snow depth of >0cm at the AMeDAS station. We calculated the mean absolute error (MAE) and relative error (RE) for both simulations. MAE and RE were calculated for the period of maximum SWE to SDD because precipitation generally accounts for most of the variation in SWE during the early part of the snow-cover season. Table 2 summarizes the two kinds of DDF and simulation results, and Figure 3 provides a comparison between the simulations and observations. For all sites in Table 2 except site B (Gassan-Shizu), both the MAE and RE for SWE estimation were better with the gridded DDF (DDF_SDD) than with the DDF for the closest AMeDAS site (DDF_AMeDAS). As shown in Figure 3, the SDD estimated by DDF_SDD simulation agreed to within 5 days of the actual SDD for each station except for site D (Myoko-Sasagamine), for which the satellite-derived SDD was 10 days later than the observed SDD. The SWE and DDF were therefore adequately estimated during the mid to late snowmelt season in DDF_SDD simulations. Conversely, because of the differences between the DDF_SDD and DDF_AMeDAS (see Table 2), the SDD in the DDF_AMeDAS simulations was later than the observed SDD by 31 days at site A (Iwakisan) and by 18 days at site C (Okutadami-Maruyama), and earlier by 13 days at site D and by 18 days at site F (Daisen-Kagamiganaru). For sites A, D and F there were large differences in the estimated and observed maximum SWE (RE of the maximum SWE: –25% at site A, –31% at site D and –47% at site F). These differences resulted from underestimation of precipitation and caused relatively large errors in the SWE during the early part of the snowmelt season. Especially noteworthy was the failure of both the DDF_SDD and DDF_AMeDAS models to simulate the abrupt increment of SWE near the peak of the SWE.
Location of observation sites (A–F in Fig. 1) and their closest AMeDAS stations
Validation of daily SWE: thick solid lines indicate observations, solid lines indicate estimation 1 (DDF_SDD) and dashed lines indicate estimation 2 (DDF_AMeDAS). Date format is day/month (of 1999/2000).
Calculated DDFs and summary of two simulations. MAE is the mean absolute error in the SWE during the time interval from the maximum SWE to the SDD. RE is the relative error in SWE from the maximum SWE to the SDD. Estimation 1 (DDF_SDD) is the result of the SWE simulation using the DDF obtained by the approach presented in this study. Estimation 2 (DDF_AMeDAS) is the result of the SWE simulation using the DDF obtained at the AMeDAS stations closest to the observation sites
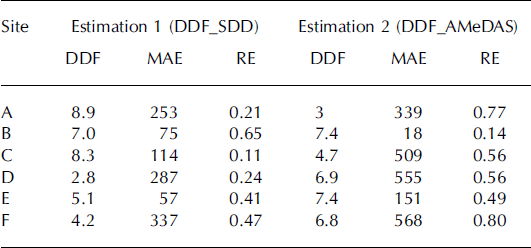
For site B (Gassan-Shizu), both simulations were highly accurate and there were quite small differences between the MAE and RE of the two simulations. The error of 3 days in the SDD for site B caused a large RE during 3 days despite a small absolute error.
4.2. Spatial SWE and DDF distribution
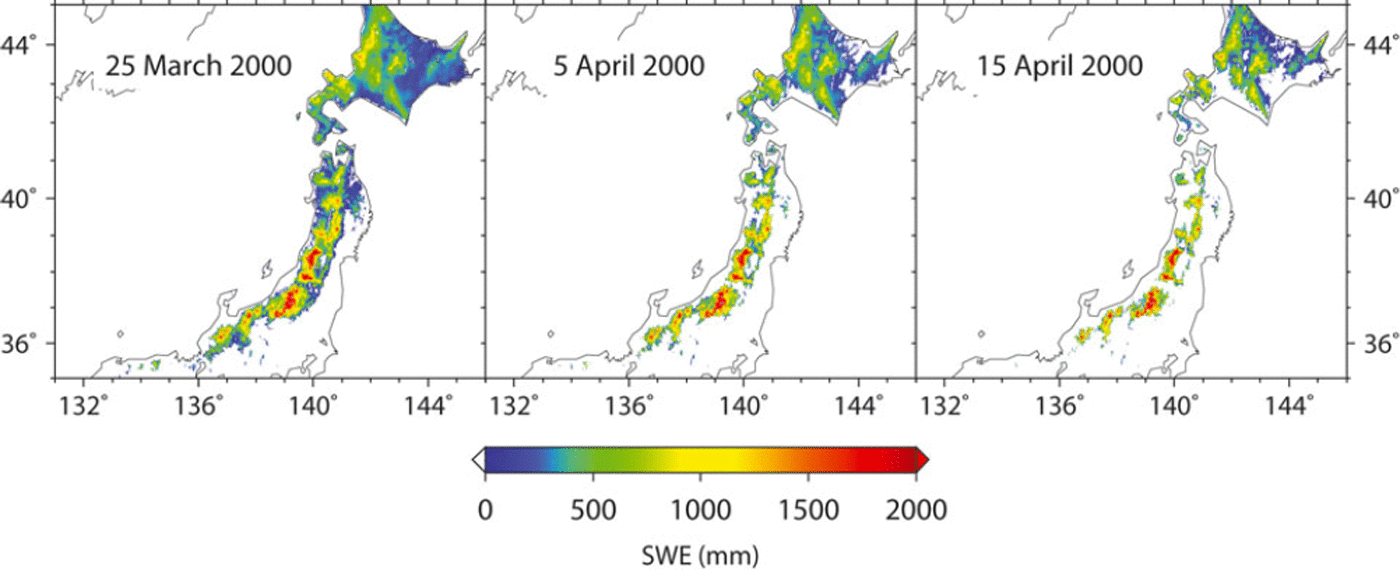
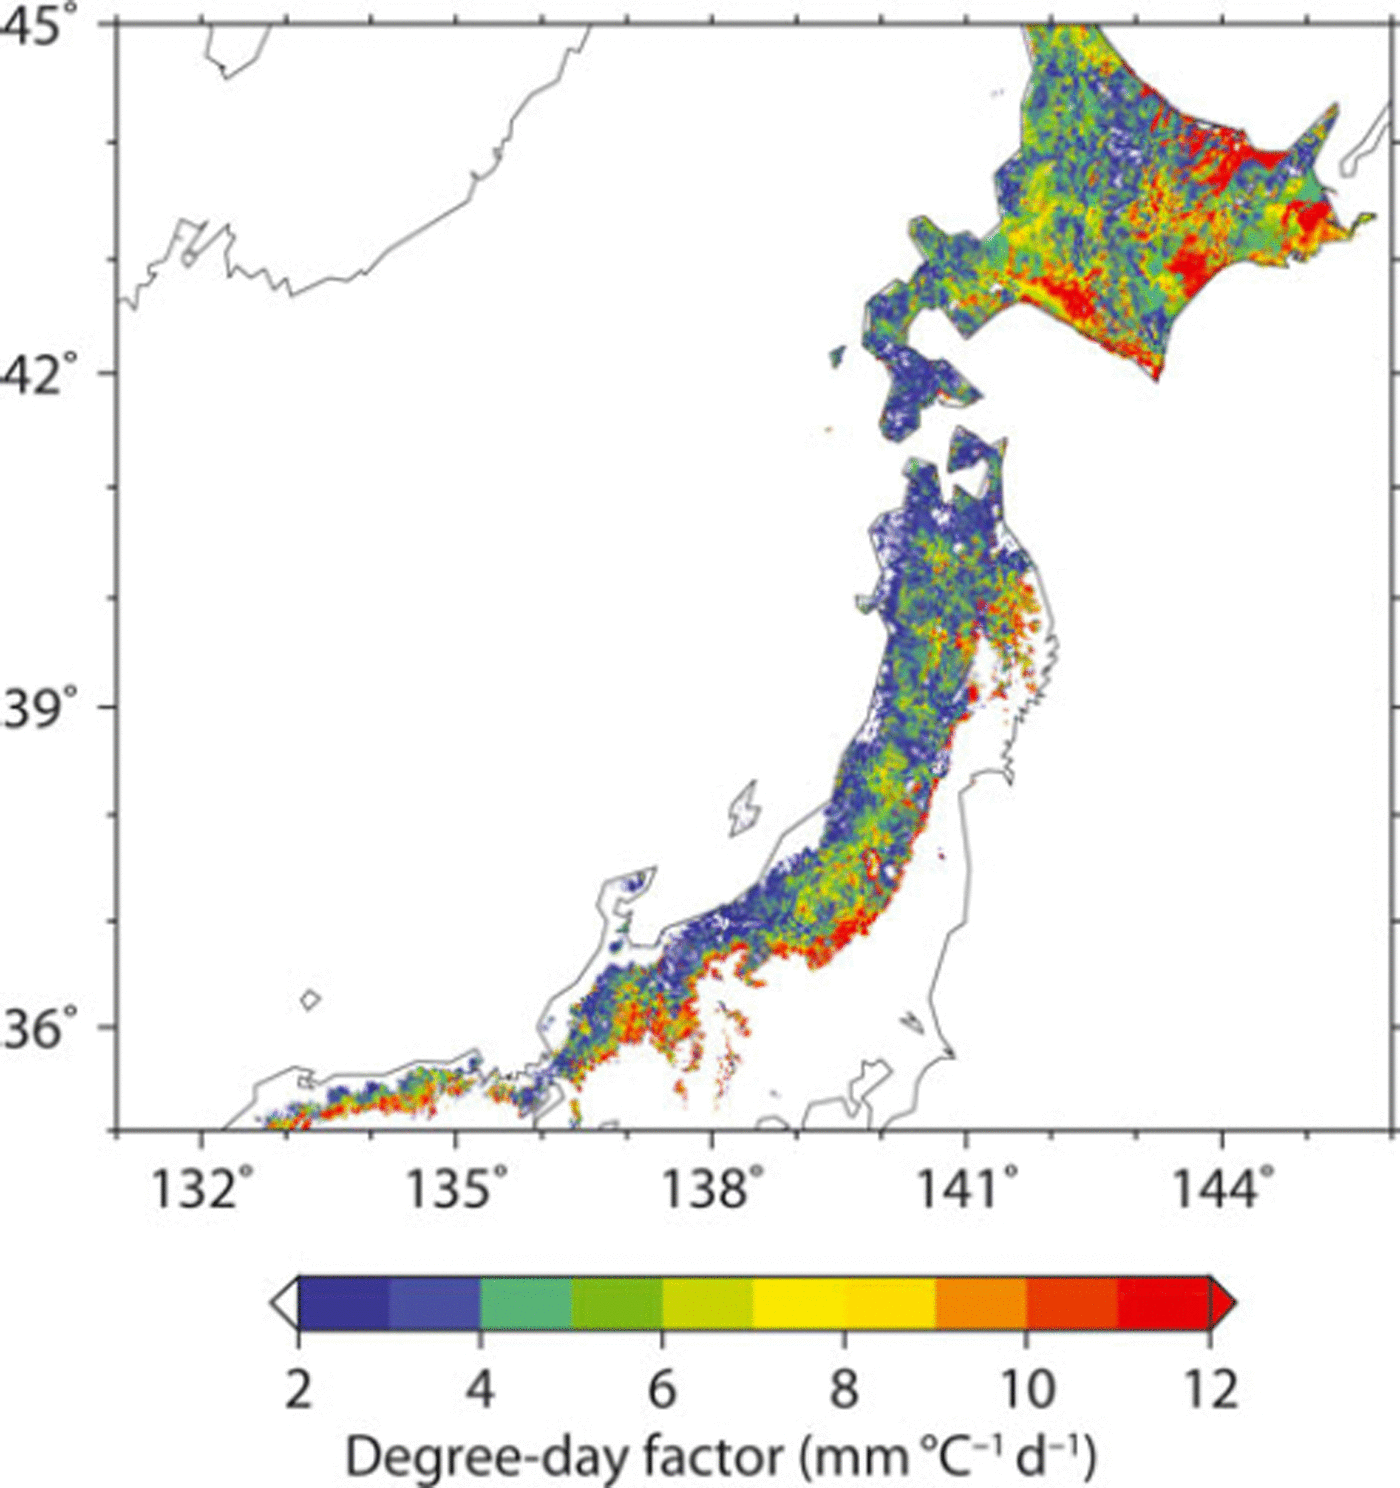
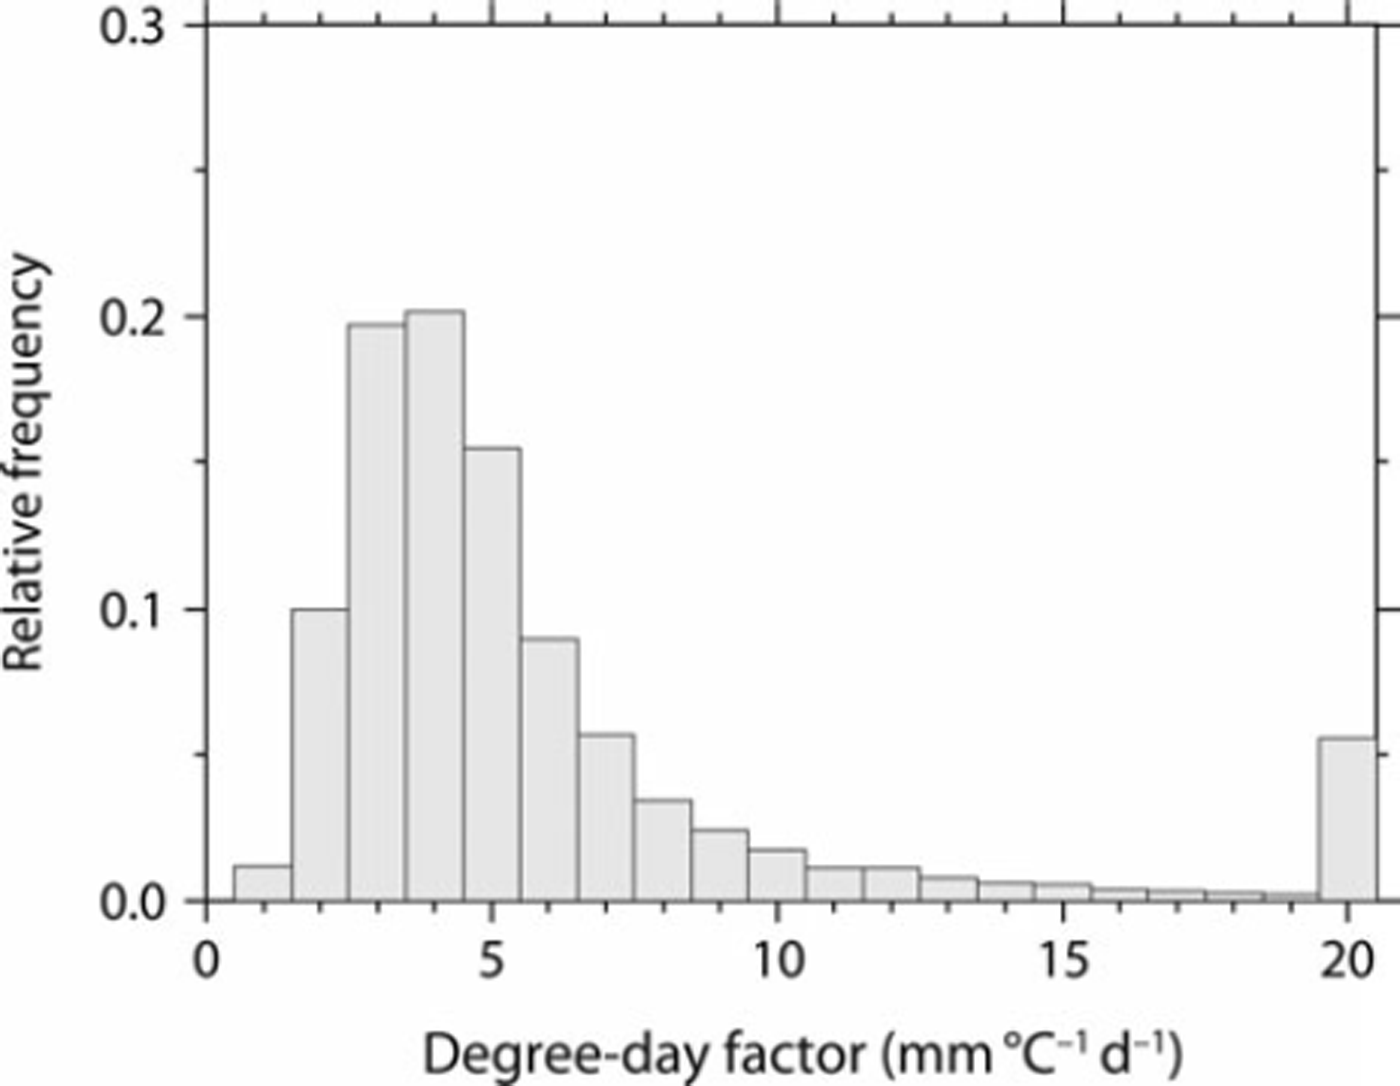
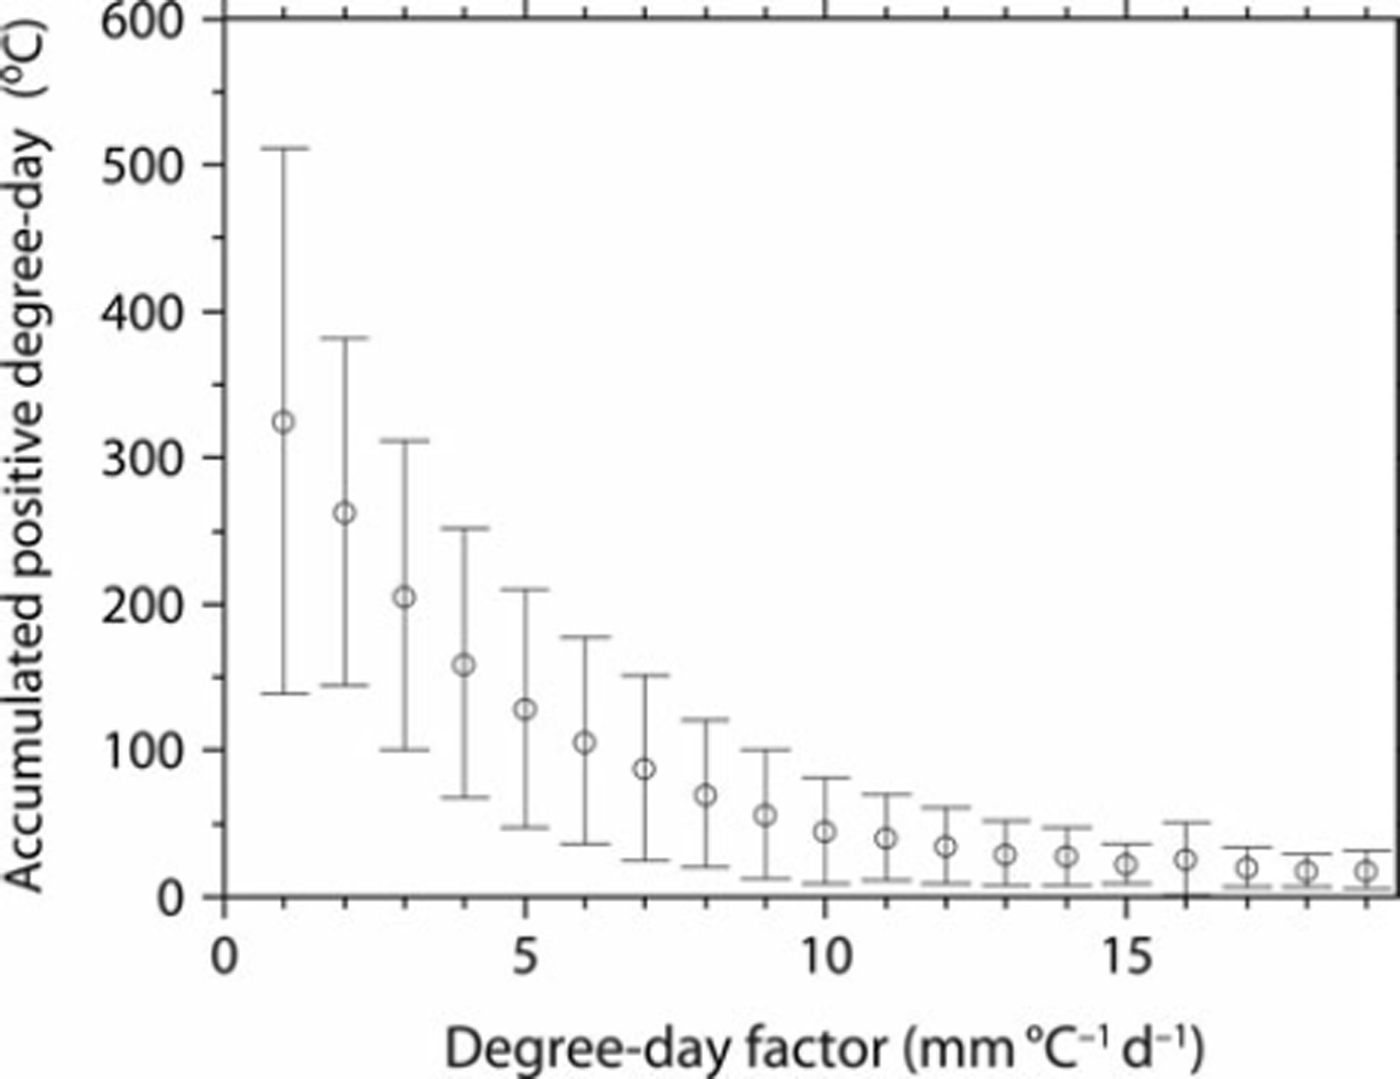
Figure 4 illustrates the spatial distribution of the SWE on 25 March, 5 April and 15 April for the winter of 2000 estimated by the SWE model with gridded DDFs. The combination approach of gridded DDFs and the snow model assimilate the estimated SDD with satellite-derived SDD. On the Sea of Japan side of Japan’s central mountain spine the seasonal snowline, which is the boundary between the SCA and the no-SCA, extended to the lowlands, whereas in comparison on the Pacific Ocean side of Japan’s central mountain spine the seasonal snowline remained at a higher elevation. After April, snow cover disappeared in lowland areas but remained in mountainous areas. The spatial DDF distribution for the winter of 2000 is illustrated in Figure 5. On the Sea of Japan side the DDF was ∼3 m m °Cd−1 in the lowlands and increased at higher elevations, whereas on the Pacific Ocean side the DDF in mountainous areas was greater than the spatial average, especially around the seasonal snowline where it was >10mm°C−1 d−1. Moreover, in the vicinity of 43° N, the DDF was also high (>12 mm°C−1 d−1), despite lowlands. Figure 6 represents the relative frequency of gridded DDF. Mean DDF was 5.8 mm (°C)−1 d−1, and its standard deviation was 4.5 mm (°C)−1 d−1. Figure 7 illustrates the relationship between DDF and mean accumulated positive degree-day (APDD) for each rank of DDF. Mean APDD tended to decrease with increasing DDF, and APDD had large variation (high standard deviation) in low DDF, small variation (low standard deviation) in high DDF and was constant in DDF of >12. Relatively low DDF around the seasonal snowline on the Sea of Japan side of Japan’s central mountain spine resulted from high APDD due to lowlands, while high DDF around the seasonal snowline on the Pacific Ocean side resulted from low APDD due to high elevation. The Pacific Ocean side over 43°N also had high DDF due to low APDD. Note that this study analyzed the grids for which the SDD occurs in March. In the grids for which the SDD occurred before February, snowfall events were in most cases associated with snow cover followed by snow disappearance; therefore, snow cover and its disappearance were likely to occur within 10 days. Thus, their repetition was not suitable for the 10 day composites of SPOT-VGT.
Estimated SWE distributions on 25 March, 5 April and 15 April 2000.
Spatial distribution of calculated DDFs.
Relative frequency of calculated DDFs.
DDF and mean APDDs. Vertical lines indicate one standard deviation.
Note that there are many ways to compute DDFs, and the calculated values may be sensitive to the way in which they are derived (Reference HockHock, 2003). Bottom snowmelt, which occurs because of constant feed of ground heat, generally peaks at the beginning of snow cover and gradually declines by the SDD. In our study we did not consider bottom snowmelt and did not estimate snowmelt below a daily mean temperature of 0°C. Thus the calculated DDF is expected to be slightly high because of the allocation of bottom snowmelt during the period of subzero temperatures to the period when temperatures were >0°C.
5. Discussion
Reference Kominami, Tanaka and Endo Yand NiwanoKominami and others (2005) demonstrated that the snow model used in this research, with DDFs obtained from the closest station, could estimate well the spatial distribution of SWE only in lowlands because most AMeDAS stations were situated in lowlands. Therefore, in this study six observation points were selected for validation of model results in mountainous areas. The validation of the SWE demonstrated that the snow model with gridded DDF successfully estimated the SWE at most observation sites in mountainous areas, which are associated with elevations different from the closest AMeDAS, especially at sites A and C (Table 1). The relationship between snowmelt rate and APDD varies with the partitioning of energy components. The proportion of sensible heat flux in mountainous areas is different from that in lowlands. Therefore, DDFs obtained at the closest AMeDAS station may not accurately represent the relationship between snowmelt rate and temperature in areas outside the narrow range of heat balance at sites used to derive the DDF. Because we determined gridded DDFs by using satellite-derived SDDs at 1km resolution and interpolated temperature and precipitation data from AMeDAS sites, we obtained DDFs better suited for spatial estimation in mountainous areas.
Model input for each observation site was common to both simulations, and differences in results were caused by differences in DDFs. Moreover, the accuracy of gridded DDFs depends on the accuracy of satellite-derived SDDs because this approach assimilates the SDDs simulated by gridded DDFs with satellite-derived SDDs. We used 10day composites of SPOT-VGT data and assumed that the calculated SDD corresponded to the end of the fifth day during the 10day period. The errors of the calculated SDDs were therefore 5 days at most, an uncertainty that is acceptable in terms of application to spatial snow modeling over large areas. However, the SDD at site D extracted from SPOT-VGT had an error of 10 days, probably because the land surface was covered by clouds when the snow disappeared and clouds did not cover the land during the following 10 day period. We have also noticed this delay at a few points throughout the whole AMeDAS dataset because there is heterogeneity within the 1 km resolution of SPOT-VGT and the point data do not represent the domain around the gridpoint (Reference Asaoka, Kominami, Takeuchi, Daimaru and TanakaAsaoka and others, 2007). Reference Molotch and MargulisMolotch and Margulis (2008) also mentioned that the finer-resolution satellite images were less affected by mixed pixel issues than coarse-resolution satellite images. Use of satellite images with finer spatial resolution than SPOT-VGT and daily overpass intervals (e.g. MODIS images at 500 m resolution) may allow highly accurate detection of SCA and lead to the determination of more appropriate DDFs.
The accuracy of SWE simulation with snow models reflects the accuracy of the precipitation information required for model input. Underestimation of maximum SWE implies underestimation of the precipitation data input to the model. In general, the magnitudes of snowfall events in mountainous areas do not directly correspond to snowfall events in lowlands because some regional snowfall occurs only in mountainous areas. We interpolated precipitation data for model input with AMeDAS data. Interpolated precipitation is supposed to be zero if there is no precipitation at AMeDAS stations. As stated above, most AMeDAS stations are in lowlands. Interpolation of precipitation from lowland stations cannot account for regional snowfall events in mountainous areas when there is no snowfall in the lowlands. A limitation on the interpolation of precipitation therefore results from the lack of precipitation gauges in mountainous areas and leads to uncertainty in the determination of gridded DDFs and SWE estimation.
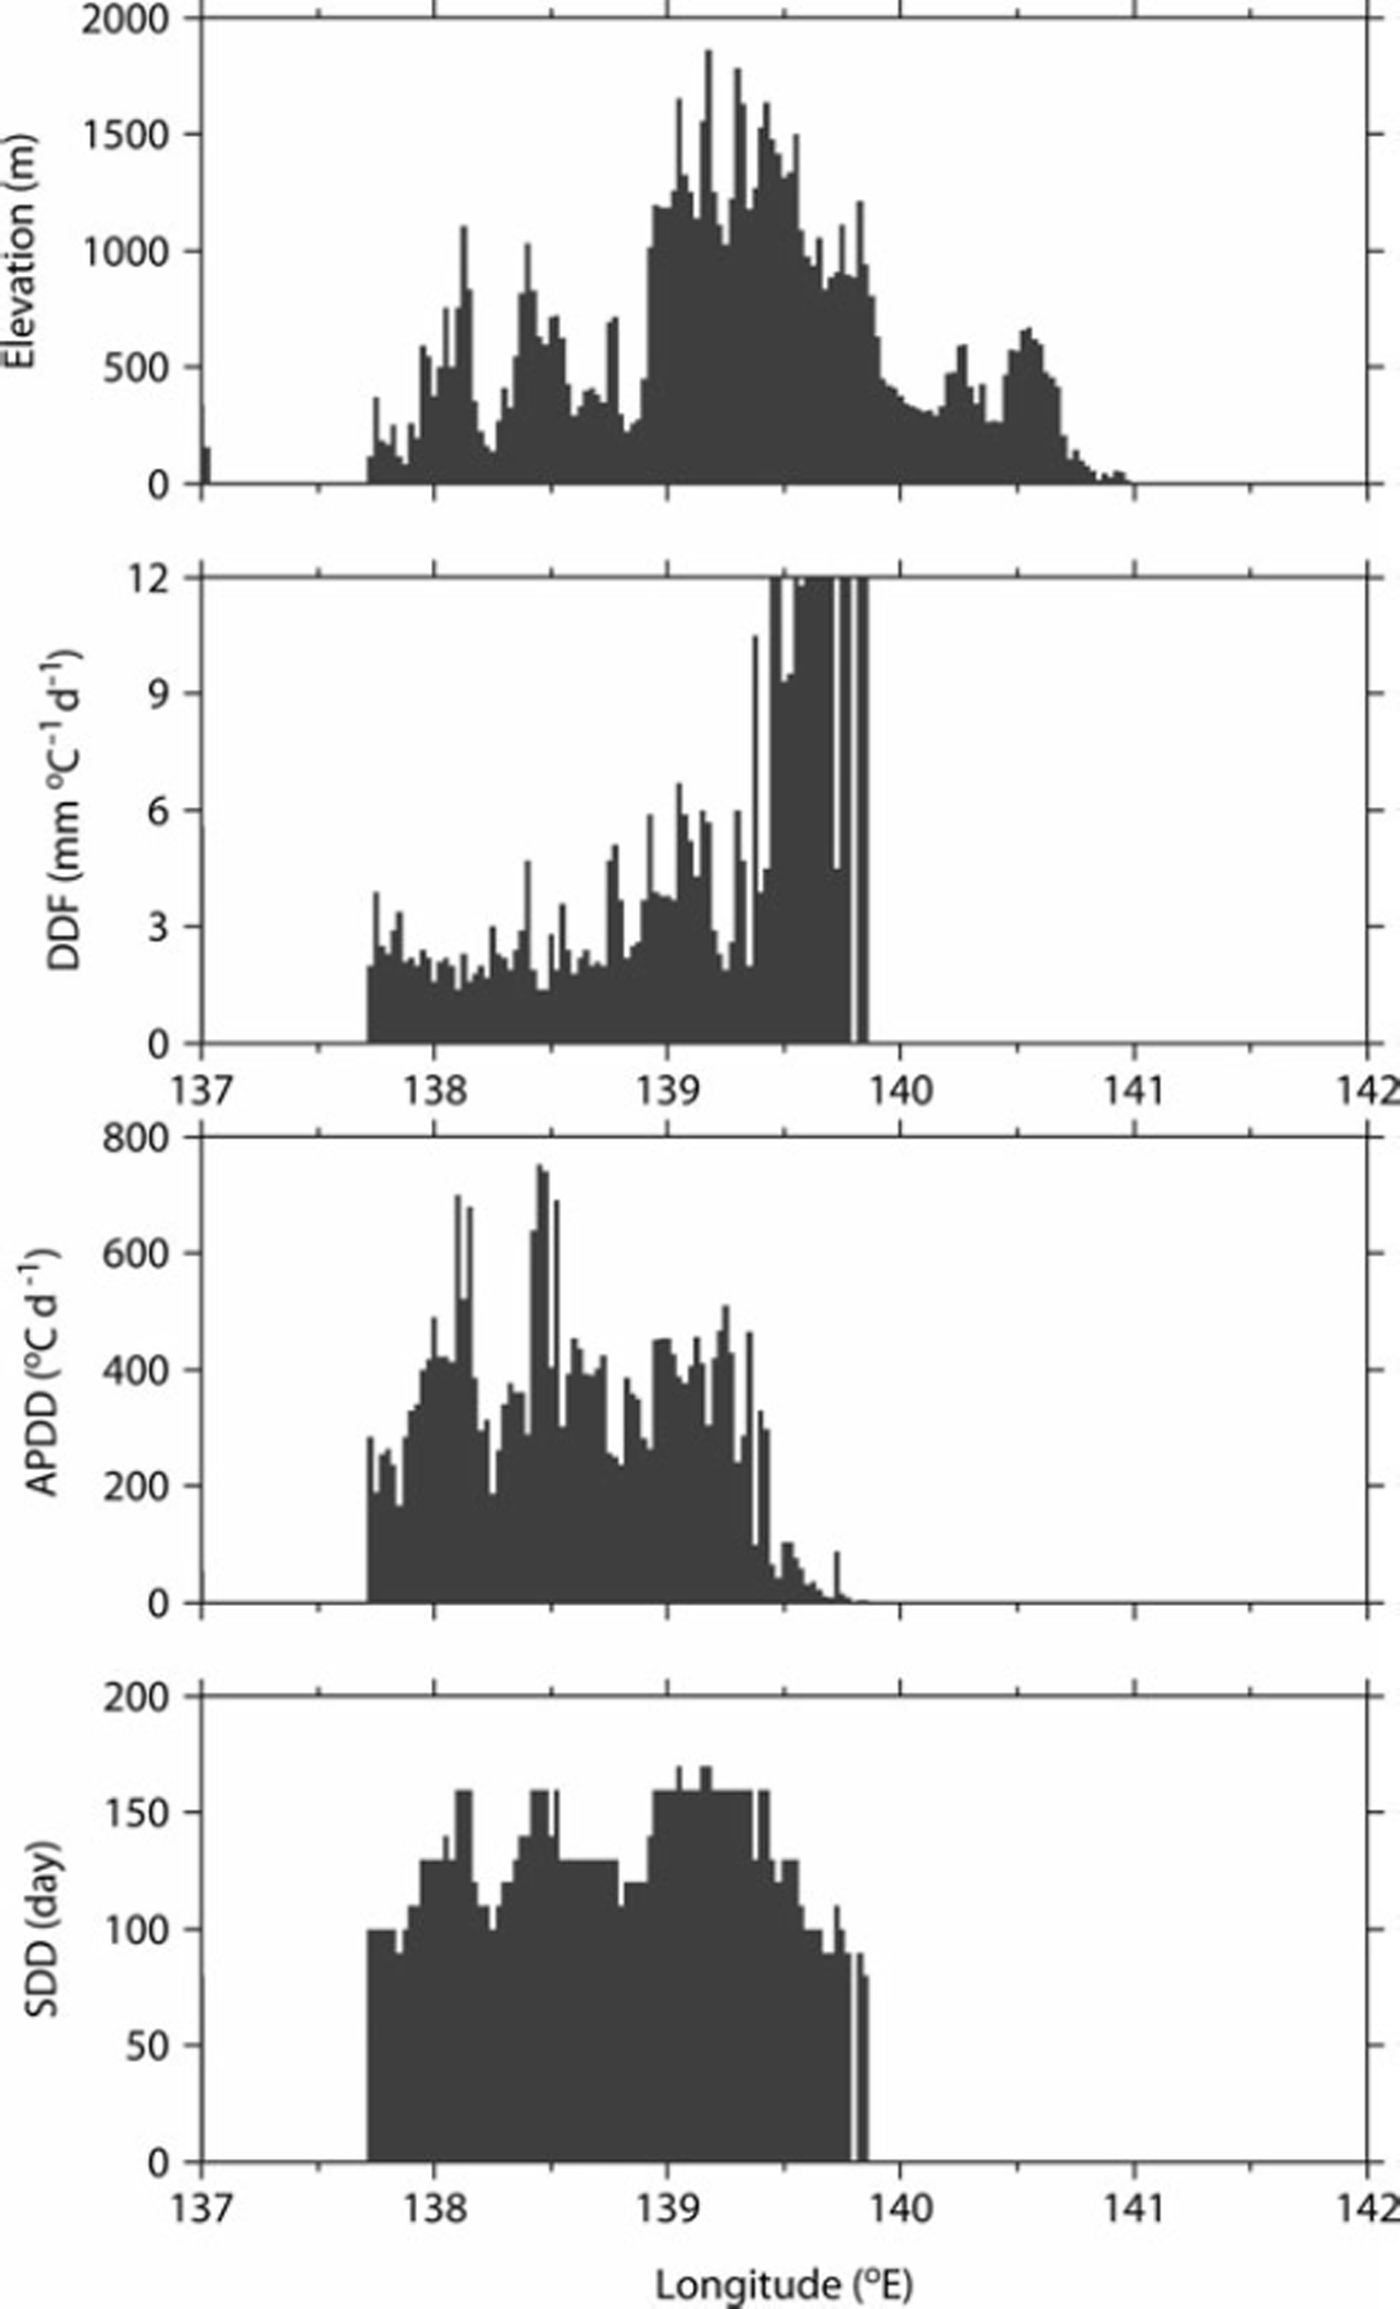
Variations in DDF can result from the contribution of individual energy components to snowmelt. Although DDFs vary both spatially and temporally, we assumed gridded DDFs to be constant during the snow-cover season and we discuss our results with respect to the main energy fluxes that contribute to snowmelt. Figure 7 shows that high DDFs occurred only at lower temperatures. Reference BraithwaiteBraithwaite (1995) reported similar results from numerical simulations of DDFs by energy-balance modeling. Moreover, the negative correlation between DDF and APDD is in agreement with Reference AmbachAmbach (1988). The main energy components that contribute to snowmelt are likely solar radiation at low temperatures, low albedo and limitation of sensible heat flux (Reference HockHock, 2003). Therefore, DDFs do not depend on temperature, and DDFs are high when APDDs are low. Conversely, low DDFs with high APDDs are likely attributable to the relatively high component of sensible heat flux for melting snow. Figure 8 shows the elevation, DDF, APDD and SDD in a cross section of Japan at 37° N. We attribute the relatively low DDF and high APDD in the lowlands compared with the mountainous areas on the Sea of Japan side to the greater contribution of sensible heat flux in the lowlands, whereas the relatively high DDF and low APDD in the mountainous areas reflect the reduced role of sensible heat flux in the mountains. Moreover, on the Pacific Ocean side, the DDF is very high near the seasonal snowline because of the greater importance of solar radiation and the limited contribution of sensible heat flux; the SWE is lower and the SDD is earlier than is the case near the seasonal snowline on the Sea of Japan side. At ∼43° N, the fact that the DDFs are notably high despite lowlands with low APDD also results from the large role of solar radiation and limited contribution of sensible heat flux because of the lower SWE and earlier SDD. These results imply that the gridded DDF adequately reflects the dominant energy fluxes associated with snow-melt during the winter, especially solar radiation and sensible heat flux.
Horizontal distribution of elevation, DDF, APDDs and SDD at 37°N zone.
6. Conclusion
Although the degree-day method is widely used for spatial snowmelt estimation, DDFs obtained from point measurements may not be applicable over large areas because DDFs vary greatly as a function of topographic and climatic conditions. We have proposed a method to obtain spatial DDFs by incorporating satellite-derived SDDs into the degree-day method. Since this method requires a series of meteorological data and SDD information, DDFs are obtained after acquisition of these datasets. However, DDFs obtained using this approach are effective for reconstruction of spatial SWE and analysis of snowmelt runoff over large areas (>100000 km2) because it allowed definition of gridded DDFs that were assumed to be constant during the snow-cover season and more adequately reflected regional characteristics than DDFs obtained from point measurements. Validation at observation sites demonstrated that incorporating satellite-derived SDD in the degree-day method improved estimation of the seasonal variations in SWE for large areas and mountainous areas, notably even at sites at elevations different from the closest measurement site. These results suggest that incorporating satellite-derived SDDs into the degree-day method decreases uncertainty compared with spatially constant DDFs that are obtained from point measurements.
Results of the application of this model to Japanese cold regions revealed that gridded DDFs were negatively correlated with APDDs and high DDFs occurred only at low APDDs. These results imply that the high DDFs resulted mainly from the contribution of solar radiation to melting snow and the limitation of sensible heat flux at low temperatures, and low DDFs resulted mainly from the contribution of sensible heat flux at high temperatures. The implication is that the proposed method to determine gridded DDFs also approximately accounts for the main component of the energy balance for melting snow during the snow-cover season.
Further work is necessary to compare the method presented here with SWE products derived from passive microwave sensors such as the AMSR-E for the validation of the regional quantity of SWE in some areas, because the proposed method was validated with observations of SWE for a limited number of sites. Furthermore, SWE needs to be reconstructed since 1998 with archived SPOT-VGT data for the evaluation of climate variability and water budgets.
Acknowledgements
This study was financially supported by the Science and Technology Research Partnership for Sustainable Development (SATREPS) of the Japan Science and Technology Agency (JST) and the Japan International Cooperation Agency (JICA), and the Global Environment Research Fund (GERF) of the Ministry of the Environment of Japan. We thank Nobuyuki Tanaka and Hiromu Daimaru of the Forestry and Forest Products Research Institute for valuable comments and helpful support. We thank Satoru Yamaguchi of the National Research Institute for Earth Science and Disaster Prevention for providing snow observation data.



