What motivates people to vote strategically? As one of the most consistent findings in electoral politics, Duverger’s law (Duverger Reference Duverger1954) remains the basis for much of the literature on party systems. Simply stated, Duverger’s law is that one-round single-member districts (SMDs) will lead to two-party competition, whereas larger district magnitude under proportional representation (PR) will produce a multiparty system. Because there can be only one winner in SMDs, smaller parties tend to drop out or align with larger parties that have a greater chance of victory. Similarly, voters are unlikely to support candidates who have little chance in winning. Thus, rational voters who are partial to smaller parties are expected to vote strategically, defecting from their first choice and voting for their second choice as a means to maximize their influence on the election and to avoid their least-desired outcome (Cox Reference Cox1997).
Duverger’s law appears to hold in a vast array of countries using SMDs (Amorim-Neto and Cox Reference Amorim-Neto and Cox1997; Taagepera and Shugart Reference Taagepera and Shugart1993), whereas the empirical record in mixed legislative systems—which allocate seats to both SMDs and by PR to the same chamber—is less straightforward (Ferrara, Herron, and Nishikawa Reference Ferrara, Herron and Nishikawa2005; Shugart and Wattenberg Reference Shugart and Wattenberg2001). Deviations often are explained as parties and voters responding to a larger competitive environment—for example, the influence of a directly elected president (Shugart and Carey Reference Shugart and Carey1992) or federal systems (Lago and Montero Reference Lago and Montero2009). Despite caveats and counterevidence (Grofman, Blais, and Bowler Reference Grofman, Blais and Bowler2009), Duverger’s law appears well supported in stable democracies and when analyzed at the district level.
A sizable literature identifies institutional settings for strategic voting in SMDs and beyond, as well as conditions for strategic voting. Five conditions must be met for strategic voting: voters must (1) have preferences among candidates, (2) see an acceptable alternative to their first choice, (3) have information about candidate viability, (4) expect the outcome to be close, and (5) believe that their actions can be decisive (Acevedo and Krueger Reference Acevedo and Krueger2004; Cox Reference Cox1997; Darmofal Reference Darmofal2010). If, for example, voters realize that their preferred candidate cannot win and shifting support will not likely change the result of the election, a sincere vote is still expected.
Polls in particular play a vital role in strategic voting. For example, nonscientific polling in young democracies and the general lack of candidate information may lead to false expectations regarding viability. Forsythe et al.’s (Reference Forsythe, Myerson, Rietz and Walker1993) experimental voting analysis found that in the absence of polling information, election results did not correspond to Duverger’s law, whereas Endersby and Shaw (Reference Endersby and Shaw2009) found that the inclusion of preelection polls led to largely consistent results. Similarly, Meffert and Gschwend (Reference Meffert and Gschwend2011) found that participants could translate poll information into reasonable election forecasts. Polls have the potential to create both bandwagon and underdog effects; however, at the very least, they provide additional information about the likelihood of an individual’s preferred candidate winning. However, expectations also are heavily shaped by political preferences (Blais and Turgeon Reference Blais and Turgeon2004; Gimpel and Harvey Reference Gimpel and Harvey1997), and conflicting information may encourage wishful thinking (Babad Reference Babad1995). Furthermore, it remains unclear about the level of polling literacy that is necessary to influence strategic voting and whether, for example, individuals need to comprehend margins of error to vote strategically.
A major limitation in analyzing strategic voting is that in most elections using SMDs, even if other nominal candidates run, the majority of voters are likely to already be supporting one of the top two candidates. Thus, these voters are unlikely to be in a situation to vote strategically. Duverger’s law, of course, also expects strategic entry and exiting of parties in SMDs. With only two candidates in many district elections in the United States and elsewhere, a voter cannot vote strategically in the traditional sense. Under these conditions, most estimates suggest that 5% to 15% cast a strategic vote (Meffert and Gschwend Reference Meffert and Gschwend2011; see also Alvarez, Boehmke, and Nagler Reference Alvarez, Boehmke and Nagler2006). Experimental designs, therefore, seem particularly suitable for studying strategic voting and identifying at what point people shift from sincere to strategic voters. However, despite their growing number, these experimental designs (e.g., Bassi Reference Bassi2008; Endersby and Shaw 2008; Hizen et al. Reference Hizen, Inukai and Kurosaka2010) focus primarily on whether results converge to two-party competition. This leaves largely untested the identification of strategic voting behavior at the individual level meeting the conditions to vote strategically.
Polls have the potential to create both bandwagon and underdog effects; however, at the very least, they provide additional information about the likelihood of an individual’s preferred candidate winning.
RESEARCH DESIGN
This analysis uses an embedded experiment within a web survey as a means to analyze strategic voting in general and the influence of polling information more specifically. Whereas early experimental studies of strategic voting often used as few as 20 subjects with multiple rounds of voting, this analysis recruited 128 American respondents through Mechanical Turk. Similarly, experimental work often assigns voters’ ideal points to induce strategic behavior. Instead, this project works around the issue by imposing a situation in which all respondents are expected to at least consider strategic voting. This is accomplished, first, by having three district candidates and, second, by manipulating the polling data, which suggests a realistic opportunity to influence the outcome of the election through strategic voting. This design also attempts to circumvent another potential problem. In the absence of polling, knowledge of how a party or candidate fared in previous elections may signal viability. However, by eliminating partisan affiliation and names from the three candidates, respondents should be forced to rely more on other information provided in the survey. By including demographic as well as partisan-identification questions, this study attempts to unpack which factors influence voters.
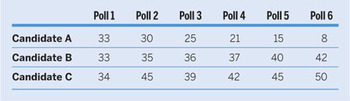
After being informed that their previous answers to demographic and partisan questions produced a rank ordering of the candidates, respondents then are asked to evaluate a hypothetical legislative election Footnote 1 in which there will be only one winner in their district. In actuality, the partisan questions have no effect on this ordering; rather, they are presented solely to encourage respondents to identify with the abstract candidates. Candidate A is identified as the most ideologically similar, Candidate B as less similar, and Candidate C as the most different. Respondents then are told that poll data for this hypothetical upcoming election will be presented as six polls in chronological order on separate pages, with the last poll closest to the election. Candidate A’s support declines with each poll. The polling numbers were chosen specifically to produce situations in which respondents should feel increasingly inclined to choose Candidate B if Duvegerian pressures to vote strategically dominate. Table 1 lists the polling numbers presented to respondents in each poll.
Polls Presented in Survey (%)

Before seeing the polls, respondents were assigned randomly to one of three prompts as a means to gauge the influence of polling information. The first prompt receives no additional information, the second receives a note on the margin of error, and the third includes the margin of error as well as a claim regarding the success of trailing candidates. The exact wording of each prompt is as follows:
-
Version 1 (V1): You will be presented with the first poll on the next page.
-
Version 2 (V2): You will be presented with the first poll on the next page. The election polls presented have a margin of error of +/- 3%.
-
Version 3 (V3): You will be presented with the first poll on the next page. The election polls presented have a margin of error of +/- 3%. Historically, candidates behind by 10% or more in later polls did not win the election.
It was expected that increased information (i.e., V3 > V2 > V1) would encourage strategic voting and, conversely, diminish sincere voting. Including the margin of error may encourage wishful thinking; however, in line with prospect theory (Kahneman and Tversky Reference Kahneman and Tversky1979), people may interpret the margin of error as a worst-case scenario—especially when confronted with polls showing declining support for their preferred candidate. If there is no distinction present among the three versions and strategic voting is commonplace, this suggests that people need minimal information about candidate viability to shift their vote choice.
ANALYSIS
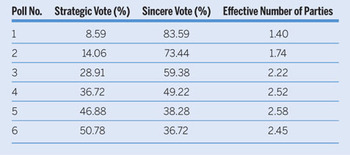
Table 2 summarizes the rates of strategic voting in each round. Strategic voting is operationalized here as choosing Candidate B over Candidate A. By this definition, votes for Candidate C are neither sincere nor strategic. It is not surprising that strategic voting increases with each round, from less than 20% in the first two polls (in which Candidate A remains viable) to slightly more than 50% in the sixth poll. The biggest increase in strategic voting rates occurred in Polls 2 and 3, in which Candidate A is presented as 11 points behind Candidate B and 14 points behind Candidate C. Although preliminary, this evidence suggests an informal cognitive threshold in which respondents still maintain a level of wishful thinking about Candidate A’s potential to at least surpass Candidate B. Based on Laakso and Taggepera’s 1979 study, table 2 also transforms respondents’ choices in each poll into the effective number of parties (ENP), which is a weighted measure of the size of parties (or, in this case, district candidates) based on the percentage of the vote received. Because an ENP between 1.5 and 2.5 usually is seen as consistent with Duverger’s law, these results are largely consistent with theoretical expectations.
Although these results are consistent with strategic voting, they also show that despite ideal conditions, a sizable proportion of respondents remained sincere voters. More surprising is that a non-negligible segment—between 7% and 15%—opted for Candidate C despite ideologically being the least similar to the respondents. Additional tests show that these results were not due simply to a distinction between those with a partisan identity (i.e., Democrats and Republicans versus independents) but rather perhaps consistent with a desire to vote for a winner or viewing the candidates as interchangeable despite being prompted about ideological differences.
Summary Data by Poll

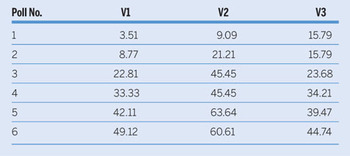
To identify the extent to which polling information influences voter choice, table 3 separates strategic voting rates by the version of the polling prompt that respondents received. Version 1 (V1), in which respondents were given no additional information, shows the lowest overall levels of strategic voting. Version 2 (V2), in which voters were simply presented with the margin of error, shows the highest overall rates of strategic voting, more than twice the rates of V1 in the first two polls and an 11- to 21-point gap in later polls. Version 3 (V3), in which respondents are given the margin of error and the historical record for trailing candidates, shows the highest rates of strategic voting in the first round. However, V3 rates fail to surpass those of V2 in any subsequent version, with results in Polls 3 through 6 similar to V1. Overall, this finding suggests that even minor additions to polling information (e.g., reminding respondents of the margin of error) influence strategic calculations but that not all additional information produces a similar boost.
Strategic Voting Rates (%) and Under Each Polling Prompt

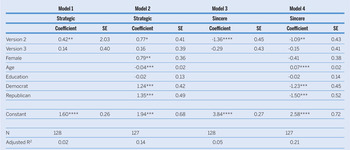
For a more rigorous analysis, I used four OLS regressions with two dependent variables (table 4). The first two used the number of strategic votes; the second two used sincere voting (i.e., voting for Candidate A) across the six polls, ranging from zero to six. Basic models included two independent variables: dummy variables for V2 and V3 of the polling prompt, leaving V1 as the reference category. Extended models included controls for gender (i.e., female), age, education, and dummy variables for partisan identifications of Democrat and Republican, leaving those self-identified as independents as the reference category. The first two models both saw a modest boost in strategic voting when the respondents were told of the margin of error (i.e., V2), significant at 0.10 or stronger, whereas additional information beyond the margin of error (i.e., V3) failed to reach statistical significance. Controls for gender and partisan identification positively correlated with strategic voting, whereas age negatively correlated—all at 0.05 or stronger. A similar pattern was evident in models of sincere voting. V2 of the polling prompt correlated with a reduction in sincere voting at 0.05 or stronger, with similar correlations on the partisan variables.
…minor differences in the framing of polling results appear to influence strategic voting behavior. Furthermore, even in this research designed as the ideal situation for strategic voting, defecting from a voter’s first preference was not as widespread as expected.
Additional model specifications were tested for robustness (omitted here due to space limitations). Controls for the strength of partisan identification, interest in politics, attention to polls, and satisfaction with politics all failed to reach significance or change the main findings of the original models. In particular, the survey did not find those on ideological extremes to be more reluctant to vote strategically because we may expect those voters to not identify an acceptable alternative. Excluding those who opted for Candidate C from the sample also produced results similar to those in the original models. Excluding the first poll (in which all candidates essentially are tied) and/or the last poll (in which strategic voting is least likely to change the outcome) also produced similar results. In summary, minor differences in the framing of polling results appear to influence strategic voting behavior. Furthermore, even in this research designed as the ideal situation for strategic voting, defecting from a voter’s first preference was not as widespread as expected.
OLS Regressions on Strategic Voting and Sincere Voting

Notes: *p<0.10; **p<0.05; ***p<0.01; ****p<0.001.
CONCLUSION
Duverger’s law expects strategic voting away from weak candidates yet does not provide additional clarity about when sincere voters transition to strategic voters. The evidence presented here suggests not only when individuals shift their vote choice but also that what may appear as minor differences in how polls are presented influences rates of strategic voting. Including the margin of error, rather than generating wishful thinking about a preferred candidate, appears to push those considering defection toward their second choice.
Several aspects of strategic voting remain largely unexplored. Although this web survey imposes an ideological ordering of candidates, it does not capture the perceived distance between them. That is, it cannot capture whether respondents assumed that the candidates were ideologically similar (e.g., a center-left, a center, and a center-right candidate) or in a more polarized political space. Future work also should expand on the growing research about how personality traits influence strategic voting (Erisen and Blais Reference Erisen and Blais2014; Gerber et al. Reference Gerber, Huber, Doherty, Dowling and Panagopoulos2013). Furthermore, cross-national survey research that links polls to strategic behavior provides an opportunity to control for additional contextual factors. Nevertheless, these preliminary results suggest ways to expand our understanding of Duvergerian incentives.