1. Introduction
Trapped modes are oscillations of the free surface around a body which are not associated with motion of the free surface in the far field. Early investigations of trapped modes considered fixed structures in a limited domain, such as horizontal (Ursell Reference Ursell1951) or vertical (Callan, Linton & Evans Reference Callan, Linton and Evans1991) cylinders in a channel, while later authors constructed more complicated shapes that enclosed a portion of the otherwise unbounded free surface in 2D (McIver Reference McIver1996) and 3D (McIver & McIver Reference McIver and McIver1997). The related phenomenon of near trapping, in which the local oscillation slowly decays due to weak energy radiation to the far field, was found for fixed bottom-mounted cylinders in (finite) rows (Maniar & Newman Reference Maniar and Newman1997) or circles (Evans & Porter Reference Evans and Porter1997). Experimental confirmation of the presence of these modes was provided for a cylinder in a channel by Retzler (Reference Retzler2001) and Cobelli et al. (Reference Cobelli, Pagneux, Maurel and Petitjeans2011) and for four cylinders in a circle by, for example, Contento et al. (Reference Contento, D’Este, Calcagno and Penna2000).
When trapped modes around floating structures were discovered by McIver & McIver (Reference McIver and McIver2006) a new nomenclature emerged: sloshing-trapped modes were said to occur around fixed structures and motion-trapped modes around floating bodies. Motion-trapping structures that enclosed part of the free surface within axisymmetric shapes of complicated vertical cross-section (McIver & McIver Reference McIver and McIver2007), and later simple rectangular cross-section (Porter & Evans Reference Porter and Evans2008), were found. While motion-trapping structures cannot be excited by incident regular waves at the trapping frequency (as shown by McIver (Reference McIver2005) and investigated experimentally by Kyozuka & Yoshida (Reference Kyozuka and Yoshida1981)), they can be excited given appropriate initial conditions. According to linear inviscid theory, a motion-trapping structure released from rest (at an initial offset from equilibrium) would reach a state of constant-amplitude harmonic oscillation, occurring without motion of the fluid in the far field. Wave-free motion of the structure could be demonstrated by forced oscillation at the trapping frequency (as performed by Chaplin & Porter (Reference Chaplin and Porter2014)), but the true free-floating behaviour could not be observed in this case.
Recently, Wolgamot, Eatock Taylor & Taylor (Reference Wolgamot, Eatock Taylor and Taylor2015) have shown that a ring of eight truncated cylinders moving in heave can closely approximate a motion-trapping structure. It is this structure that will be investigated in the present paper.
2. Experimental set-up and background
A model with eight truncated vertical cylinders with hemispherical bottom ends was tested in the Coastal Basin at Plymouth University’s COAST Laboratory. This rectangular basin measures
 $15.5~\text{m}\times 10~\text{m}$
, with an array of piston-type wavemakers (switched off throughout the present experiments) and a beach on opposite short sides. The water depth was 0.5 m throughout. For each test the model was positioned at the centre of the tank, lifted above the position of hydrostatic equilibrium and then released. The decaying coupled motions of the fluid and heaving structure were then recorded. Before initial release the model was supported by a string attached at the geometric centre of the ring. The string ran over a pulley attached to a beam spanning the tank and was released at the side of the tank using a latch system. In all pre-release positions the hemispherical ends were submerged and an identical angular position in yaw was imposed.
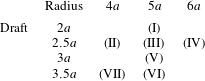
The model comprised cylinders that were constructed from 80 mm radius PVC pipe connected to plastic hemispheres of the same radius. Each cylinder was affixed to a central hub by two parallel arms bolted to the top of the cylinder. This allowed the ring radius to be changed between tests by undoing the bolt and sliding each cylinder along its arms. The model draft was altered by adjusting the ballast level of fluid inside the cylinders. Hence this arrangement permitted testing of a number of different model configurations, one ‘tuned’ configuration expected to exhibit a near-motion-trapped mode and six other geometries of varying cylinder draft and ring radius. These seven configurations are summarised in table 1.
After release the motion of the model was tracked using a six-degree-of-freedom Qualysis optical motion tracking system using reflectors on the model (and on the cross-tank beam as reference). Disturbances of the free surface were measured by wave gauges at seven points. Both measurement systems sampled at 128 Hz. The wave gauge locations and a photograph of the experimental set-up are shown in figure 1.
For a freely floating heaving body to be a motion-trapping structure, two conditions for the frequency-domain hydrodynamic coefficients must be satisfied at the same frequency,
 ${\it\omega}$
. First, the radiation damping,
 $B({\it\omega})$
, should be zero,
 $$\begin{eqnarray}B({\it\omega})=0,\end{eqnarray}$$
and secondly, the heave motion resonance condition,
 $$\begin{eqnarray}-{\it\omega}^{2}(M+A({\it\omega}))+C=0\end{eqnarray}$$
should be satisfied, where
 $A({\it\omega})$
is the added mass,
 $M$
the mass of the structure and
 $C$
the hydrostatic stiffness. Note that an equivalent statement is that a complex resonance in this mode occurs on the real axis of the complex frequency plane (McIver Reference McIver2005). The eight-cylinder structure discussed in Wolgamot et al. (Reference Wolgamot, Eatock Taylor and Taylor2015) formed of a ring of eight truncated cylinders was a near-motion-trapping structure in the sense that the draft of the cylinders could be adjusted to align the frequency at which condition (2.2) was satisfied to the frequency of a mode with extremely low (but non-zero) damping. This corresponds to a complex resonance at a frequency with very small imaginary part.
(a) A photograph of the experimental set-up, with the wave gauges to the right of the picture. (b) Layout of the seven wave gauges used, relative to a ring of radius
 $5a$
, with cylinder radius
 $a$
. Only those gauges referred to in this paper are labelled. Gauges were not moved between tests – gauge A is at radius
 $2.96a$
from the centre of the ring, and gauges B and C at
 $10a$
.

Test matrix of different eight-cylinder configurations tested (cylinder radius
 $a$
). Configuration (I) was tested with release height
 $0.5a$
, configurations (II)–(V) with release heights
 $0.5a$
,
 $0.75a$
and
 $a$
, while configurations (VI) and (VII) were tested only with release heights
 $0.5a$
and
 $0.75a$
. The near-motion-trapped mode occurs for configuration (III).
(a) Heave radiation damping
 $B$
versus non-dimensional wavenumber, where
 $a$
is the radius of an individual cylinder and
 $V$
the total volume of fluid displaced by the body at equilibrium. (b) Mode shape of free-surface displacement (modulus shown) for heave oscillations of unit amplitude at the tuned wavenumber.
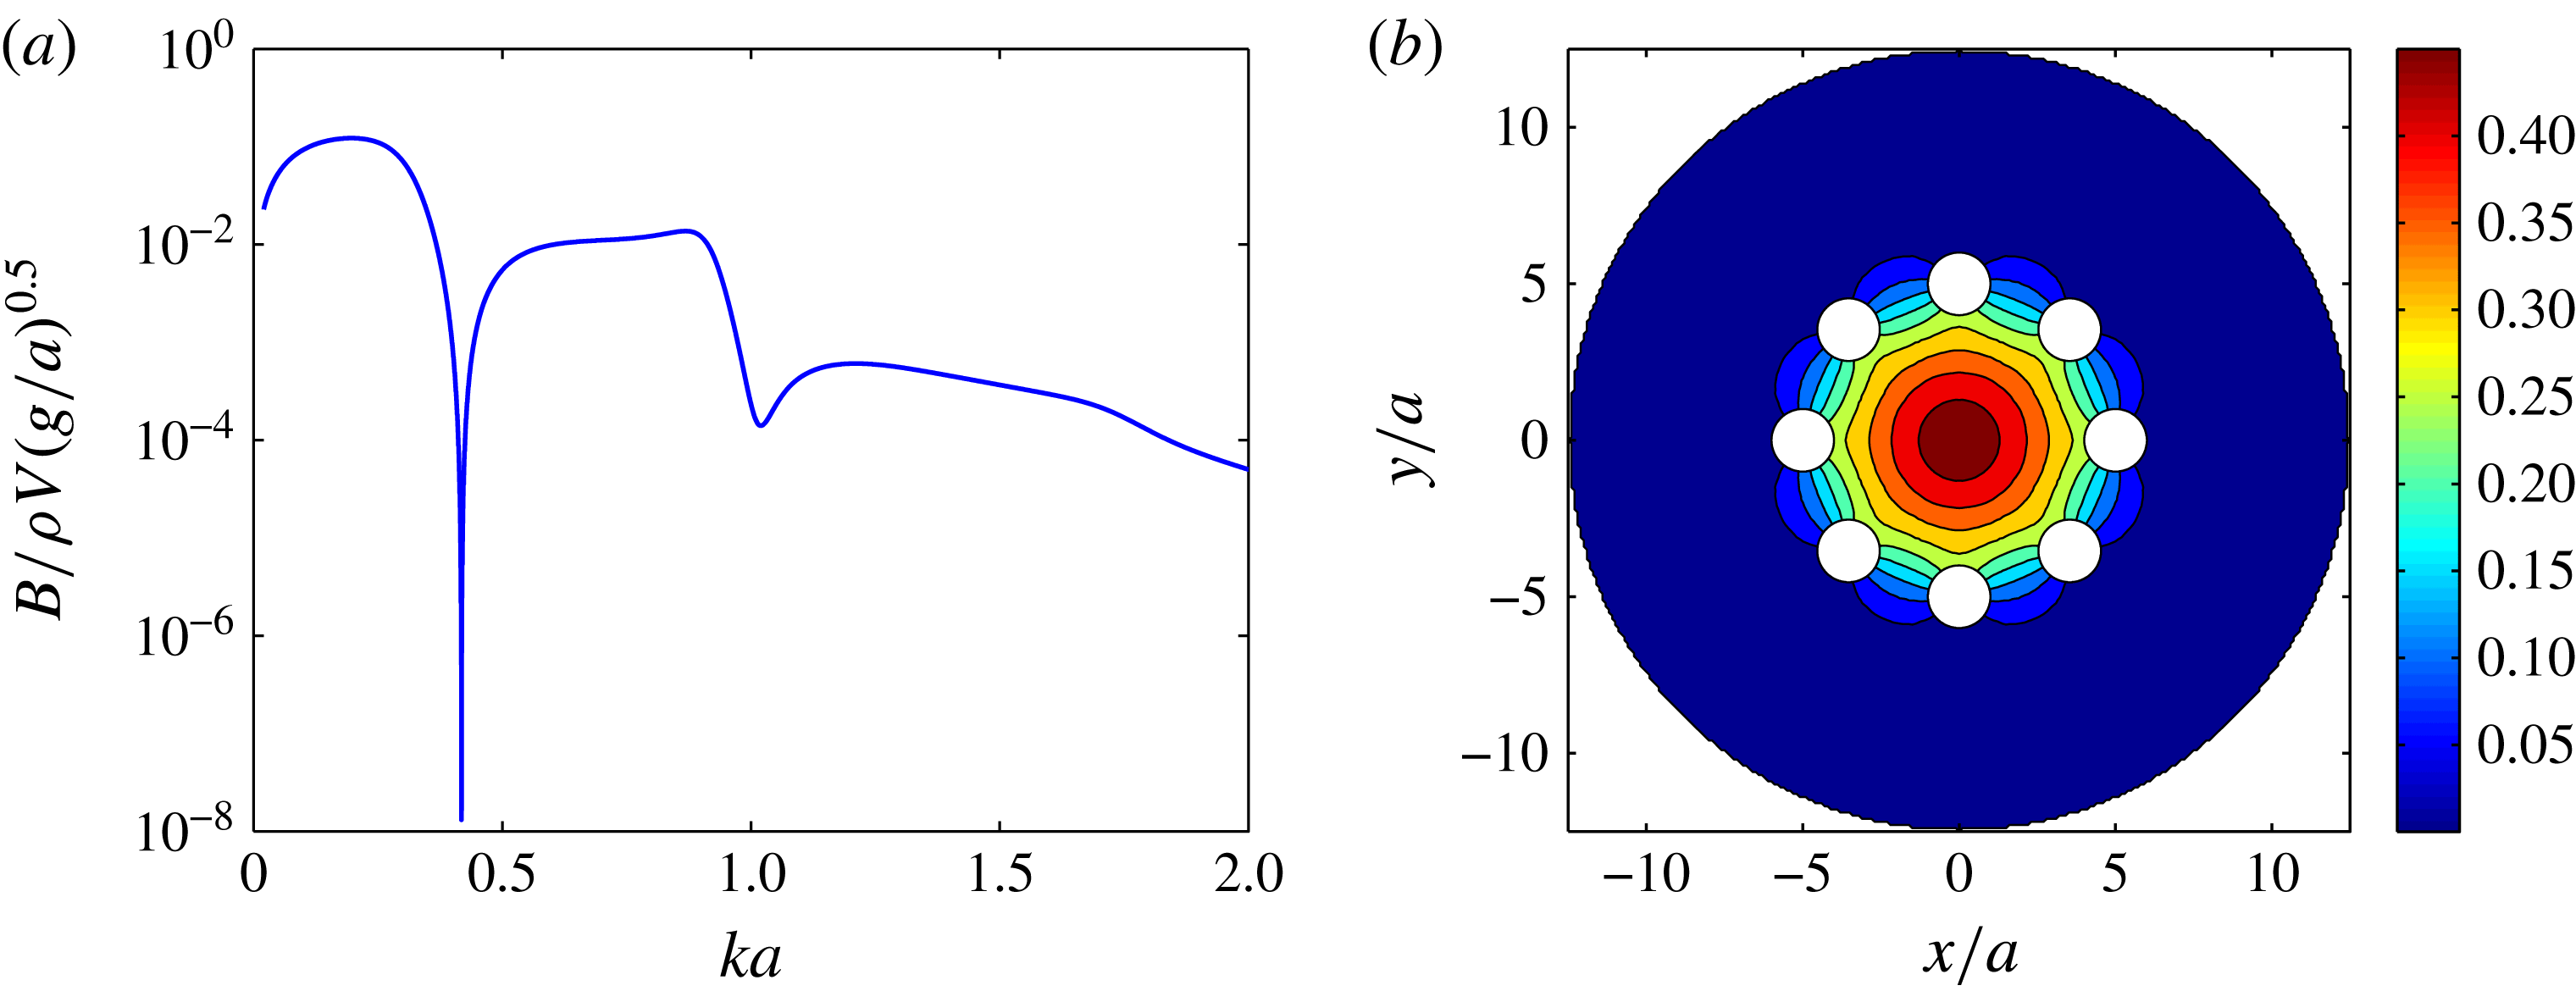
In the present case hemispherical ends have been added to the truncated cylinders to try to reduce flow separation and associated viscous damping of the motion. That a mode with very low damping is present in this modified case may be seen in figure 2(a), which shows the heave radiation damping for a ring of eight cylinders of radius
 $a$
with hemispherical lower ends, ring radius
 $5a$
and total draft
 $2.5a$
, computed using the boundary element code DIFFRACT (see Wolgamot et al.
Reference Wolgamot, Eatock Taylor and Taylor2015). The log scale on the vertical axis in figure 2(a) illustrates the difficulty of obtaining an ‘exact’ match between the frequencies of conditions (2.1) and (2.2). For this case the heave motion resonance occurs at
 $ka=0.416$
. The minimum radiation damping in heave for this geometry occurs for a wavenumber about
 $0.4\,\%$
higher. This mistuning could be corrected by slightly decreasing the cylinder draft, but such fine adjustment was not pursued. As shown in figure 2(b), the free-surface displacements associated with this minimum in damping represent a piston mode, being in phase at all points inside the ring (but in antiphase with the body, see figure 5).
Evidently increasing the draft (i.e. the mass) reduces the frequency at which the structure oscillates, though the hydrodynamic parameters also change. As the configurations are similar, the radiation damping of each resembles figure 2(a), though with minimum damping shifted to higher frequency for a smaller ring radius and vice versa. Thus configuration (VII) is the most ‘detuned’ of the cases given in table 1. This is apparent in figure 3(a), which shows the strikingly different decaying body motions for the near-motion-trapping geometry (configuration (III)) and configuration (VII).
Time series of vertical model motions
 $Z(t)$
for (a) configurations (III) and (VII), illustrating the dramatically different decay rates obtainable with simple tuning, and (b) three different release heights for configuration (III), scaled to an initial release height of 60 mm (
 $0.75a$
).

The theoretical analysis assumed an unbounded fluid, so the effect of the tank walls must be considered. Between tests a (minimum) delay of 5 min allowed the water surface to return to rest. In each test, waves released by the initial transient motion would reflect from the walls and return to the model after approximately 5 s and then affect both the free-surface and the body motion.
3. Results
3.1. Model heave
Upon release the model oscillated freely until coming to rest – measurements were recorded for 64 s in total, commencing shortly before release. As the model was free to move in modes in addition to heave, the extent to which this occurred was considered. Up to 5 s after release, the maximum rotational excursion from rest for any mode in any test was less than half a degree. In the horizontal plane the maximum excursion up to 5 s was less than 6 mm for most tests; for a minority the motions were greater than this, up to about 13 mm. Results from tests in this latter category are not used in this paper, though no discernible difference was discovered in the vertical motion results.
Time series of model motion after release are available for each test. The multiple release heights (identified in the caption to table 1) allow the degree of nonlinearity to be considered, while multiple repeats at a single release height allow the repeatability of the experiment to be evaluated. For the tuned case, configuration (III), the model heave time series for three different release heights, scaled by the initial release height, are shown in figure 3(b). It is apparent that the linear scaling is sufficient to capture almost all of the difference between the separate tests. For configuration (III), the scaled r.m.s. difference (up to 5 s after release) between cases with different release heights was approximately 0.40 mm, while the r.m.s. difference between repeats was about 0.14 mm (in both cases for 60 mm release height). Thus the heave motion is linear, to a good approximation, for this range of release heights. The power spectrum of the heave oscillations showed an extremely clean signal with a single spike at the linear frequency, supporting this conclusion. Higher harmonics were barely evident – for configuration (III) the second harmonic was smaller than the linear peak by a factor of more than
 $10^{3}$
.
Predicted and measured damping constant (
 ${\it\delta}$
) and oscillation period (
 $T$
) for configurations (I)–(VII) in table 1. The ‘potential’ values, generated from estimates of complex resonances, include radiation damping only; the value for configuration (III) is indicated by a labelled arrow at the bottom of the figure. The ‘potential
 $+$
viscous’ values include a (linear) viscous damping according to (3.1).

For each configuration specified in table 1, the damping predicted using a potential flow analysis and the measured damping are shown in figure 4 plotted against the predicted and measured periods. Note that the damping plotted and discussed below is not the frequency-domain coefficient; rather it is the damping constant
 ${\it\delta}$
defining an exponentially decaying envelope
 $\propto \,\text{e}^{-{\it\delta}t}$
. Measured damping was computed using a log-decrement type analysis over three periods of oscillation, from the second to the fifth peak after the initial release. This allowed the damping to be estimated after the large changes in amplitude in the first few cycles, but before the arrival of reflected waves. The predicted oscillation period and damping were obtained by estimating the location of the complex resonance for each configuration – the real part yielding the oscillation frequency and the imaginary part the damping constant (Maskell & Ursell Reference Maskell and Ursell1970). Values of the added mass and damping for real frequencies were used to generate this estimate, as suggested by Meylan & Tomic (Reference Meylan and Tomic2012). As expected, the estimated period was almost indistinguishable from the period of the motion resonance in (2.2) for most cases – this equivalence would be exact for a motion-trapped geometry. However, for configuration (VII), already identified as being the most ‘detuned’ geometry, the estimate generated from the complex resonance provided significantly improved agreement with the measured period.
Figure 4 includes a prediction with linear viscous damping considered. This estimate is generated using the classical Stokes solution (Lamb Reference Lamb1993, Article 345) for oscillatory laminar flow past an infinite flat plate, where the vertical surface of the cylinders immersed at mean draft is the area of the plate and the motion of the model and fluid are included. The linear viscous damping coefficient calculated using this method is therefore
 $$\begin{eqnarray}B_{visc}\simeq 16{\rm\pi}a(d-a){\it\rho}{\it\nu}^{1/2}{\it\omega}^{1/2}\left(\frac{1}{\sqrt{2}}+\overline{u}_{1}\cos (\overline{{\it\gamma}}+5{\rm\pi}/4)\right),\end{eqnarray}$$
where
 ${\it\rho}$
is the fluid density,
 ${\it\nu}$
the kinematic viscosity (taken to be
 $1.14\times 10^{-6}~\text{m}^{2}~\text{s}^{-1}$
, for a temperature of
 $15\,^{\circ }\text{C}$
(Kestin, Sokolov & Wakeham Reference Kestin, Sokolov and Wakeham1978)) and
 $d$
the overall draft. The magnitude of the fluid velocity, averaged over the cylinder surface and normalised by the body velocity,
 $\overline{u}_{1}$
, and the associated phase of the fluid velocity relative to the body velocity,
 $\overline{{\it\gamma}}$
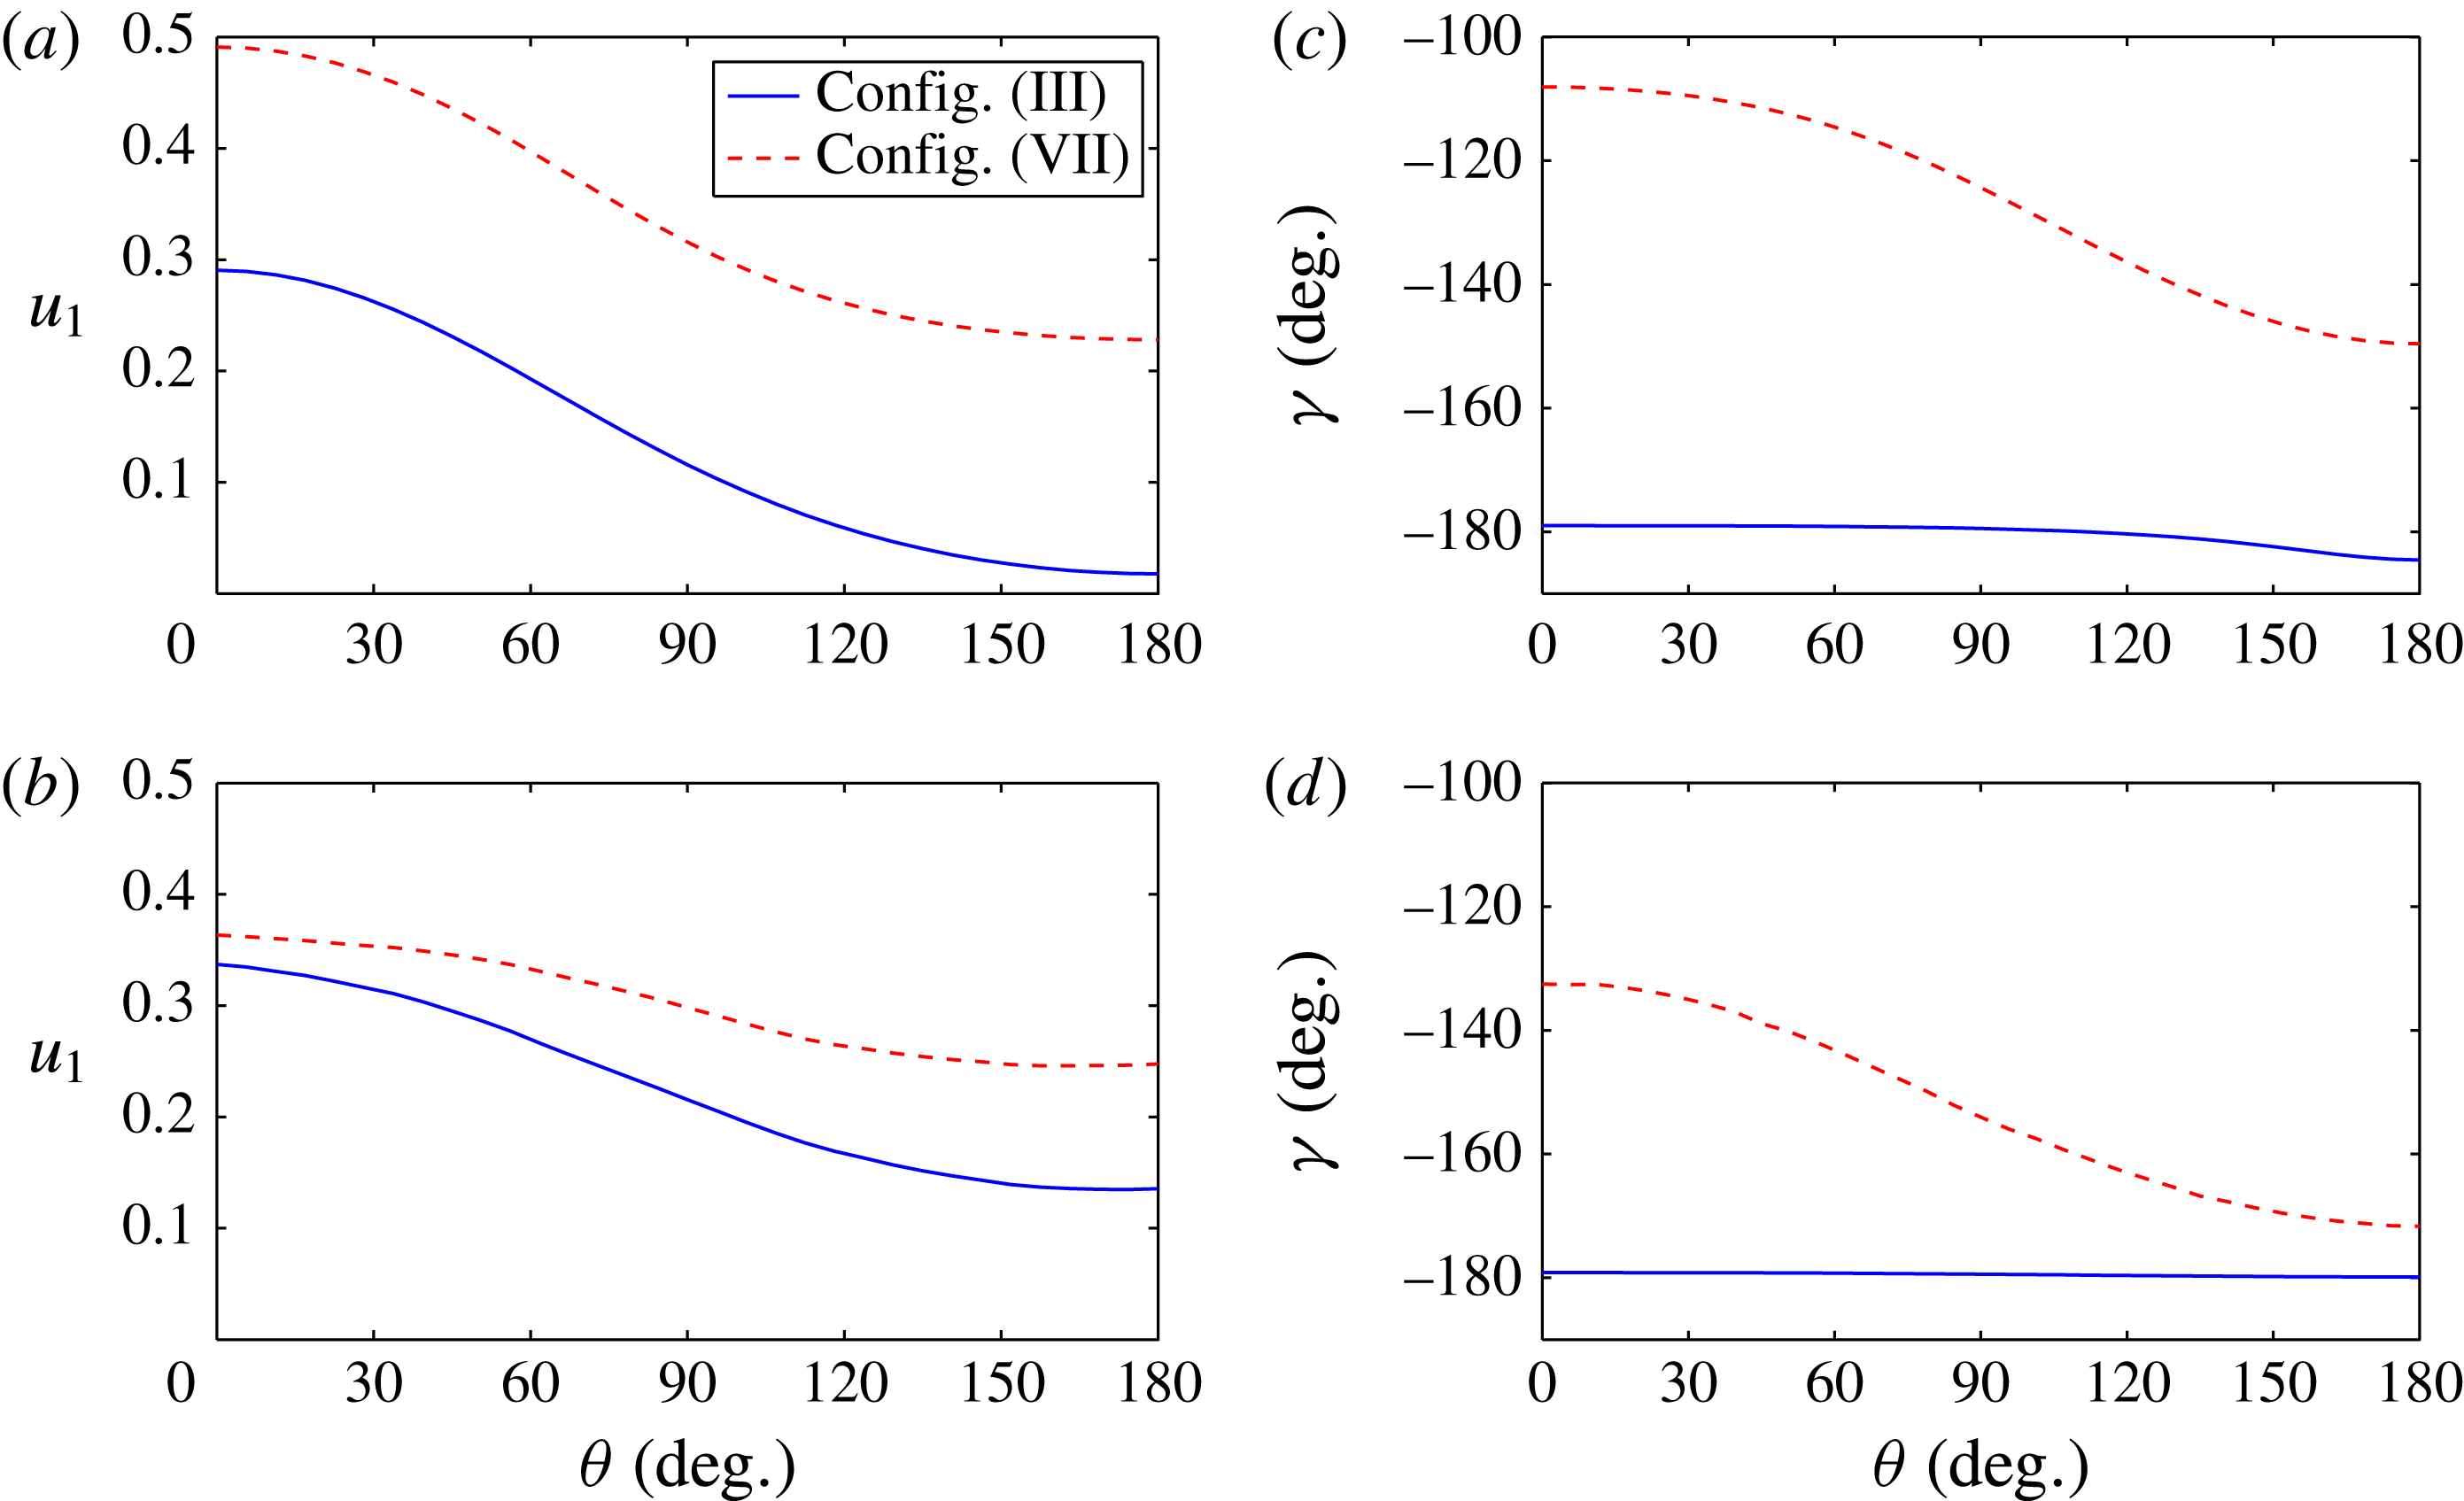
, were obtained from the potential flow analysis – figure 5 shows these parameters for configurations (III) and (VII). It may be clearly seen that for the tuned case (configuration (III)) the vertical velocity on the cylinders has reduced to almost zero at the free-surface point furthest from the centre of the ring. For the cases tested here the fraction of the viscous damping due to the second term in (3.1) is less than 25 % of the viscous total. The part of the viscous force proportional to the acceleration has been neglected as it provides no damping. In this estimate viscous damping due to attached flow around the hemispherical ends has been neglected – similar calculations suggest that this is small relative to the contribution calculated above. The possibility of flow separation has also been neglected. The Reynolds number is approximately
 $Re\simeq {\rm\pi}a^{2}/T{\it\nu}=2\times 10^{4}$
since the period,
 $T$
, is around 1 s (figure 4).
Predicted magnitude (a,b) and phase (c,d) of the vertical fluid velocity on the cylinder sides, relative to the body velocity, for configurations (III) and (VII); (a,c) show these parameters at the top of the cylinders, (b,d) at the bottom (note that the drafts of these configurations are not equal). Due to symmetry only half of each cylinder need be shown.
 ${\it\theta}=0^{\circ }$
is the point on the cylinder closest to the centre of the ring.
In figure 4 the viscous damping contribution (
 $B_{visc}/2(M+A({\it\omega}))$
), added to the potential flow damping constant (with no change of period), gives reasonable prediction of the magnitude of the measured linear damping. This additional damping masks the difference between the potential flow predictions for cases (II)–(IV) in the centre of the figure, which are the three cases with draft
 $2.5a$
and different ring radii.
3.2. Radiated field
Radiated field measurements were used to investigate whether the persistent oscillation at the tuned geometry occurred (almost) without radiated waves, as predicted by linear theory. Resonance of the cross-tank beam was evident in the wave gauge data and was also detected by the optical sensors. Occurring at a frequency of 5.5 Hz, it was easily filtered from the wave gauge data.
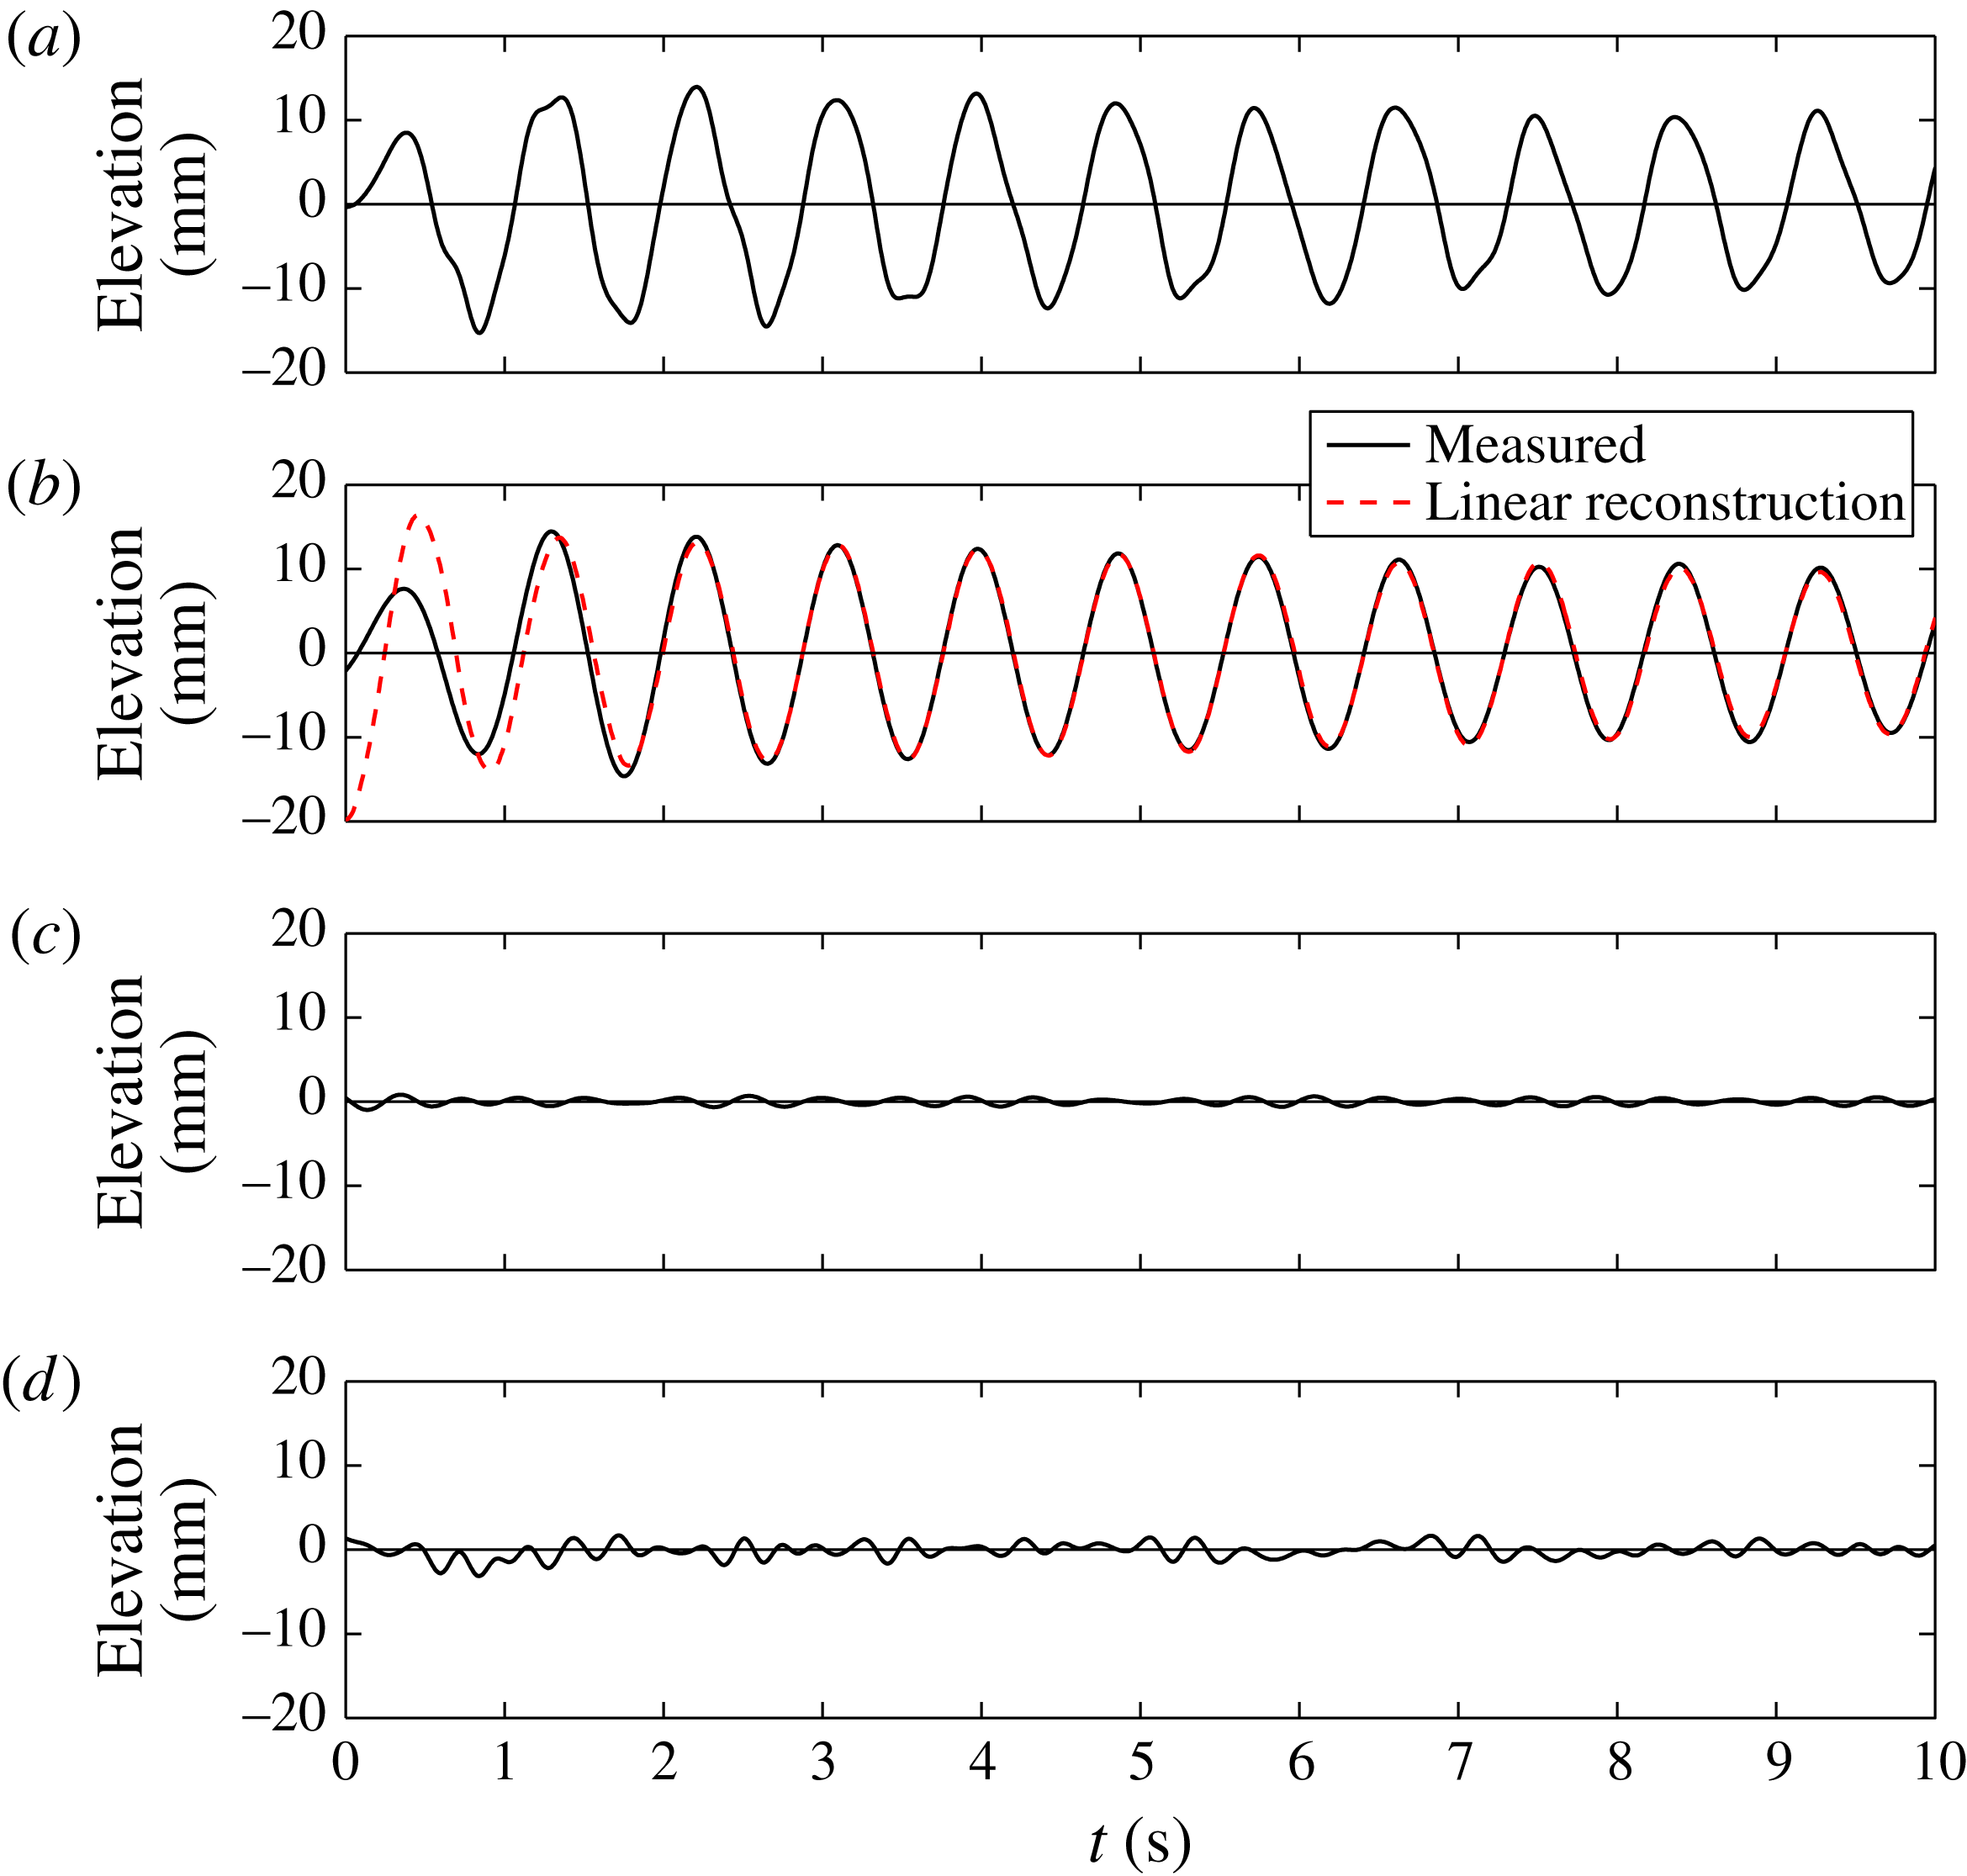
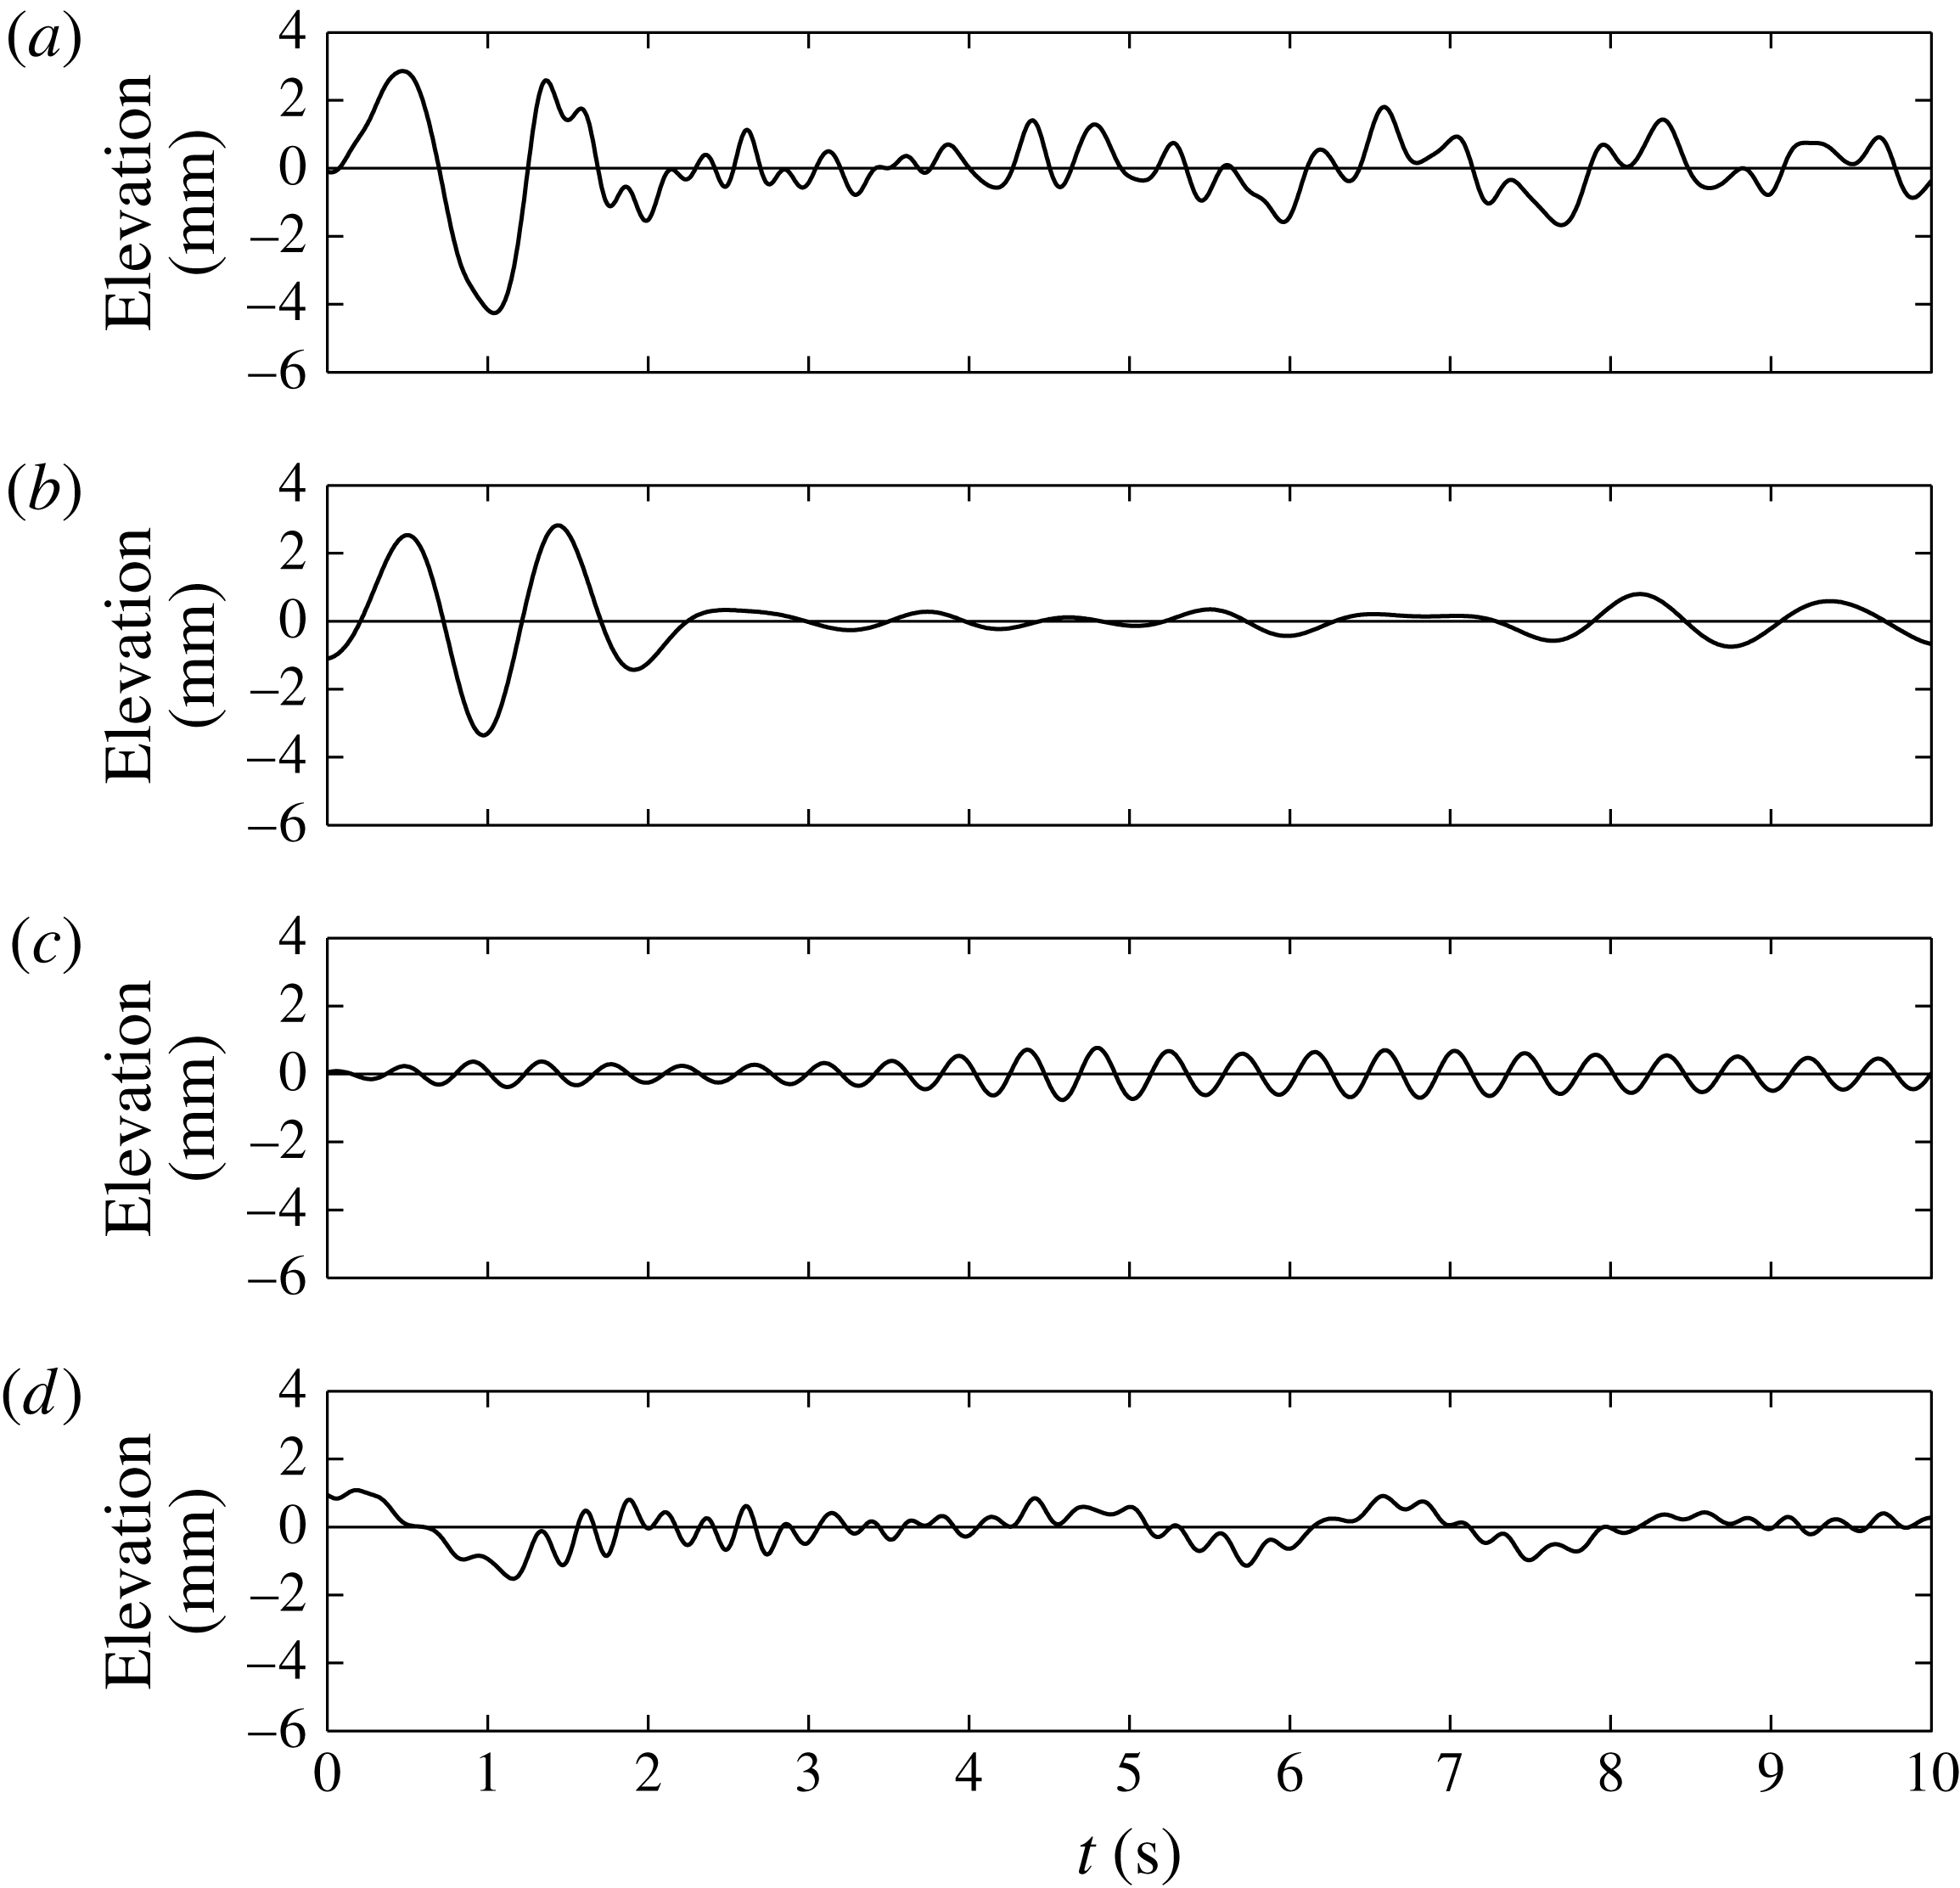
The results shown here for the radiated fields focus on the tuned geometry, configuration (III), and configuration (II), cases for which the measured damping of the body motion was of similar magnitude, as shown in figure 4. The time series of radiated waves measured at wave gauge B for these cases are shown in figures 6 and 7 respectively, and different behaviour is apparent. Note that the wave gauges are fixed (figure 1
b), so due to the changing ring geometry wave gauge B is relatively closer to the model in the former case. To illustrate this, each figure shows (in panel a) the measured time series with a low-pass filter applied to remove the beam oscillation, and in panels (b,c) the first- and second-order components of the time series. These signal components were isolated using a bandpass filter in the frequency domain (fast Fourier transform performed on 32 s worth of
 $\text{signal}=2^{12}$
points) of width
 $0.5f_{1}$
, centred on
 $f_{1}$
and
 $2f_{1}$
respectively, where
 $f_{1}$
is the peak linear frequency. Panel (d) of each figure displays the remaining signal, containing low-frequency and high-frequency (third order, etc.) signals.
Time series of free-surface elevations at wave gauge B for configuration (III),
 $0.75a=60$
mm release height. (a) The wave gauge data with only the high-frequency beam oscillation filtered out; (b,c) only the first- and second-order components respectively; (d) the remainder of the signal.
Time series of free-surface elevations at wave gauge B for configuration (II),
 $0.75a=60$
mm release height. Panels (a–d) are as in figure 6. Here (b) also shows a linear reconstruction of the free-surface signal using the measured body motion and the frequency-domain transfer function for the free surface at this point.
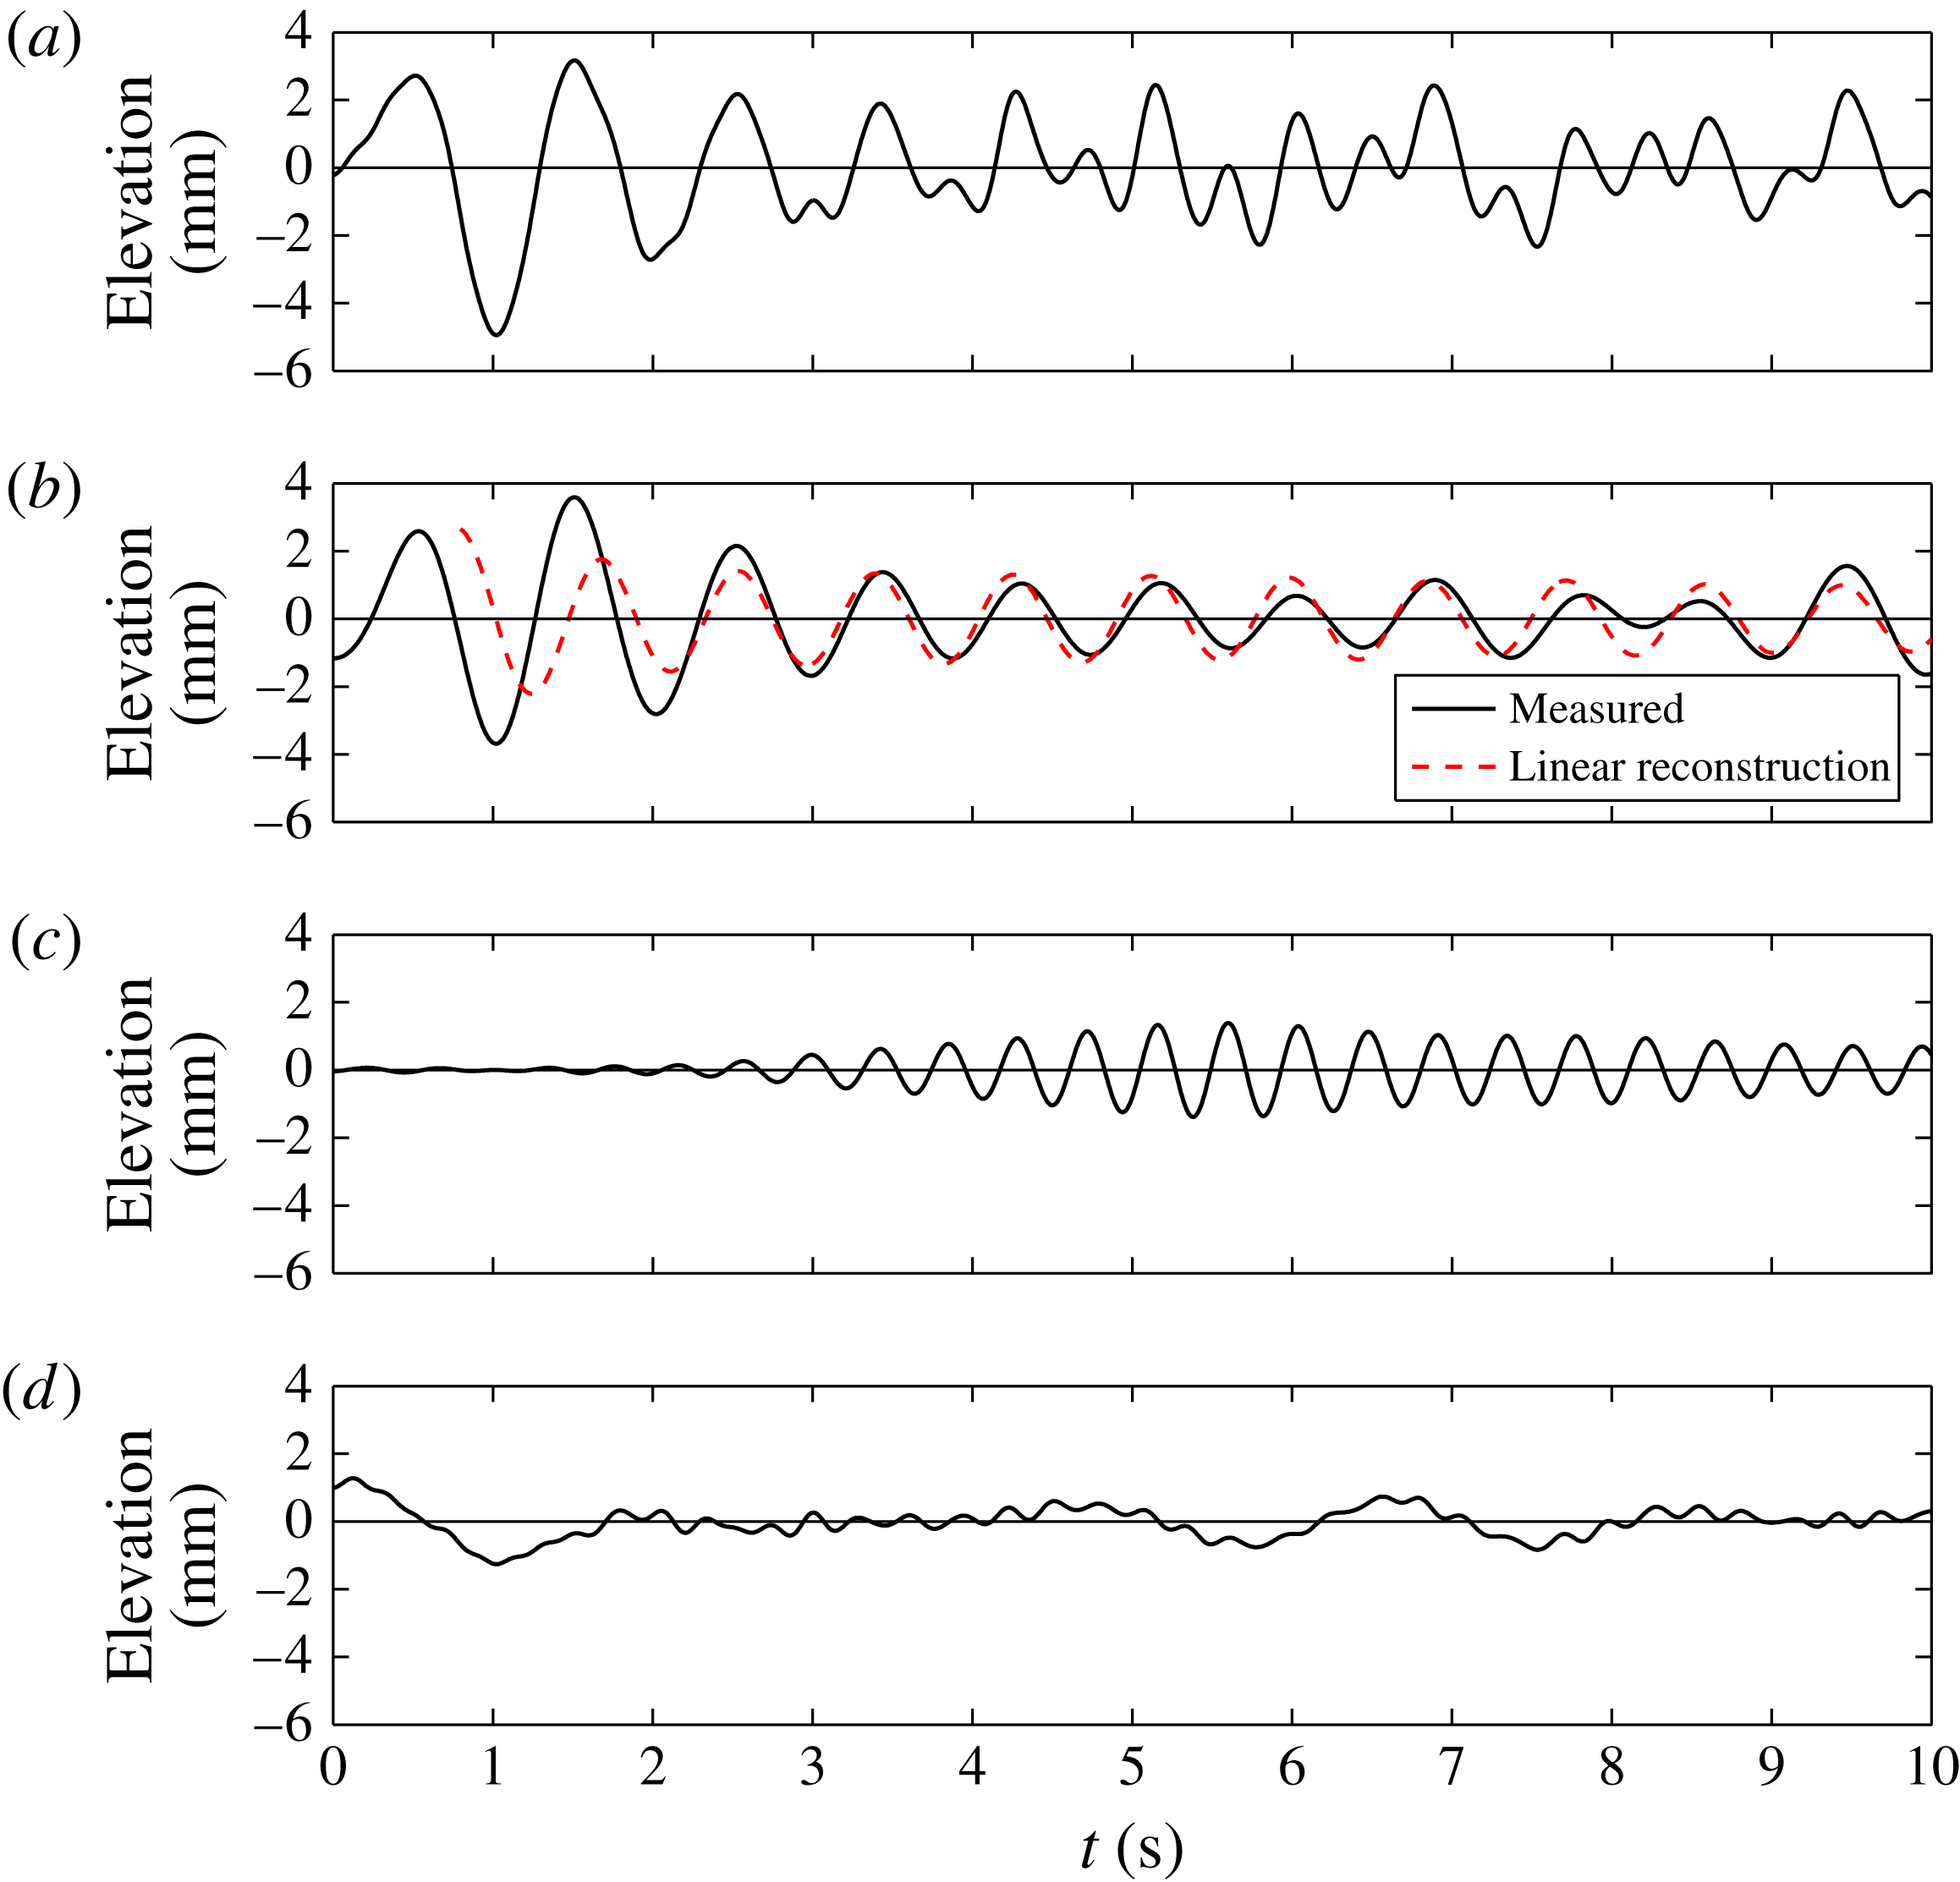
In figure 7 there is a significant linear signal retained in the bandpass-filtered signal, while in figure 6 the bandpass-filtered signal is extremely small until the reflected waves from the initial transient arrive. This indicates that almost all of the radiated energy from configuration (III) in steady-state oscillations is from double- or triple-frequency (second or third harmonic) radiation and that the dramatic differences in the radiated field expected between these two models have been observed. Observing this accurately is complicated by the presence of the outgoing and reflected transient disturbances.
Also shown in figure 7(b) is a ‘linear reconstruction’ of the free-surface displacement based on the measured body oscillation and the theoretical frequency-domain linear transfer function for the free surface at this point. After the initial transient and before reflections disrupt the measurements, the amplitude of the oscillations appears to be reasonably well predicted by this linear method. Although not shown, the linear radiated field at wave gauge B in panel (b) in figures 6 and 7 is almost indistinguishable from the radiated field at wave gauge C, which is at the same radius from the ring centre, but positioned radially out from a gap.


Figure 8 shows the measured free surface inside the array for configuration (III). This indicates that the persistent oscillation of the structure is coupled to a persistent oscillation of the free surface within the ring, despite the fact that there is minimal radiation outside the ring, as seen in figure 6. The dominant linear component of this signal is very well predicted by the linear reconstruction, which in this case (due to the phase relationship shown in figure 5) simply involves multiplying the negative of the observed body motion, shown by the solid line in figure 3, by the magnitude of the free-surface transfer function.
4. Conclusions
A simple structure with a near-motion-trapped mode has been constructed and such a mode observed experimentally for (we believe) the first time. Viscous damping ensures that the oscillations of this model, while relatively persistent, do not continue indefinitely, but the persistent oscillations are observed to occur with little radiation at linear frequencies, in agreement with theory. However, there are radiated waves at higher frequencies due to nonlinear effects, which also carry small amounts of energy away.
Acknowledgements
Invaluable assistance in conducting the experiments was provided by Mr P. Arber. The authors wish to acknowledge funding from the Lubbock Trustees in Oxford to cover the costs of model construction and associated expenses, and the first author acknowledges financial support from Shell Australia.