Implications
This study provides a comprehensive evaluation of the direct effects of a muscle-enhancing quantitative trait locus, introgressed using Poll Dorset rams from New Zealand, on a broad range of carcass traits in crossbred lambs coincident in their genetic background to the stratified structure of the UK sheep industry. The study, is essential before recommendations, can be made on the use of LoinMAX™ in breeding programmes for sheep in the United Kingdom.
Introduction
The impressive advances that have been achieved recently by the use of molecular genetics and DNA technologies have given a valuable insight into the detection of new genes or quantitative trait loci (QTLs) associated with variation in quantitative traits of economic importance. This research field has been recently reviewed by Dodds et al. (Reference Dodds, McEwan and Davis2007). In principle this allows faster genetic progress through providing more accurate tools to select animals with high genetic merit carrying favourable genes/QTL (Campbell and Waldron, Reference Campbell and Waldron2006). This can be achieved by incorporating this information into breeding programmes through marker-assisted selection (MAS) schemes (Dekkers and Hospital, Reference Dekkers and Hospital2002; Dekkers, Reference Dekkers2004). To date, many genes and QTLs affecting the muscle growth, carcass composition and meat quality have been reported in farm animals, several of which are found in sheep (Cockett et al., Reference Cockett, Jackson, Shay, Nielsen, Moore, Steele, Barendse, Green and Georges1994; Nicoll et al., Reference Nicoll, Burkin, Broad, Jopson, Greer, Bain, Wright, Dodds, Fennessy and McEwan1998; Broad et al., Reference Broad, Glass, Greer, Robertson, Bain, Lord, McEwan and Peterson2000; Marcq et al., Reference Marcq, Larzul, Marot, Bouix, Eychenne, Laville, Bibe, Leroy, Georges and Elsen2002; Laville et al., Reference Laville, Bouix, Sayd, Bibe, Elsen and Larzul2004; Walling et al., Reference Walling, Visscher, Wilson, McTeir, Simm and Bishop2004; Clop et al., Reference Clop, Marq, Takeda, Pirottin, Tordoir, Bibe, Bouix, Caiment, Elsen, Eychenne, Larzul, Laville, Meish, Milenkovic, Tobin, Charlier and Georges2006; Kijas et al., Reference Kijas, McCulloch, Hocking Edwards, Oddy, Lee and van der Werf2007; Hadjipavlou et al., Reference Hadjipavlou, Matika, Clop and Bishop2008). However, very few causative mutations underlying the variations associated with traits of economic importance in sheep have been successfully identified and validated (Cockett et al., Reference Cockett, Jackson, Shay, Nielsen, Moore, Steele, Barendse, Green and Georges1994; Clop et al., Reference Clop, Marq, Takeda, Pirottin, Tordoir, Bibe, Bouix, Caiment, Elsen, Eychenne, Larzul, Laville, Meish, Milenkovic, Tobin, Charlier and Georges2006; Wilson et al., Reference Wilson, Wu and Juengel2001).
A QTL, given different synonyms (Carwell, REM, Loin muscle QTL; here referred to as LM-QTL after the commercial haplotype test LoinMAX™ (http://www.catapultsystems.co.nz/products/30_loinmax.cfm) on which the genotyping was based), which was originally identified in Australian Poll Dorset sheep, seemed to be responsible for an increase in eye muscle dimensions (Banks, Reference Banks1997). Trials in New Zealand showed that sheep carrying this QTL had an increase of approximately 11% and 8% in M. longissimus dorsi area and weight, respectively, and boosted the yield in this high-priced cut by 15% (Nicoll et al., Reference Nicoll, Burkin, Broad, Jopson, Greer, Bain, Wright, Dodds, Fennessy and McEwan1998; McEwan et al., Reference McEwan, Broad, Jopson, Robertson, Glass, Burkin, Gerard, Lord, Greer, Bain and Nicoll2000). This increased muscle mass was limited to the M. longissimus dorsi, with no other muscle group or fatness measurements affected (Nicoll et al., Reference Nicoll, Burkin, Broad, Jopson, Greer, Bain, Wright, Dodds, Fennessy and McEwan1998; McEwan et al., Reference McEwan, Gerard, Jopson, Nicoll, Greer, Dodds, Bain, Burkin, Lord and Broad1998; McLaren et al., Reference McLaren, Broad, McEwan, Jopson, Robertson, Glass, Gerard, Greer, Bain and Nicoll2001). In the early stages of the discovery of this QTL, a molecular investigation detected variation at markers in a region of ovine chromosome 18 which seemed to explain the variation in phenotypes (Nicoll et al., Reference Nicoll, Burkin, Broad, Jopson, Greer, Bain, Wright, Dodds, Fennessy and McEwan1998). This QTL was mapped to the distal end of ovine chromosome 18 where its location overlaps with Callipyge, a hyper-muscling locus in sheep, which also causes a marked toughness in meat (Koohmaraie et al., Reference Koohmaraie, Shackelford, Wheeler, Lonergan and Doumit1995; Duckett et al., Reference Duckett, Snowder and Cockett2000; Freking et al., Reference Freking, Murphy, Wylie, Rhodes, Keele, Leymaster, Jirtle and Smith2002). However, Jopson et al. (Reference Jopson, Nicoll, Stevenson-Barry, Duncan, Greer, Bain, Gerard, Glass, Broad and McEwan2001) found only a minor negative impact of the LM-QTL allele on tenderness, which could be removed by appropriate post-slaughter treatments.
No evidence has been found to suggest that LM-QTL exhibits any non-Mendelian pattern of inheritance, such as that reported for Callipyge (polar overdominance, Cockett et al., Reference Cockett, Jackson, Shay, Farnir, Berghmans, Snowder, Nielsen and Georges1996), and LM-QTL seems to act as a completely dominant gene (Jopson et al., Reference Jopson, Nicoll, Stevenson-Barry, Duncan, Greer, Bain, Gerard, Glass, Broad and McEwan2001). In contrast, other evidence suggests that LM-QTL might be maternally imprinted (Campbell and McLaren, Reference Campbell and McLaren2007), meaning that the phenotypic effect is only present in progeny that receive the allele from their sire. However, no supporting results have been formally published on this to date.
Walling et al. (Reference Walling, Visscher, Simm and Bishop2001) reported a QTL in purebred UK Texel sheep with similar phenotypic effects on muscling and fatness to those of the LM-QTL (Nicoll et al., Reference Nicoll, Burkin, Broad, Jopson, Greer, Bain, Wright, Dodds, Fennessy and McEwan1998). This QTL, later confirmed by Matika et al. (Reference Matika, Pong-Wong, Woolliams, Low, Nieuwhof, Boon and Bishop2006) and now known as Texel muscling-QTL (TM-QTL), was mapped to the same region that encompasses the Callipyge gene (Freking et al., Reference Freking, Murphy, Wylie, Rhodes, Keele, Leymaster, Jirtle and Smith2002) and the LM-QTL. The estimated position of the LM-QTL was mapped from 2 to 6 cM telomeric to CSSM18 (Nicoll et al., Reference Nicoll, Burkin, Broad, Jopson, Greer, Bain, Wright, Dodds, Fennessy and McEwan1998), whereas TM-QTL has been localised from 2 to 9 cM telomeric to CSSM18 (Walling et al., Reference Walling, Visscher, Simm and Bishop2001). These studies therefore suggest that TM-QTL could be either an alternative allele to LM-QTL or a closely linked locus. Further the finemapping of genes in the region is being pursued with the aim of explicitly refining and identifying the physical position of the gene mutation responsible for the LM-QTL phenotype. McLaren et al. (Reference McLaren, McEwan, For, Glass, Broad, Greer and Nicoll2003) confirmed that the LM-QTL locus is discrete from the Callipyge locus, as was hypothesised by Jopson et al. (Reference Jopson, Nicoll, Stevenson-Barry, Duncan, Greer, Bain, Gerard, Glass, Broad and McEwan2001) and McEwan et al. (Reference McEwan, Broad, Jopson, Robertson, Glass, Burkin, Gerard, Lord, Greer, Bain and Nicoll2000). The interval where the LM-QTL was localised excludes the entire cluster of imprinted genes implicated in Callipyge, as well as the single-nucleotide polymorphism that has been proposed as the causative mutation for Callipyge (Freking et al., Reference Freking, Murphy, Wylie, Rhodes, Keele, Leymaster, Jirtle and Smith2002). Moreover, the same study by McLaren et al. (Reference McLaren, McEwan, For, Glass, Broad, Greer and Nicoll2003) suggests that the critical interval for LM-QTL location contains three known genes. One of these is the yy1 gene and one of its functions is to regulate muscle-specific gene expression, making this gene a plausible candidate for the LM-QTL effect.
Introducing the LM-QTL into the UK sheep industry, may be beneficial as it, has the potential to improve the yield of highly priced loin muscle in slaughter lambs. However, before being recommended for future commercial application, essential information is required about the magnitude of the direct effects of the LM-QTL in crossbred lambs, since lamb production in the UK is predominantly based on a three-way cross (Pollott and Stone, Reference Pollott and Stone2006). Therefore, the LM-QTL effects need to be evaluated when acting in a genetic background that is relevant and typical for the stratified crossbreeding structure of the UK sheep industry (e.g. terminal sire-cross lambs out of Mule ewes).
The aim of this study is to evaluate the direct effects of LM-QTL on carcass traits in crossbred lambs using in vivo ultrasound scanning; in vivo computed tomography (CT) scanning; Meat and Livestock Commission (MLC) carcass classification scoring for conformation and fatness class (MLC-C and F) and video image analysis (VIA).
Material and methods
Experimental animals
All procedures involving animals were approved by the Scottish Agricultural College animal ethics committee and were performed under UK Home Office licence, following the regulations of the Animal (Scientific Procedures) Act 1986. Semen from two Poll Dorset rams heterozygous for LM-QTL was imported from New Zealand and used to inseminate 4- and 5-year old Scottish Mule (Blue-faced Leicester × Scottish Blackface) ewes (n = 200) that were non-carriers of LM-QTL. Of the 333 lambs born, 180 lambs were selected that were reared as twins (to minimise one source of variation because of the litter size) and were recorded throughout their growth. Of these, only 167 lambs with complete records (82 male, 85 female; 106 born as twins, 61 born as triplets) were finally included in this study. These lambs were all grazed on the same pasture with their dams to avoid any differences in nutrition between lambs of the different genotypes. Lambs were CT scanned at 16 weeks of age and then weighed and ultrasound scanned at 20 weeks of age, 7 days before slaughter. Lambs were weighed again immediately before transported to slaughter.
Genotype classes
Blood samples were collected from all the lambs studied and their dams and sent to Catapult Genetics, New Zealand, for genotyping. The genotypes showed, unexpectedly, that one of the rams used for the artificial insemination was also heterozygous for the MyoMAX™ QTL (http://www.catapultsystems.co.nz/products/20_myomax.cfm), in this study referred to as MM-QTL. The genotypes of the 167 experimental lambs, which all had complete data records, were therefore classified into four groups as shown in Table 1.
Number of lambs in each genotype class for LoinMAX™ and MyoMAX™

+/+ = non-carrier, LM/+ = carrier for one copy of LoinMAX™; +/MM = carrier of one copy of MyoMAX™.
An initial power calculation, according to the method described by Rasch et al. (Reference Rasch, Herrendörfer, Bock and Busch1978) and based on a minimum ‘difference of interest’ of 1 mm in ultrasounically measured muscle depth (UMD) and phenotypic standard deviation of 2.05, indicated that approximately 70 animals per genotype group (or 140 animals in total) were required to detect a significant (P < 0.05) difference in UMD between carrier and non-carrier lambs. However, the total number of lambs used was increased to 167 to allow for the unexpected MyoMAX™ status of one of the sires and the unknown interactions between LM-QTL and MM-QTL. As MM-QTL segregation was totally unexpected, the numbers of lambs for this QTL were too low to permit statistical evaluation of MM-QTL, thus the MM-QTL status was nested within sire in the statistical analyses undertaken to investigate the effects of LM-QTL.
Traits measured by X-ray CT
All lambs were CT scanned at 16 weeks of age, at least 30 days before slaughter to ensure that all lambs had the full withdrawal period required for the sedative used for CT scanning (average age = 113 days; minimum age = 110 days; maximum age = 116 days). Lamb live weight was measured at CT scanning and ranged from 22.9 to 37.4 kg. The method of reference CT scanning has been described in detail elsewhere (e.g. Macfarlane et al., Reference Macfarlane, Lewis, Emmans, Young and Simm2006). In short, for each lamb, cross-sectional CT reference scans were taken at three positions, the end of the ischium bone (ISC), the fifth lumbar vertebra (LV5), and the eighth thoracic vertebra (TV8). Image analyses were performed on each resulting cross-sectional CT image using STAR software (Mann et al., Reference Mann, Young, Glasbey and McLean2003) to obtain for each reference scan carcass fat, muscle and bone areas, and average muscle density, which is likely to be an indicator of intramuscular fat (IMF) content (Karamichou et al., Reference Karamichou, Richardson, Nute, McLean and Bishop2006; Navajas et al., Reference Navajas, Lambe, McLean, Glasbey, Fisher, Charteris, Bünger and Simm2007). Total weights of fat (FATwt), muscle (MUSCwt) and bone (BONEwt) in the carcass were predicted by using reference scan tissue areas and live weight in relevant prediction equations developed for crossbred lambs (Macfarlane, personal communication). Very accurate predictions of carcass composition were achieved (Young et al., Reference Young, Garden and Knopp1987; Young et al., Reference Young, Nsoso, Logan and Beatson1996; Young et al., Reference Young, Simm and Glasbey2001 and Macfarlane et al., Reference Macfarlane, Lewis, Emmans, Young and Simm2006) when the area of tissues in cross-sectional scans and live weight were used in previous prediction equations derived in a similar way for pure-bred lambs of different breeds (R 2 values of 0.924, 0.978 and 0.830 for lean, fat and bone weights, respectively). Predicted total tissue weights were then used to estimate tissue proportions and ratios: muscle proportion (MUSC-Prop), fat proportion (FAT-Prop), bone proportion (BONE-Prop), the ratio of muscle to bone (M : B) and the ratio of muscle to fat (M : F). M. longissimus lumborum (MLL) width (mm), depth (mm) and area (mm2) were measured on both the left and the right muscles on the LV5 scan and the average of the measurements from the two sides were used in analyses. Using the approach of Jones et al. (Reference Jones, Lewis, Young and Wolf2002), the ratio of depth to width was multiplied by ten and averaged over both sides to provide a measure of two-dimensional (2D) loin muscularity. Linear measurements of muscle width (mm) and depth (mm) on each hind leg were taken on the ISC scan. Similarly to the loin, the ratio of depth to width measurements was multiplied by ten and the mean value over both legs was used to provide a measure of 2D shape of the hind leg, as described by Jones et al. (Reference Jones, Lewis, Young and Wolf2002).
Traits measured by US
Lambs were ultrasound scanned at 20 weeks of age, using a Dynamic Imaging Concept MLV (Caiyside Imaging Ltd) ultrasonic scanner with a 3.5 mHz transducer, to determine the ultrasonic fat depth (UFD) and ultrasonic muscle depth (UMD) over the third lumbar vertebra. One muscle depth measurement was taken vertically at the deepest point of the MLL. Three fat depths were measured, one at the same lateral position as the muscle depth and the others at 1 and 2 cm lateral to the first position, and the average of these three fat depths used as the UFD measurements. Ultrasound data was not available for three lambs (two non-carriers, one carrier) that were CT scanned, reducing the number of lambs for those traits to a total of 164 lambs.
Post-mortem procedures
Lambs were slaughtered at the Welsh Country Foods abattoir in Anglesey, where they were electrically stunned, slaughtered, conventionally dressed, and then electrically stimulated. In the abattoir, carcasses were classified by an expert grader for fat cover (MLC-F) and conformation (MLC-C) scores based on the MLC classification scheme, which is used in the United Kingdom. MLC-F describes the carcass based on a seven-point scale for fat cover from one (very lean) to five (very fat), with classes 3 and 4 being subdivided into L = low and H = high (Anderson, Reference Anderson2003). To analyse fat classification, the classes were transformed to a numerical scale based on estimated subcutaneous fat percentage, as described by Kempster et al. (Reference Kempster, Cook and Grantley-Smith1986); 1 = 4, 2 = 8, 3L = 11, 3H = 13, 4L = 15, 4H = 17, 5 = 20. Conformation was visually assessed on a five-point scale for carcass shape based on the EUROP classification scale, the common current system for specifications, pricing and monitoring used in the United Kingdom. The scale was coded from 1 to 5 for statistical analyses where excellent = 5 and poor = 1.
Traits measured by VIA
VIA is an objective, automatic, non-invasive and reliable technology for carcass grading and predicting saleable meat yield (SMY) (Allen, Reference Allen2005; Rius-Vilarrasa et al., Reference Rius-Vilarrasa, Bünger, Maltin, Matthews and Roehe2009a) and was used here to investigate whether it can discriminate between groups of lambs with different LM-QTL genotypes. All carcasses were scanned using the VSS2000 video image analysis system (VSS2000, E + V Technology, Germany, available at: http://www.vision-for-you.com/start.htm) in place at the Welsh Country Foods abattoir. VIA data was not available from a total of six lambs that were CT scanned, because of accidental carcass damage in the slaughter line. The VIA system and procedures have been described in more detail elsewhere (Rius-Vilarrasa et al., Reference Rius-Vilarrasa, Bünger, Maltin, Matthews and Roehe2009a). In short, VIA system measurements were comprised of dimensional and morphometric characteristics of the carcass at specific positions. The VSS2000 software divides the carcass image into different anatomical regions, and automatically calculates a variety of lengths, widths and areas which are combined in variables that describe carcass shape and size, and can be used to estimate the amounts of fat and lean tissue. In total, six predictor variables (function of lengths, areas and widths measured on the carcass) along with cold carcass weight (CCW; kg), are used in prediction equations produced by E + V Technology, Germany, to provide objective predictions for weights of SMY in the carcass and weights of different primal cuts. Calibration and validation under British abattoir conditions were previously undertaken by Rius-Vilarrasa et al. (Reference Rius-Vilarrasa, Bünger, Maltin, Matthews and Roehe2009a). Two different prediction equations were used to estimate carcass cuts the ‘standard’ equations derived by E + V Technology, Germany, and the ‘refined’ equations later developed by E + V Technology, Germany, which were derived using calibration of the VIA system against CT measurements in the loin region (Rius-Vilarrasa et al., Reference Rius-Vilarrasa, Roehe, Macfarlane, Lambe, Matthews, Haresign and Bünger2009b). Higher accuracy and precision of prediction of carcass primal and trimmed primal cuts achieved with these refined prediction equations, compared to the ‘standard’ VIA prediction equations, were reported by Rius-Vilarrasa et al. (Reference Rius-Vilarrasa, Roehe, Macfarlane, Lambe, Matthews, Haresign and Bünger2009b). The correlation between muscle weight derived by CT scanning and the sum of trimmed primal weights predicted using refined VIA prediction equations was higher in this study (r = 0.87) than the corresponding correlation based on the standard prediction equations (r = 0.85). Although this difference was not statistically significant, the refined prediction equations were chosen for use in predicting the primal weights and trimmed primal weights in this study. The resulting variables predicted using VIA included carcass SMY (predicted not as a sum of predicted weights of individual cuts, but by separate prediction equations), non-trimmed loin weight and loin SMY (TP_Loin), non-trimmed chump weight and chump SMY (TP_Chump), non-trimmed leg weight and leg SMY (TP_Leg), non-trimmed breast weight and breast SMY (TP_Breast), non-trimmed shoulder weight and shoulder SMY (TP_Shoulder).
Statistical analysis
Data were analysed using the general linear model (GLM) procedure of the SAS package for Windows, Release 9.1 (SAS Institute Inc., Cary, NC, USA).
The model used was:

The full model tested for all traits (Y) for each lamb (n = 1, 2, 3…167), included a constant (a) and the fixed effects of sire t (i = sire 1 or 2), genotype l for LM-QTL (j = LM-QTL carrier or LM-QTL non-carrier), genotype m for MM-QTL (k = MM-QTL carrier or MM-QTL non-carrier), which was nested within sire as only one sire was segregating for this QTL, and sex s (l = male or female). A covariate (w) was fitted, which was either live weight at the time of measurement (for the in vivo measurements) or carcass weight (for measurements taken on the carcass). No covariate was fitted in the model where the Y variable was live weight or carcass weight. Furthermore, animal live weight at CT was not fitted as a covariate in the model for CT tissue proportion variables. An error term (εijklmn) was also fitted. Initially, the analyses also included dam age and the interaction term between the two QTL, however, these were consistently non-significant over all traits, so they were dropped from the final model.
Least-squares means and their standard errors were produced and tabulated for all traits in this study. The GLM procedure also allowed for pairwise comparisons between the genotypic groups.
Results
Traits measured by X-ray CT
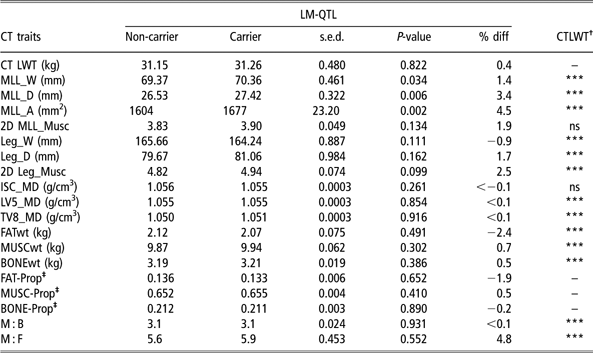
Analysis revealed that live weight at CT scanning was not significantly different between LM-QTL carrier and non-carrier lambs (Table 2). However, LM-QTL carrier lambs had a significantly wider (+1.4%; P < 0.05) and deeper (+3.4%; P < 0.01) MLL. In consequence, the increase in both dimensions resulted in a 73 mm2 larger MLL area (+4.5%; P < 0.01) in lambs carrying a single copy of the LM-QTL. There was no effect of LM-QTL status on muscle shape (2D MLL_Musc) (P = 0.134), and also leg muscle characteristics – width, depth and 2D muscularity – measured by CT scan were not significantly affected by the presence of the LM-QTL. Likewise, muscle densities in the three cross-sectional CT scans (ISC, LV5 and TV8) were not significantly affected by LM-QTL.
Least-square means and standard error of the difference for LM-QTL carrier and non-carrier lambs for CT measurements (percentage difference) of LM-QTL carrier v. non-carrier is also shown for each variable)

LM-QLT = loinMAX quantitative trait locus; CT = computed tomography; %diff = percentage difference; CT LWT = live weight at computed tomography; 2D = two-dimensional.
† (* = P < 0.05; ** = P < 0.01; *** = P < 0.001).
‡ Percentage difference is the percentage difference of tissue proportion.
CTLWT is the animal live weight at CT scanning. MLL_W, MLL_D and MLL_A are the dimensional measurements of the M. longissimus lumborum width, depth and area; respectively, measured on the CT scan through the fifth lumbar vertebra. 2D MLL_Musc is M. longissimus lumborum muscularity ((depth/width) × 10) measured on the CT scan through the fifth lumbar vertebra. Leg_W, Leg_D are the leg width and depth, respectively, measured on the CT scan through the ischium and 2D Leg_Musc is hind leg muscularity ((depth/width) × 10) on the CT scan through the ischium. ISC_MD (g/cm3), LV5_MD (g/cm3) and TV8_MD (g/cm3) are the average muscle densities in the CT reference scans through the ischium, fifth lumbar vertebrae and 8th thoracic vertebrae, respectively. FAT-Prop, MUSC-Prop and BONE-Prop are the proportion of the fat, muscle and bone tissue weight relative to the total carcass tissue weight on the CT scan. M : B and M : F are the ratios of muscle to bone and muscle to fat, respectively.
MUSCwt, FATwt and BONEwt in the whole carcass estimated by CT were not significantly different between carriers and non-carriers of LM-QTL (Table 2). Therefore, it is not unexpected that MUSC-Prop, FAT-Prop and BONE-Prop derived from total tissue weights predicted by CT measurements were also not significantly affected by LM-QTL status. LM-QTL carrier lambs and non-carrier lambs had similar MUSC-Prop and FAT-Prop. Similarly, the M : B) and M : F) were not significantly different between LM-QTL carrier lambs and their non-carriers contemporaries.
Ultrasound traits
Live weight at US (USLWT; 20 weeks of age) did not show a significant effect of LM-QTL (Table 3). However, UMD was significantly (+3.7%; P < 0.05) greater in LM-QTL carrier lambs. UFD was similar in LM-QTL carriers and non-carriers (Table 3).
Least-square means and standard error of the difference for LM-QTL carrier and non-carrier lambs for ultrasound measurements (percentage difference) of LM-QTL carrier v. non-carrier is also shown for each variable)

LM-QTL = loinMAX quantitative trait locus; %diff = percentage difference; USLWT = animal live weight at ultrasound; UMD = ultrasonically measured muscle depth; UFD = ultrasonically measured fat depth.
† (* = P < 0.05; ** = P < 0.01; *** = P < 0.001).
Post-mortem traits (MLC-C and F and VIA traits)
The average CCW and killing out (KO) percentage, defined as CCW divided by animal live weight before slaughtering, multiplied by 100, were not affected by the presence of one copy of the LM-QTL (P > 0.05; Table 4). There were also no significant differences between LM-QTL carriers and non-carriers in MLC conformation score and fat class (Table 4).
Least-square means and standard error of the difference for LM-QTL carrier and non-carrier lambs for CCW, KO percentage and CONF and fat class (FAT) scores (percentage difference) of LM-QTL carrier v. non-carrier is also shown for each variable)

LM-QTL = loinMAX quantitative trait locus; MLC = Meat and Livestock Commission; %diff = percentage difference; CCW = cold carcass weight; KO% = killing out percentage.
† (* = P < 0.05; ** = P < 0.01; *** = P < 0.001).
CONF is MLC conformation score (EUROP) transformed to a numeric scale: E (excellent) = 5 to P (poor) = 1.
FAT is MLC fat class (1, 2, 3L, 3H, 4L, 4H, 5) transformed to a subcutaneous fat percentage as described by Kempster et al. (Reference Kempster, Cook and Grantley-Smith1986): 1 = 4, 2 = 8, 3L = 11, 3H = 13, 4L = 15, 4H = 17, 5 = 20.
The aim of using VIA in this experiment was to evaluate the potential of VIA to capture the variation between LM-QTL genotypes in carcass traits. In agreement with the results for loin muscle traits measured by CT (Table 2) and US (Table 3), VIA could also detect a significant difference between carriers and non-carriers in the estimated weight of SMY in the loin primal cut (TP_Loin) (+2.2%; P < 0.05), but not in any other primal cut and not in the SMY of the whole carcass (Table 5) or any of the non-trimmed primal cuts (not presented). Only trimmed primal cut traits are presented in Table 5 as they are, arguably, more important traits for the producer, processor and meat retailer.
Least-square means and standard error of the difference for LM-QTL carrier and non-carrier lambs for carcass traits predicted from VIA measurements (percentage difference) of LM-QTL carrier v. non-carrier is also shown for each variable)

LM-QTL = loinMAX quantitative trait locus; VIA = video image analysis; %diff = percentage difference; CCW = cold carcass weight; SMY = saleable meat yield.
† (* = P < 0.05; ** = P < 0.01; *** = P < 0.001).
‡ SMY is the VIA prediction of saleable meat yield in the carcass predicted by a distinct prediction equation. TP_Loin, TP_Chump, TP_Leg, TP_Breast and TP_Shoulder are the VIA predictions of saleable meat yields in the loin, chump, leg, breast and shoulder primal cut, respectively.
Discussion
This study looked at a wide range of carcass traits in crossbred lambs that were representative of the typical slaughter lamb in the UK stratified sheep industry structure. The key element of this study was to comprehensively investigate the carcass traits of these lambs, which had either one copy of LM-QTL or none (non-carrier lambs). The effects of another QTL, which unexpectedly also segregated in some of these lambs, were accounted for in the statistical analyses.
Only a small number of studies have so far investigated the effects of LM-QTL in lambs, and these are mainly limited to studies in Australia and New Zealand. There has been scant information on the impact of LM-QTL on lamb carcass traits in other countries/environments and other genetic backgrounds. In general, the reported effects of the LM-QTL seem to be restricted to the loin area, with no corresponding effects on other muscle areas or on fat. Nicoll et al. (Reference Nicoll, Burkin, Broad, Jopson, Greer, Bain, Wright, Dodds, Fennessy and McEwan1998) CT scanned Poll Dorset × Romney lambs at approximately 5 months of age and reported an increase in CT-measured width, depth and area of the loin muscle by 2.7 mm, 3 mm and 3.3 cm2, respectively, in LM-QTL carrier lambs compared with non-carriers. In this study, the magnitude of the differences between carriers and non-carriers in loin muscle dimensions measured at 16 weeks is smaller (∼1 mm for MLL width and depth and 73 mm2 for MLL area). These results are more comparable to the LM-QTL effects reported in another study of crossbred lambs out of non-carrier Romney ewes mated with LM-QTL heterozygous sires (Jopson et al., Reference Jopson, Nicoll, Stevenson-Barry, Duncan, Greer, Bain, Gerard, Glass, Broad and McEwan2001), where carrier lambs at approximately ∼24 weeks of age, had 1.1 cm2 greater ultrasound-measured muscle area compared with non-carriers. Differences in the magnitude of the effect observed between studies may be related to age, slaughter weight (although this was not specified in the previous studies), scanning method and position or genetic background. Crucially, this study is in agreement with those of both Nicoll et al. (Reference Nicoll, Burkin, Broad, Jopson, Greer, Bain, Wright, Dodds, Fennessy and McEwan1998) and Jopson et al. (Reference Jopson, Nicoll, Stevenson-Barry, Duncan, Greer, Bain, Gerard, Glass, Broad and McEwan2001) in the conclusion that the effects of this LM-QTL are predominantly localised in the loin muscle region.
Crossbred lambs out of Mules ewes, similar to those of our experiment, were used to quantify the effect of the TM-QTL (Walling et al., Reference Walling, Visscher, Wilson, McTeir, Simm and Bishop2004) on carcass traits at the same slaughter age (Macfarlane et al., Reference Macfarlane, Lambe, Bishop, Matika, Rius-Vilarrasa, McLean, Haresign, Wolf, McLaren and Bünger2009). TM-QTL has also been found to affect mainly the loin region and increases the ultrasonically measured muscle depth by around 1.0 to 2.0 mm (+4% to 7%) (Walling et al., Reference Walling, Visscher, Wilson, McTeir, Simm and Bishop2004; Matika et al., Reference Matika, Pong-Wong, Woolliams, Low, Nieuwhof, Boon and Bishop2006; Macfarlane et al., Reference Macfarlane, Lambe, Bishop, Matika, Rius-Vilarrasa, McLean, Haresign, Wolf, McLaren and Bünger2009) or 1.9 mm (+6.7%) when measured by CT at the fifth lumbar vertebra (Macfarlane et al., Reference Macfarlane, Lambe, Bishop, Matika, Rius-Vilarrasa, McLean, Haresign, Wolf, McLaren and Bünger2009). It is noticeable that both QTL effects seem to be restricted to the loin area and are relatively similar in magnitude.
Nicoll et al. (Reference Nicoll, Burkin, Broad, Jopson, Greer, Bain, Wright, Dodds, Fennessy and McEwan1998) suggested that LM-QTL seems to alter the muscle shape as it has larger effects on the muscle depth and area of M. Longissimus dorsi than it has on muscle width when adjusted for live weight. Our study shows that width and depth were changed by effects of similar absolute magnitude (∼1 mm), corresponding to 1.4% and 3.4%, respectively, and thereby confirms the suggestion that LM-QTL results in a change in muscle shape.
Previous study by Nicoll et al. (Reference Nicoll, Burkin, Broad, Jopson, Greer, Bain, Wright, Dodds, Fennessy and McEwan1998) found that the M. longissimus dorsi weight was 8% higher in LM-QTL carrier lambs compared with non-carriers. Similar effects were found by Macfarlane et al. (Reference Macfarlane, Lambe, Bishop, Matika, Rius-Vilarrasa, McLean, Haresign, Wolf, McLaren and Bünger2009) for the TM-QTL, which increased the MLL weight by 7.1% in heterozygous TM-QTL carrier lambs owing to significant increases in loin width and depth but no significant change in MLL length. In this study, MLL weight was not measured and could not be predicted as this study did not involve fine dissection and no three-dimensional CT scanning, which would have allowed the calculation of muscle volume (Navajas et al., Reference Navajas, Glasbey, McLean, Fisher, Charteris, Lambe and Bünger2006). However, if LM-QTL and TM-QTL effects can be assumed to be similar, then it could be expected that LM-QTL carrier lambs would also have a higher loin muscle weight.
At present it can not be ruled out that TM-QTL and LM-QTL are alleles of the same gene (Walling et al., Reference Walling, Visscher, Wilson, McTeir, Simm and Bishop2004; Macfarlane et al., Reference Macfarlane, Lambe, Bishop, Matika, Rius-Vilarrasa, McLean, Haresign, Wolf, McLaren and Bünger2009). To prove this requires further molecular-genetic evidence as, to derive such a conclusion simply from the similarity of the phenotypic effects of both QTL seems to be too speculative.
To our knowledge, none of the previous study on LM-QTL effects in purebred or crossbred lambs has found or reported phenotypic effects other than those on the loin muscle region (Nicoll et al., Reference Nicoll, Burkin, Broad, Jopson, Greer, Bain, Wright, Dodds, Fennessy and McEwan1998; Jopson et al., Reference Jopson, Nicoll, Stevenson-Barry, Duncan, Greer, Bain, Gerard, Glass, Broad and McEwan2001), which is in agreement with the current findings. Macfarlane et al. (Reference Macfarlane, Lambe, Bishop, Matika, Rius-Vilarrasa, McLean, Haresign, Wolf, McLaren and Bünger2009) studied the TM-QTL effects on hind leg muscle volume and hind leg muscle density and analyses revealed no significant difference between carrier and non-carrier lambs. This study did not find any significant effects of the LM-QTL on the hind leg muscle characteristics of width, depth and 2D muscularity measured by CT. Muscularity describes the shape of the muscle and it has been shown that deeper muscles appeal to consumers, as they prefer rounded rather than thin chops (Laville et al., Reference Laville, Bouix, Sayd, Bibe, Elsen and Larzul2004). LM-QTL carrier lambs showed no significant change in muscularity in both the leg and loin regions, as measured from 2D CT scans.
Overall, this trial showed no significant effect of LM-QTL on fat traits (ultrasound fat depth, total carcass fat weight estimated by CT, carcass fat proportion derived from CT measurements or MLC fat class). The non-significance of LM-QTL effects on ultrasound live weight, CT live weight, total lean meat weight estimated by CT, M : B ratio, CCW and KO percentage is not unexpected, as all previously reported effects of this QTL also seem to be restricted to the loin muscle (Nicoll et al., Reference Nicoll, Burkin, Broad, Jopson, Greer, Bain, Wright, Dodds, Fennessy and McEwan1998), which in turn, represents just a small proportion of the whole carcass weight.
LM-QTL and meat quality
Muscle density measured by CT is considered a predictor of meat quality traits (Karamichou et al., Reference Karamichou, Richardson, Nute, McLean and Bishop2006), as it is likely to reflect differences in IMF content. In our study there were no significant differences between LM-QTL carrier and non-carrier lambs in muscle density measured at any of the three CT scan positions. This might suggest that LM-QTL is likely to have no substantial effects on IMF. However, results reported by Jopson et al. (Reference Jopson, Nicoll, Stevenson-Barry, Duncan, Greer, Bain, Gerard, Glass, Broad and McEwan2001) showed that LM-QTL lambs produced lower tenderness values than non-carriers, although this effect was removed by appropriate post-slaughter treatment (chilling, ageing). It would be advisable in future to directly test the tenderness in LM-QTL carrier crossbred lambs, such as those used here, to monitor this aspect of meat quality. In future, if molecular genetic predictors of meat quality were available, these could be used to help counterbalance any negative side effect of LM-QTL on meat quality in a MAS framework (e.g. Gao et al., Reference Gao, Zhang, Hu and Li2007).
LM-QTL effects on MLC-C and F classification and VIA
MLC carcass classification scores for conformation and fat class did not differ significantly between LM-QTL carriers and non-carrier lambs. This result is similar to that reported for TM-QTL by Rius-Vilarrasa et al. (Reference Rius-Vilarrasa, Roehe, Macfarlane, Lambe, Matthews, Haresign and Bünger2009b), who found that crossbred lambs from a similar genetic background to those in our study carrying one copy of TM-QTL showed no significant difference in conformation and fat class scores compared with non-carriers. The results of this study indicate that the current industry carcass evaluation system would not be able to detect the improvement in loin muscle characteristics offered by LM-QTL.
The development of video image technology has made it possible to automatically predict some carcass characteristics such as lean meat yield, SMY and weights of the primal cuts at slaughter chain speed (Rius Vilarrasa et al., Reference Rius-Vilarrasa, Bünger, Maltin, Matthews and Roehe2009a; Hopkins, Reference Hopkins1996). Rius Vilarrasa et al. (Reference Rius-Vilarrasa, Bünger, Maltin, Matthews and Roehe2009a) reported that VIA achieved consistently higher accuracy and precision in predicting the carcass primal cut weights and SMY compared with the MLC classification grading for carcass conformation and fat class, which is in use in UK abattoirs.
Rius-Vilarrasa et al. (Reference Rius-Vilarrasa, Roehe, Macfarlane, Lambe, Matthews, Haresign and Bünger2009b) didnot detect significant difference in VIA-predicted loin dimensions and primal cut weights between TM-QTL carrier and non-carrier lambs using the standard prediction equation produced by E + V Technology, Germany. By contrast, deriving refined prediction equations by calibration against CT measurements it was possible in this previous experiment to detect a significant increase in MLL depth in TM-QTL carrier lambs. Likewise, using standard algorithms, VIA could not detect a significant effect of LM-QTL on increased muscle in the loin region in the current data set (results not reported here). However, the use of the refined prediction equations did detect a significant effect of LM-QTL on trimmed loin primal cut weight predicted by VIA, but not on predictions of other carcass primal cuts or total SMY in this study. The significant increase of +2.2% in trimmed loin primal weight, the cut the market values most highly, was large enough to be reliably detected by VIA in LM-QTL carrier lambs in this data set. This indicates that introducing VIA as the basis for a value-based payment system could have the potential to financially reward producers for an increase in loin weight caused by lambs carrying one copy of the LM-QTL. Moreover, the mode of inheritance of the LM-QTL has yet to be confirmed. If this is found to be additive, larger effects in homozygous lambs might be expected, which could further increase the carcass value. This study also highlights the increased power of VIA, compared with the current grading system, to detect improvements in carcass quality, as the MLC scoring system did not detect any differences between carriers and non-carriers.
Carcass SMY, which is considered the most important trait for meat processors and producers, was not significantly different between LM-QTL carriers and non-carriers when predicted by VIA. This agrees with the effect of LM-QTL on carcass weight and on CT total muscle weight. The loin amounts only to approximately 18% of the total lean weight within the carcass. Consequently, localised changes to loin muscle traits of the magnitudes shown here would not be expected to result in significant changes in VIA-predicted total lean weight.
Comparisons of the performance of the lambs in this study with that of other crossbred lambs sired by terminal sires more typically used in the UK industry (e.g. Texel and Suffolk) are not straightforward, owing to the differences between trials in sire and dam breeds, finishing point, year and many other influencing factors. However, it is of note that the Poll Dorset-sired lambs recorded in this study seem to be within the normal range of carcass weights and grades found for commercial slaughter lambs sired by terminal sire breeds in the United Kingdom. Results of two trials assessing carcass quality in commercially finished lambs produced by Mules ewes mated to Texel, Suffolk and Charollais rams (Ellis et al., Reference Ellis, Webster, Merrell and Brown1997; Lewis et al., Reference Lewis, Haresign, Davies, Roehe, Bünger and Simm2006) reported similar average live weights at slaughter (∼40 to 42 kg) as those reported here. Average CCWs were slightly higher (by approximately 1 to 2 kg) than in the current trial, resulting in similar, or slightly higher, KO percentage. Average subcutaneous fat percentage, estimated from MLC carcass fat grades, was similar to that found here in both previous trials, although average conformation scores were slightly lower in this study (0.4 to 0.5 points on a five-point scale). From these general comparisons, it appears that the lambs in this study do not differ substantially, in terms of slaughter weights and carcass quality traits, from crossbred lambs sired by other terminal sire breeds under UK conditions. However, tissue proportions in the carcass, as estimated by CT scanning at 16 weeks in this study, differ for example from those reported by Ellis et al. (Reference Ellis, Webster, Merrell and Brown1997) for lambs dissected post-slaughter, where average proportion of lean was around 0.54 to 0.57 and proportion of fat around 0.23 to 0.24 (depending on sire breed). The average lean proportion in this study agrees more closely with average dissected lean proportion reported by Lewis et al. (∼0.63), although fat proportion remains lower than the 0.19 to 0.2 found in the previous study. These discrepancies may be due to the fact that the tissue proportions reported for lambs in this study were estimated using CT scanning at 16 weeks of age (at an average live weight of 31 kg), although lambs were not slaughtered until a fixed age of 20 weeks. In the previous studies, lambs were selected for slaughter when they reached a commercial level of ‘finish’ (estimated fat cover or condition) and tissue proportions were estimated by dissection post-slaughter. Although proportion of carcass lean is known to decrease and fat increase with maturity, studies that report dissection results from lambs of different breeds slaughtered at different ages more commonly estimate lean proportions between 0.5 and 0.6 and fat proportions between 0.2 and 0.3 (e.g. McClelland et al., Reference McClelland, Bonaiti and Taylor1976; Kempster et al., Reference Kempster, Cook and Grantley-Smith1986). Nevertheless, the aim in this study was to compare the tissue composition in lambs of different LM-QTL genotype, and the results from CT and from MLC carcass grades imply that tissue proportions across the whole carcass do not differ significantly.
This study showed that one copy of the LM-QTL significantly improved loin muscle traits. This could potentially be exploited through MAS. MAS could be a particularly useful technology in crossbreeding programmes where desirable genotypes from different backgrounds are introgressed into productive local breeds (Van der Werf, Reference Van der Werf2007). However, its use should be integrated into the whole genetic evaluation system by the use of holistic approaches to devise selection rules based on MAS (Van der Werf, Reference Van der Werf2007).
Incorporating LM-QTL in sheep breeding programs in the United Kingdom has the potential to result in improved meat yield of the loin cut. This improvement would also be possible through conventional sheep breeding programmes utilising ultrasound and/or CT measurements of loin muscle depth since the heritability of loin muscle measurements is moderate to high (depth 0.30 ± 0.03, width 0.38 ± 0.10 and area 0.41 ± 0.07) and genetic correlations between live measurements on eye muscle depth, width and area were also high (0.87 to 0.99) (Safari et al., Reference Safari, Fogarty and Gilmour2005). This study also reported that genetic correlations between loin muscle depth and width were moderate (0.28) but the correlations between loin muscle area and depth (0.86) or width (0.74) were much higher, suggesting that selection for one trait would reflect positively to the other trait and eventually improve loin muscle shape. The genetic and phenotypic correlations between loin muscle traits and other economic and welfare-related traits, like growth rate and lambing ease would also be important to consider before incorporating these traits in a breeding programme. Lambe et al. (Reference Lambe, Macfarlane, Masri, Matika, Haresign and Bünger2009) investigated the phenotypic effects LM-QTL on growth patterns of crossbred lambs and reported no significant effects of the presence of LM-QTL. Further study is underway relating the QTL to other relevant production, behavioural and welfare-related traits.
Conclusion
This study evaluated the direct effect of LM-QTL on crossbred lambs in the United Kingdom and successfully confirmed earlier published effects of LoinMAX™ on loin muscle characteristics. LM-QTL positively increased loin muscle traits when measured by ultrasound, CT scanning and VIA. It is important before the benefits of LM-QTL can be fully exploited to assess any possible pleiotropic or/and epistatic effects of the LM-QTL on other economically traits e.g. meat quality, lambing ease, survival, growth rate and efficiency. Additionally, the mode of inheritance is vitally important to account for optimal future breeding programmes. Assuming high-linkage disequilibrium, the provision of estimated QTL EBVs would enable the use of QTLs in breeding programmes irrespective of the lack of knowledge of underlying gene. However, further attempts to fine-map the underlying gene(s) seem to be crucial to guarantee that the marker test remains its value also over future generations.
Acknowledgements
The authors are grateful for the financial support by BBSRC and Defra for this research through LINK (Sustainable Livestock Production Programme). We also thank our industry sponsors and project partners: EBLEX, HCC, QMS, LMCNI, Catapult Genetics, Innovis Genetic Ltd, Welsh Country Foods, EplusV/Germany, ASDA stores, SAMW, Suffolk Sire Referencing Scheme Ltd, British Texel Sheep Society Ltd and Charollais Sire Reference Scheme. We appreciate the assistance from AgResearch Molecular Biology Unit in Dunedin, New Zealand, for carrying out the LM-QTL marker genotyping. We also thank the SAC colleagues at the sheep unit and the CT unit for their technical support and collaboration.