INTRODUCTION
Anthropogenic activities carried on in the coastal areas are the principal source of disturbance of the marine environment. They are increasingly harmful because of the industrial development and the population growth on the littoral. The complexity and the multitude of the factors governing marine life in general require multidisciplinary studies to understand the response of the ecosystems to these disturbances. Each discipline brings, indeed, a contribution more or less large, but necessary, to appreciate the functioning of the ecosystem in affected areas.
In Tunisia, the studies carried out on benthic macrofauna are generally very few. The benthos of Tunis gulf is relatively more studied, and research started with Azouz (Reference Azouz1973), then was recently picked up again by Ayari & Afli (Reference Ayari and Afli2003) and Zaabi & Afli (Reference Zaabi and Afli2005, Reference Zaabi and Afli2006). However elsewhere in Tunisia, benthic macrofauna is not yet studied, except for the work undertaken by Afli & Ben Mustapha (Reference Afli and Ben Mustapha2004) in the Dkhila area. Some other works have been conducted in limited areas, such as those of Zghal & Bouaziz-Azzouna (Reference Zghal and Bouaziz-Azzouna1982), Zaouli (Reference Zaouali1993) and Ben Souissi (Reference Ben Souissi2002). In general, the Mediterranean Sea is of the sub-wet shade climate type. The summer is hot and dry, and the winter is cool and rainy. These general particularities and also some other regional characteristics, such as the fluctuations of floods, temperature and salinity give some specificities to the Mediterranean biocoenoses (Pérès, Reference Pérès1972; Bellan-Santini et al., Reference Bellan-Santini, Lacaze and Poizat1994; Lardicci et al., Reference Lardicci, Rossi and Castelli1997; Albertelli et al., Reference Albertelli, Covazzi-Harriague, Danovaro, Fabiano, Fraschetti and Pusceddu1999; Salen-Picard & Arlhac, Reference Salen-Picard and Arlhac2002).
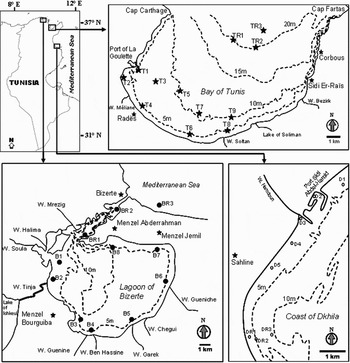
This study aims to compare the trophic organization of the benthic macrofauna assemblages in three coastal sites, more or less exposed to various anthropogenic activities and differing, according to their opening to the sea (Figure 1). The first one (coast of Dkhila) is completely open to the sea. The second (bay of Tunis) is half-closed. Whereas, the third one (lagoon of Bizerte) is practically closed. It communicates with the sea only by a narrow ship canal. Nevertheless, the three sites assemble the threats of disturbance generated by the increasing anthropogenic activities.
Maps of the study sites showing the locations of the sampling stations.

Study sites
LAGOON OF BIZERTE
Bizerte lagoon covers an area of approximately 128 km2. Its maximum depth is around 12 m. It communicates, in the north, with the Mediterranean sea by a 7 km length canal and, in the south, with the Ichkeul lake by the Tinja wadi. The principal wadis which feed Bizerte lagoon with freshwater are the wadis of Tinja, Mrezig, Garek, Ben Hassine and Gueniche (Soussi, Reference Soussi1981). Bizerte lagoon is subject to the influence of several physical factors strongly fluctuating during the year. In winter the freshwater flow coming from the Ichkeul lake and several wadis is more important, and in summer the influence of seawater is more interesting (Sakka Hlaili et al., Reference Sakka Hlaili, Chikhaoui, El Grami and Hadj Mabrouk2003). So, the seasonal gradient of the water salinity in Bizerte lagoon is relatively high. It varies on average from 20 g/l in winter to 40 g/l in summer (Harzallah, personal communication).
Bizerte lagoon is known, these last decades, by the aquaculture of the mussel Mytilus galloprovincialis Lamarck, 1819 which reproduces in the lagoon naturally. It is also a natural environment, favourable to the growth of oysters, especially the European flat oyster Ostrea edulis Linnaeus, 1758 with high growth rate in spring, and the Japanese oyster Crassostrea gigas (Thunberg, 1793) which grows throughout the year. The Japanese clam Tapes (Ruditapes) decussatus (Linnaeus, 1758) is also relatively abundant in the site and is subjected to commercial collection. The total production of fishing in Bizerte lagoon is around 90 tons a year (Bejaoui, Reference Bejaoui1998).
The Bizerte lagoon ecosystem is currently destabilized. The worn water rejections coming from the bordering towns increase with demographic growth (Dellali et al., Reference Dellali, Elbour and Aïssa2001). The human population around the lagoon is estimated in 2004 at 163,000 inhabitants (census of 2004) of which approximately 70% are concentrated in Bizerte town. Industries (iron and steel plant, cement factory and refinery) are established on its circumference (Essid & Aissa, Reference Essid and Aissa2002). The construction of dams in the Ichkeul lake upstream has strongly affected its natural equilibrium (Riera et al., Reference Riera, Stal, Nieuwenhuize, Richard, Blanchard and Gentil1999, Reference Riera, Stal and Nieuwenhuize2002). The supply of fresh water in the lagoon fell, therefore, from 165 to only 20 million m3 a year after the construction of these dams (Harzallah, Reference Harzallah2003).
BAY OF TUNIS
Tunis bay is a depression in the south of Tunis gulf of approximately 350 km2. Few wadis feed Tunis bay with freshwater, but the most important is Méliane wadi (Ben Charrada, Reference Ben Charrada1997).
The dominant winds come from the north-western sector and cause swells during the cold season carrying alluvia to the south and the south-east (Ben Charrada, Reference Ben Charrada1997). The average depth of Tunis bay is low and does not exceed 31 m, and water movements are controlled by currents generated by winds (Zarrad, Reference Zarrad2001; Ayari & Afli, Reference Ayari and Afli2003).
For a few years, the littoral of Tunis gulf has been subjected to industrial, urban and tourist development. Significant commercial and fishing activities in the harbour of La Goulette, Radès and Tunis have been noted, as well as the thermal discharges of the Radès power station. The population of Tunis City, of its northern and southern suburbs, was estimated in 2004 approximately at 2,250,000 inhabitants. On the other hand Méliane wadi discharges directly and permanently into the bay and also by the effluents of the water-treatment plant of ‘Sud Méliane’, with some uncontrolled industrial wastes (Azouz, Reference Azouz1973; Oueslati, Reference Oueslati1993; Ben Charrada, Reference Ben Charrada1997). Further east, the area receives the effluents of three other water-treatment plants as well as waste water discharges of other coastal agglomerations, such as the town of Korbous (4000 inhabitants). Also, the presence of the food-processing industry and of the sources of thermal water (Korbous) constitute potential sources of pollution in the long term.
COAST OF DKHILA
The coastal zone of Dkhila is completely open to the sea. The depth of the sampled area does not exceed 10 m. The only wadi feeding Dkhila coast with freshwater is Hamdoun wadi (Afli & Ben Mustapha, Reference Afli and Ben Mustapha2004). The harmful effects which could occur in the zone would be the urban rejections of the neighbouring cities and the development of balneal tourism in the zone. The town of Sousse, bordered in the south by the Sidi Abdel-Hamid port, is considered the most important agglomeration of the zone with approximately 173,000 inhabitants, while the small town of Sahline counts only approximately 15,000 inhabitants. In summer, the population increases with the reception of visitors and holidaymakers.
In addition, a power station located between the Sidi Abdel-Hamid port and the Hamdoun wadi uses seawater to cool the engines. It pumps the water from the port, near the D2 station, and rejects it hotter into the Hamdoun wadi, near the D3 station. Afli & Ben Mustapha (Reference Afli and Ben Mustapha2004) conducted a study on the benthic assemblages of the site. They showed the existence of first signs of pollution in the port and in the wadi mouth.
MATERIALS AND METHODS
Sampling and laboratory procedures
In total, 31 stations were sampled, 11 in Bizerte lagoon, 12 in Tunis bay and 8 in Dkhila coast (Figure 1). In each site, 3 stations further away from the potential sources of disturbance were considered as stations of reference. The marine surveys were carried out in beginning of winter (November–December) aboard a research vessel, and samples were collected by a 0.1 m2 Van Veen grab which penetrated approximately 10 cm into the sediment (Borja et al., Reference Borja, Franco and Pérez2000; Rosenberg et al., Reference Rosenberg, Blomqvist, Nilsson, Cederwall and Dimming2004). Based on a variety of criteria, calculations of the minimum required sampling surface were estimated to three samples to determine the number of species present in the community as well as their abundance and diversity (Cain & Castro, Reference Cain and Castro1959; Boudouresque & Belsher, Reference Boudouresque and Belsher1979; Martín et al., Reference Martín, Ballesteros, Gili and Palacín1993; Gómez Gesteira & Dauvin, Reference Gómez Gesteira and Dauvin2005). Thus, four samples were collected at each station, three intended for fauna study and another one for the particle size composition of the sediment.
At the laboratory, samples for fauna study were also sorted out with fresh water, on a square mesh of 1 mm a side (Borja et al., Reference Borja, Franco and Pérez2000; Grall & Glémarec, Reference Grall and Glémarec2003; Gómez Gesteira & Dauvin, Reference Gómez Gesteira and Dauvin2005; Dauvin et al., Reference Dauvin, Ruellet, Desroy and Janson2007). The animals collected were preserved with diluted alcohol (70%) before being identified, for most of them, up to species level. The particle size composition of the sediment was determined by drying for 48 hours at 60°C, then washed through a 63 µm sieve in order to eliminate the thin fraction (silt and clay) (Afli & Chenier, Reference Afli and Chenier2002). The refuse was dried again at 60°C, after that all samples were sieved on AFNOR succession meshes. Consequently, the quantity of sediment recovered in each sieve represents the sedimentary fraction of size ranging between its meshes and those of the top sieve.
Data analysis
The classification of the sediments was carried out according to Shepard's diagram (Shepard, Reference Shepard1954) by placing each station in the triangular diagram according to the three principal fractions (mud, sand and gravel). Then, the determination of the sediment type was realized by using Chassé & Glémarec principles (Chassé & Glémarec, Reference Chassé and Glémarec1976).
The identified species were classified into the trophic groups by using the feeding guides established by Fauchald & Jumars (Reference Fauchald and Jumars1979) and used then by Grall & Glémarec (Reference Grall and Glémarec1997), Afli (Reference Afli1999a) and Afli & Glémarec (Reference Afli and Glémarec2000):
– Herbivores (H): algae-feeding organisms (e.g. some echinids).
– Scavengers (N): feed on carrions deposited on the bottom (essentially gastropods and decapods).
– Detritus feeders (Dt): feed on particulate organic matter, essentially vegetable detritus (mainly amphipods and tanaids).
– Carnivores (C): predatory animals (mobile polychaetes, sea-anenomes).
– Micrograzers (µG): feed on benthic microalgae, bacteria and detritus (essentially polyplacophores and gastropods).
– Suspension feeders (S): feed on suspended food in the water column (e.g. most bivalves).
– Selective deposit feeders (SDF): feed on organic particles which settle on the sediment (most sedentary polychaetes).
– Non-selective deposit feeders (NSDF): burrowers which ingest the sediment from which they take their food.
Also, the principal biodiversity parameters were determined at each station. The abundance (A) is the average number of individuals per surface unit, generally carried forward to one m2. The specific richness (S) is the cumulated number of species in a station or in a site. The Shannon–Wiener index (H′) (Shannon & Weaver, Reference Shannon and Weaver1963) permits to describe the distribution of the individuals into the various species. It is calculated at each station by the following formula:
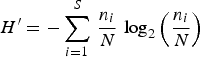
where n i is the number of individuals of the species i, N is the total number of individuals and S is the number of species at the station.
The equitability E(H′) (Pielou, Reference Pielou1966a, Reference Pieloub) is calculated at each station by the following formula:
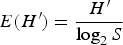
The H′ and E(H′) indices are used together to compare the biodiversity in the sampled stations.
The percentage of occurrence (P) is also calculated for each species and at each site by using the formula P = m/M where m is the number of stations where the species is present and M is the total number of stations in the site.
To assemble the similar stations on the trophic level and characterize them by the principal trophic groups, a correspondence factor analysis (CFA) was carried out on data organized in rectangular matrices where the 31 stations occupy the columns and the trophic groups occupy the lines (Hill, Reference Hill1974; Lebart et al., Reference Lebart, Morineau and Fenelon1982).
For the assessment of the environmental quality, Pearson & Rosenberg (Reference Pearson and Rosenberg1978) were the pioneers using synthetic parameters relating to benthic macrofauna to evaluate the ecological state of the communities. Their model SAB used the variability of the Specific richness (S), the Abundance (A) and the Biomass (B) in an organic gradient. Then several other methods and biotic indices were established (Dauvin et al., Reference Dauvin, Ruellet, Desroy and Janson2007). In this study, the AZTI Marine Biotic Index (AMBI) (Borja et al., Reference Borja, Franco and Pérez2000) was used. It defines the benthic coefficient (BC), calculated on the basis of the 5 ecological groups (EGI, sensitive species; EGII, indifferent species; EGIII, tolerant species; EGIV, second-order opportunistic species; and EGV, first-order opportunistic species) as following:

This BC allows to define 5 stages of degradation relating to the calculated values. AMBI is considered among the more efficient biotic indices based on benthic macrofauna, especially if it is used jointly with specific richness and abundance (Simboura, Reference Simboura2004; Muniz et al., Reference Muniz, Venturini, Pires-Vanin, Tommasi and Borja2005). Species were assigned to the 5 ecological groups according to the classification of Afli (Reference Afli1999a, Reference Aflib), Borja et al. (Reference Borja, Franco and Pérez2000), Afli & Chenier (Reference Afli and Chenier2002), Simboura & Zenetos (Reference Simboura and Zenetos2002), Grall & Glémarec (Reference Grall and Glémarec2003), Afli & Ben Mustapha (Reference Afli and Ben Mustapha2004) and Reiss & Kröncke (Reference Reiss and Kröncke2005).
RESULTS
Sediment
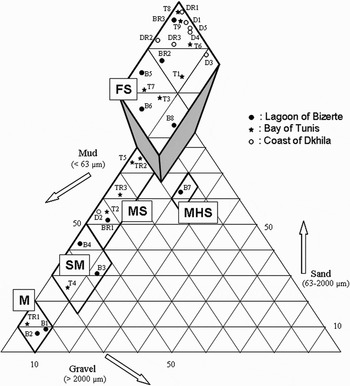
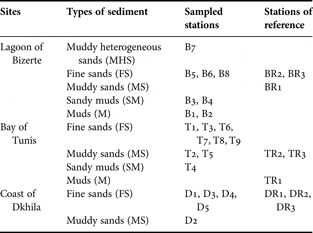
Shepard's diagram (Shepard, Reference Shepard1954) shows that the sediment at the sampling stations is fine (Figure 2). It is constituted principally of mud and sand. According to Chassé & Glémarec principles (Chassé & Glémarec, Reference Chassé and Glémarec1976), it belongs to 5 types (muddy heterogeneous sands, fine sands, muddy sands, sandy muds and muds). In Bizerte lagoon, all these sediment types are represented (Table 1). In Tunis bay, only muddy heterogeneous sands are not observed. However the Dkhila stations are classified only in fine sands and muddy sands.
Particle size composition of the sediment determined at the sampling stations according to Shepard's diagram. MHS, muddy heterogeneous sands; FS, fine sands; MS, muddy sands; SM, sandy muds; M, muds.

Sediment types determined by using Shepard's diagram and the Chassé & Glémarec principles.

Fauna
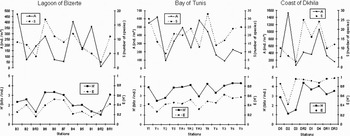
In Tunis bay (Figure 3), abundance varies from 90 (T3) to 620 ind/m2 (T1), specific richness from 9 (T2) to 33 species (T8) and equitability from 0.27 (T1) to 0.63 (T3). Regarding the site of Dkhila, abundance varies from 50 (D3) to 1520 ind/m2 (D2), specific richness from 3 (D3) to 25 species (DR2) and equitability from 0.43 (D2) to 0.98 (DR3). Whereas Bizerte lagoon appears more impoverished, abundance varies from 10 (BR2) to 470 ind/m2 (B3), specific richness from 2 (BR2) to 17 species (B6) and equitability from 0.15 (B1) to 0.52 (B8).
Spatial variability of the principal biodiversity parameters: abundance (A), specific richness (S), Shannon–Wiener index (H′) and equitability (E).

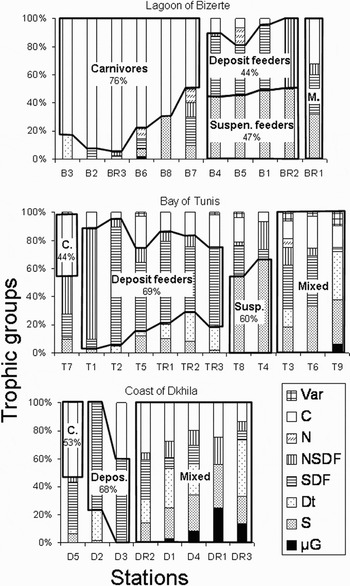
The predominance of the trophic groups (Figure 4) shows great differences between the three sites, but also between the stations of each site:
Predominance of the trophic groups at sampling stations in the study sites. Var, various; C, carnivores; N, scavengers; NSDF, non-selective deposit feeders; SDF, selective deposit feeders; Dt, detritus feeders; S, suspension feeders; µG, micrograzers.

– In Bizerte lagoon, 6 stations (B3, B2, BR3, B6, B8 and B7) are dominated at 77% on average by the carnivores. Four others (B4, B5, B1 and BR2) are co-dominated by the deposit feeders (44%) and suspension feeders (47%). In this site, only BR1 seems heterogeneous at the trophic plan with about equivalent proportions.
– In Tunis bay, carnivores are clearly dominant only at T7 with about 44%, deposit feeders dominate with approximately 69% on average in half of the stations (T1, T2, T5, TR1, TR2 and TR3) and suspension feeders dominate at T8 and T4 with nearly 60%. Whereas, the other stations of this site (T3, T6 and T9) are represented by several trophic groups and with, more or less, equivalent proportions.
– In Dkhila coast, carnivores dominate only at D5 (53%), deposit feeders at D2 and D3 (68%) and the other stations (DR2, D1, D4, DR1 and DR3) are balanced on the trophic level.
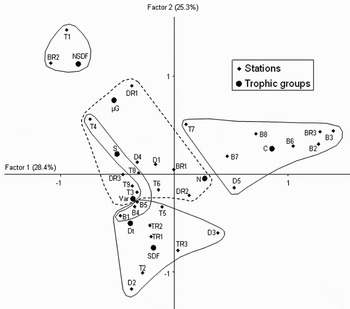
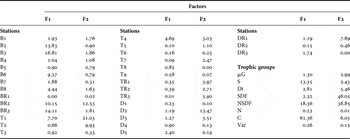
Only the first two factors of the CFA, carried out on the respective proportions of the trophic groups at the 31 sampled stations, were considered. The first represents 28.4% and the second 25.3% of contributions (Figure 5). The trophic groups having high contributions (Table 2) are the carnivores (67% on the first 2 factors), the NSDF (55%), the SDF (48%) and the suspension feeders (16%). For the stations, those of Bizerte lagoon contribute more in this analysis (23% for BR2, 16% for BR3, 18% for B3, 14% for B2 and 10% for B6). Nevertheless, the station which contributes more in this CFA is T1 (28%) which is located in Tunis bay, whereas the Dkhila stations do not have high contributions, except D2 (15%).
Results of the correspondence factor analysis carried out on the percentages of trophic groups at the sampling stations.

Contributions of stations and trophic groups at the 2 first factors in the correspondence factor analysis.

In this CFA, the regrouping of the stations according to the predominance of the trophic groups distinguishes, all in all, 4 groups. The first one is located in the positive values of the first two factors. It is mainly made up of Bizerte lagoon stations and characterized by the carnivores. The second group is located in the negative values of the factor 2 and is characterized by the presence mainly of Tunis bay and Dkhila stations. In the negative values of factor 1 and the positive values of factor 2, BR1 and T1 are consolidated with the NSDF and form the third group. Finally, in the centre of the graph, a large group assembles the other ‘heterogeneous’ stations with the other trophic groups. It should be noted that the stations with predominance of suspension feeders (B4, B5, B1, BR2, T8 and T4) are not well consolidated in this CFA. They form, so, a rather diffuse group.
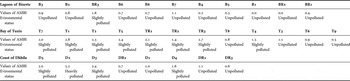
Calculated values of the AMBI define 3 environmental statuses in the studied sites (Table 3). ‘Heavily polluted’ only at D2, ‘slightly polluted’ at BR3, T1, T2, T4, T5, T7, TR1, TR2, TR3, D3, D4 and D5 and ‘unpolluted’ at the other sampled stations.
Values of the AZTI Marine Biotic Index (AMBI) calculated at the sampled stations and their corresponding environmental status.

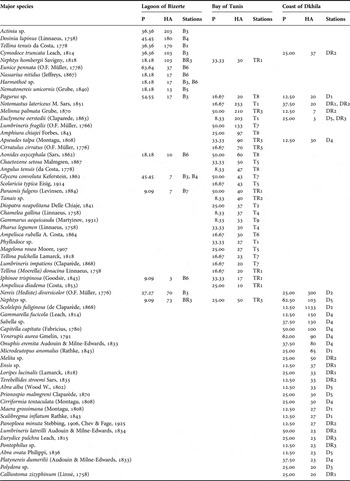
Table 4 assembles the major species collected in the three study sites. It shows that there are very few common species in the study sites, and Tunis bay and Dkhila coast appear richer in species compared to Bizerte lagoon. The polychaetes are the main important species in the two sites and the higher specific abundance is registered by Scolelepis fuliginosa (1133 ind/m2) at the D2 Dkhila port station. Other species, such as the polychaetes Nereis diversicolor (300 ind/m2 at D2), Capitella capitata (100 ind/m2 at D4), the genus Sabella (130 ind/m2 at D4) and the amphipoda Gammarella fucicola (150 ind./m2 at D4) are well represented in the Dkhila site. In Tunis bay, Notomastus latericeus (253 ind/m2 at T1), Melinna palmata (210 ind/m2 at TR3), Euclymene oerstedii (203 ind/m2 at T1) and Lumbrineris fragilis (133 ind/m2 at T7) represent the major species. However, in Bizerte lagoon other taxonomic groups are present, such as the Anthozoa genus Actinia (203 ind/m2 at B3) and the bivalves Dosinia lupinus (180 ind/m2 at B4) and Tellina tenuis (170 ind/m2 at B1) and the isopod Cymodoce truncata (103 ind/m2 at B3).
Major species with their percentages of occurrence by site (P) and the high abundances (HA, ind/m2) registered at the three study sites.

DISCUSSION
Ecological studies on the benthic fauna note the importance of sedimentary texture for the communities' distribution. Certain species colonize the very fine sediments in which they build tubes or other protecting biogenic constructions of mud, such as the polychaete Melinna palmata. Others prefer the sand or the coarse sediment which has important porosities (Desroy & Retière, Reference Desroy and Retière2001). Thus, sedimentary texture is a paramount factor for the benthic communities' study which should not be neglected (Glémarec & Hily, Reference Glémarec and Hily1981; Hily, Reference Hily1984; Le Bris, Reference Le Bris1988; Dauvin et al., Reference Dauvin, Thiébaut, Gomez Gesteira, Ghertsos, Gentil, Ropert and Sylvand2004). In order to minimize the role of sedimentary texture in the spatial variability of benthic communities in this work, selected study sites are constituted exclusively of fine sediment, mainly mud and sand. The only station constituted of coarse sediment is B7, but the proportion of the gravel does not exceed 21%.
The description of the studied sites shows clearly that Tunis bay is more exposed to anthropogenic activities induced by the industry and the urban rejections. However, Bizerte lagoon appears more remarkable because it is currently in front of many environmental variables related to its very particular position into the lagoonal complex. It is influenced, at the same time, by seawaters coming from the ship canal and also by freshwaters coming from Ichkeul lake and a large catchment area. Consequently, several additional factors can influence the benthic macrofauna biodiversity (Desroy et al., Reference Desroy, Warembourg, Dewarumez and Dauvin2003), mainly the extreme conditions of salinity and temperature, the fluctuation of nutrient supply of continental origins and the slowness of the water renewal.
The stations of reference, yet selected far from the supposed disturbance sources, do not show, significant differences compared to the other stations, except perhaps Dkhila coast. For Bizerte lagoon, they are biologically poor; two among the three reference stations (BR2 and BR3) count respectively only 2 and 4 species. These areas seem affected by the urban inputs of the Bizerte town which extends on both sides from the ship canal connecting the lagoon to the sea.
Overall, in Tunis bay H′ and E(H′) show less fluctuation compared to the two other sites, but the abundance and the specific richness appear higher on average than those of Bizerte lagoon, and not significantly different from those of Dkhila coast. The analysis of these parameters, station by station, shows already the first signs of degradation, it is the case for example of the marine area under influence of the lagoon and the town of Bizerte (BR3), of the harbour areas of La Goulette (T1) and Sidi Abdel-Hamid (D2) and of the mouth of Hamdoun wadi (D3) where the Shannon–Wiener index and equitability are relatively low. This situation becomes very critical in Sidi Abdel-Hamid port where abundance is very high and specific richness is low, which shows that only some opportunistic species, such as the polychaete Scolelepis fuliginosa, benefit from the situation and develop more to reach high densities (Margalef, Reference Margalef1968; Odum, Reference Odum1969).
On the other hand, the analysis of the trophic structure in the study sites shows remarkable differences:
In Tunis bay, the mud deposit feeder polychaetes are present in the vicinities of the La Goulette port (T1 and T2) and also in open sea (T5, TR1, TR2 and TR3). They are represented essentially by SDF such as Melinna palmata, Cirratulis cirratus and Chaetozone setosa, except for T1 which is dominated at more than 80% by NSDF, mainly Notomastus latericeus and Euclymene oerstedii. It is also the case of Dkhila, at the harbour level (D2) where Scolelepis fuliginosa reaches a specific abundance record (1133 ind/m2) and in the Hamdoun wadi (D3) where the polychaete genus Polydora and the bivalve Abra ovata represent the major species. In wadis' mouths where freshwater coming from the continent is charged with organic matter pulled by the currents, the suspension feeders are predominant (Riera et al., Reference Riera, Stal and Nieuwenhuize2002; Riera, Reference Riera2007), like at T4 in front of the Méliane wadi, and T8 in front of Soltan wadi where the Ophiuroid Amphiura chiajei is notably present. It is also the case in Bizerte lagoon, but this time the suspension feeders co-dominate with the deposit feeders, a priori, because of the current weakness which allows organic matter of continental origin to decant on the bottom and constitute a food resource for the deposit feeders (Kiørboe & Mohlenberg, Reference Kiørboe and Mohlenberg1981; Solis-Weiss et al., Reference Solis-Weiss, Aleffi, Bettoso, Rossin, Orel and Fonda-Umani2004). This situation concerns mainly the stations located in front of the Guenine and Ben Hassine wadis (B4), of Garek and Chegui (B5) and also of Halima and Soula (B1) where the bivalves Dosinia lupinus and Tellina tenuis are predominant. However, at BR2 ship canal station, the very low values of the abundance and also of the specific richness do not allow to discuss the obtained results.
In general Dkhila coast appears, on the trophic structure, the most balanced area, and then Tunis bay presents some trophic imbalance signs. But the most remarkable observation is the very strong domination of the carnivores in the majority of the Bizerte lagoon stations. Even if the community is dominated in these stations by the carnivores, it remains even so more diversified at the taxonomic level since several groups, such as the anthozoa genus Actinia, the isopod Cymodoce truncata and the polychaetes Nephtys hombergii and Eunice pennata, share the resources. Actinia develops well in Bizerte lagoon because it tolerates the extreme fluctuations of temperature and salinity. However, Cymodoce truncata is normally characteristic of Posidonia beds, especially on routs in the deep infralittoral (Dumay, Reference Dumay1971). According to Castelló & Carballo (Reference Castelló and Carballo2001), it can develop also in fine sediments and at 0–20 m depth provided that it finds favourable conditions. Normally, the presence of carnivores in an ecosystem in a balanced state should not exceed a certain share, and their role is to control the community and prevent the monopolization of the resources (food and space) by some populations (Afli & Glémarec, Reference Afli and Glémarec2000). In Bizerte lagoon, the very strong domination of the carnivores raises a great question about the food resource origins ensuring the functioning of the benthic community and also about the trophic balance of the area.
Essid & Aïssa (Reference Essid and Aissa2002) analysed the principal physicochemical parameters in Bizerte lagoon. The recorded values showed a certain homogeneity level, except the low of the oxygen rate in water column, and the strong rate of the total organic carbon in the sediments, in some places of the lagoon. This strong carbon concentration could explain the noted deficit of oxygen which is necessary for the microbial degradation of the organic matter (Brandes & Devol, Reference Brandes and Devol1997; Heilskov & Holmer, Reference Heilskov and Holmer2003). Consequently, the mineral particles associated to organic compounds favour the formation of organo-mineral complexes (Aloisi & Monaco, Reference Aloisi and Monaco1975) resulting from electrochemical and organo-mineral flocculation. While trapping metal particles, the organo-mineral aggregates thus formed make them less available for epibenthic fauna, such as the majority of the polychaetes (Cauwet, Reference Cauwet1985). This phenomenon is well known in the Mediterranean lagoonal areas (Aloisi et al., Reference Aloisi, Monaco and Pauc1975). Several studies carried out in some Mediterranean areas show the particularities of the organization of the macrobenthic communities, especially concerning their trophic structure (Pérès, Reference Pérès1972; Lardicci et al., Reference Lardicci, Rossi and Castelli1997; Albertelli et al., Reference Albertelli, Covazzi-Harriague, Danovaro, Fabiano, Fraschetti and Pusceddu1999; Salen-Picard & Arlhac, Reference Salen-Picard and Arlhac2002).
In addition, for the total organic carbon rate in the sediments, Dellali (Reference Dellali1996) recorded rates from 1.8 to 9.1% in Bizerte lagoon. Beyrem (Reference Beyrem1999) recorded rates between 0.8 and 2.1% in the Ichkeul lake, whereas in the Ghar El Melh lagoon, adjacent on the east side to Bizerte lagoon, Mansouri (Reference Mansouri1979) recorded rates from 0.64 to 5.42% and Hamouda (Reference Hamouda1996) between 0.79 and 5.12%. Consequently, Bizerte lagoon presents a relatively high organic matter rate; it seems to suffer from a generalized eutrophication because, in particular, of the rejections of the Bizerte refinery and the oil port (Grall & Glémarec, Reference Grall and Glémarec1997; Afli, Reference Afli1999b; Glémarec & Grall, Reference Glémarec and Grall2000). According to Beyrem et al. (Reference Beyrem, Mahmoudi and Aissa2002), the trophic structure of benthic assemblages in the eutrophized areas bordering the Bizerte lagoon, depends mainly on the water contents of salts and dissolved oxygen, and also of the sedimentary rates of fine fraction, organic matter and hydrocarbons.
According to Sakka Hlaili et al. (Reference Sakka Hlaili, Chikhaoui, El Grami and Hadj Mabrouk2003), the ultraphytoplancton in Bizerte lagoon is mainly constituted of small flagellates and cyano-bacterium. These small autotrophic cells can be grazed only by microplanctonic protozoa, ciliates and large flagellates (Sanders & Wickham, Reference Sanders and Wickham1993; Sakka et al., Reference Sakka, Legendre, Gosselin and Delesalle2000). Then, these grazers will convey the carbon produced by the small phototrophic organisms towards the large metazoan. So the trophic chain in Bizerte lagoon, in the water column and also into the sediment, is apparently of microbial type where the major participants are micro-organisms. This chain is completely different from the herbivore trophic structure in which the large cells (diatoms) which dominate the ecosystem are consumed by the mesozoobenthos. In a general context, the two types of trophic chains, microbial and herbivore, play different roles in the carbon cycle since they differently transfer biogenic carbon towards the higher trophic levels (Legendre & Rassoulzadegen, Reference Legendre and Rassoulzadegen1996). In Bizerte lagoon, this process is supported by the strong concentrations of the microplancton (Sakka Hlaili et al., Reference Sakka Hlaili, Chikhaoui, El Grami and Hadj Mabrouk2003).
On another plan, urban and industrial inputs in Bizerte lagoon need, on average, 10 days to arrive at the ship canal. But to leave definitively the lagoon, they need approximately 7 months because the canal connecting the lagoon to the sea is very narrow and very long (7 km) (Harzallah, Reference Harzallah2003). Consequently, the Bizerte lagoon concentrates, permanently and on average, the rejections of approximately 7 months. On the other hand, in the other study sites the water renewal is much faster since they are open to the sea and the water dynamic is more interesting (Desroy et al., Reference Desroy, Warembourg, Dewarumez and Dauvin2003).
If the AMBI classifies the main exposed areas to pollution conditions in Tunis bay and Dkhila coast as in a slightly polluted state, Bizerte lagoon appears, despite the large recorded trophic imbalance, in an unpolluted state, except for the marine station facing Bizerte town. The question raised here does not concern the presence of sensitive species in such hard conditions, because their abundance is relatively low. But the real question is why the opportunistic species do not develop in the areas which seem favourable to their presence. In fact, this lagoon is quite particular and the response of the benthic communities to environmental conditions seems notable. It is enough that certain climatic factors are strongly fluctuating at any moment of the year, so that the whole system can destabilize completely, and the trophic chain can break down in some places of the site (Albertelli, 1999).
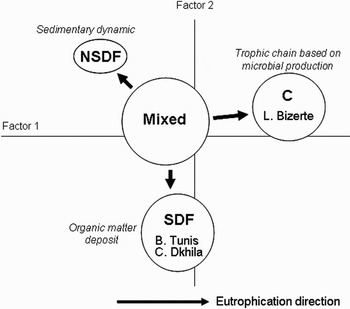
The correspondence factor analysis shows that the centre of the graph assembles the heterogeneous stations on the trophic level, whereas the stations with predominance of one trophic group are placed in the extremities of the graph. Thus and while being focused essentially on trophic groups and stations having a strong contribution in this analysis, the graph can be simplified (Figure 6). Two sets can, thus, be separated according to the degree of eutrophication. The first one is composed mainly of Bizerte lagoon stations dominated by carnivores. This set corresponds to the eutrophized stations and the microbial trophic chain. The second set is composed of the other groups. The centre of the graph is occupied by the most diversified stations in trophic groups, mainly Dkhila and Tunis bay stations. In the bottom of the graph, the SDF form a small and well consolidated group composed essentially of Tunis bay stations and some Dkhila ones. This group seems to benefit from the deposits on the organic matter funds because of the deceleration of the marine currents. Some other stations, completely separated, form a small group because of the supremacy of NSDF. It seems that the sediment in these zones is continuously moved, which allows organic matter to be inserted in-depth where the trophic group feeds.
General schema of the correspondence factor analysis.

CONCLUSION
Tunis bay and Dkhila coast appear, today, more balanced on the trophic level, while Bizerte lagoon presents some eutrophication signs and a great trophic imbalance due to industrial and urban activities exerted around the area. The relatively very slow renewal of the Bizerte lagoon waters worsens the problem still more. In this case, the analysis of the current situation should not dissociate this lagoon from the Ichkeul lake with which it communicates permanently via the Tindja wadi. Indeed, the Ichkeul lake more confined, therefore more productive, seems the essential feeder of this lagoon, little confined, of trophic sources and allows some aquaculture activities. But in spite of this provisioning of freshwater, nutritive salts and primary production coming from the Ichkeul lake, and also from the bordering wadis, the Bizerte lagoon ecosystem cannot, now, function normally, and currently presents a phenomenon of eutrophication, more or less generalized, and an anoxia state into the sediment. This state induces deep changes in the macrofauna trophic organization by substitution of the herbivore chain by the microbial chain. Under these conditions, the ecosystem becomes very selective and only some species endowed with great capacities to resist anoxia conditions can survive. This situation is certainly not stable and the general state of the lagoon could worsen more and threaten the aquacultural activities which are exerted there. It would be, so, very interesting to study seasonal variability of the benthic assemblages in Bizerte lagoon linked to the physico-chemical parameters, as the heavy metals and biomarkers, in the environment and also in organisms surviving under such hard conditions. This will allow the understanding, in detail, of the seasonal variability of the trophic structure and its resistance level to the environmental and anthropogenic fluctuations.
ACKNOWLEDGEMENTS
This work was undertaken within the framework of the project ‘EBHaR’ co-financed by the Tunisian Ministry of Higher Education, Scientific Research and Technology, and also by the Islamic Development Bank. Many thanks to those who contributed to the field and laboratory components of this project.