1 Introduction
The electrohydrodynamics (EHD) of the so-called giant unilamellar vesicles has received much attention in the recent past (Perrier, Rems & Boukany Reference Perrier, Rems and Boukany2017; Vlahovska Reference Vlahovska2019). Vesicles share the same structural component of a biological cell, the bilipid membrane, and hence their EHD has been a paradigm for understanding how general biological cells behave under an electric field. The dynamics of this system is characterized by a competition between viscous, elastic, and electric stresses on the individual membranes and the non-local hydrodynamic interactions. Studying the microstructural response of isolated vesicles and vesicle pairs subjected to electric fields can bring insights into the macroscopic properties of vesicle suspensions. Several recent theoretical and numerical works have focused on isolated, nearly spherical (or circular) vesicles; however, the dynamics of highly deformable deflated vesicles as well as the pairwise dynamics of vesicle suspensions remain largely unexplored. The primary focus of this work is to develop a robust numerical scheme to enable study of these dynamics.
Theoretical investigation of vesicle EHD has been done via small deformation theory (Vlahovska et al. Reference Vlahovska, Gracia, Aranda-Espinoza and Dimova2009; Schwalbe, Vlahovska & Miksis Reference Schwalbe, Vlahovska and Miksis2011) and semi-analytic studies using spheroidal models (Nganguia & Young Reference Nganguia and Young2013; Zhang et al. Reference Zhang, Zahn, Tan and Lin2013). Numerical solutions of the coupled electric, elastic and hydrodynamic governing equations were computed using boundary integral equation (BIE) methods (McConnell, Miksis & Vlahovska Reference McConnell, Miksis and Vlahovska2013; Salipante & Vlahovska Reference Salipante and Vlahovska2014; Veerapaneni Reference Veerapaneni2016) and immersed interface or immersed boundary methods (Kolahdouz & Salac Reference Kolahdouz and Salac2015; Hu et al. Reference Hu, Lai, Seol and Young2016). Advantages of BIE methods are well known – exact satisfaction of far-field boundary conditions eliminating the need for artificial boundary conditions, reduction in dimensionality leading to reduced problem sizes, and well-conditioned linear systems through carefully chosen integral representations.
All of the aforementioned works, however, considered the EHD of a single vesicle only. Vesicles are known to segregate when subjected to electric fields (Ristenpart et al. Reference Ristenpart, Vincent, Lecuyer and Stone2010), and thus pose significant challenges for direct numerical simulations. In the case of BIE methods, for instance, the integral representations of the hydrodynamic and electric interaction forces become nearly singular, requiring specialized quadratures. Domain discretization methods, on the other hand, require finer meshes (locally, in the case of adaptive methods), worsening the conditioning issue of linear systems and increasing the overall computational cost.
Leveraging on our recently developed spectrally accurate algorithm for evaluating nearly singular integrals (Barnett, Wu & Veerapaneni Reference Barnett, Wu and Veerapaneni2015) and the second-kind BIE formulation for three-dimensional vesicle EHD (Veerapaneni Reference Veerapaneni2016), we develop a BIE method for simulating multiple vesicle EHD in this work. We apply the method to analyze the pairwise interactions in a monodisperse suspension. We provide the integral equation formulation and the description of our numerical method in § 2, followed by analysis and discussion of the results in § 3.
2 Problem formulation
2.1 Governing equations
Let us first consider a single vesicle suspended in a two-dimensional unbounded viscous fluid domain, subjected to an imposed flow
 $\boldsymbol{v}_{\infty }(\boldsymbol{x})$
, for any
 $\boldsymbol{x}\in \mathbb{R}^{2}$
. The vesicle membrane is denoted by
 $\unicode[STIX]{x1D6FE}$
. Assume that the fluids interior and exterior to
 $\unicode[STIX]{x1D6FE}$
have the same viscosity
 $\unicode[STIX]{x1D707}$
and the same dielectric permittivity
 $\unicode[STIX]{x1D716}$
while their conductivities differ, given by
 $\unicode[STIX]{x1D70E}_{i}$
and
 $\unicode[STIX]{x1D70E}_{e}$
, respectively. In the vanishing Reynolds number limit, the governing equations for the ambient fluid can then be written as
 $$\begin{eqnarray}\displaystyle & -\unicode[STIX]{x1D735}p+\unicode[STIX]{x1D707}\triangle \boldsymbol{v}=0\quad \text{in }\mathbb{R}^{2}\setminus \unicode[STIX]{x1D6FE}, & \displaystyle\end{eqnarray}$$
 $$\begin{eqnarray}\displaystyle & \unicode[STIX]{x1D735}\boldsymbol{\cdot }\boldsymbol{v}=0\quad \text{in }\mathbb{R}^{2}\setminus \unicode[STIX]{x1D6FE}, & \displaystyle\end{eqnarray}$$
 $$\begin{eqnarray}\displaystyle & \boldsymbol{v}(\boldsymbol{x})\rightarrow \boldsymbol{v}_{\infty }(\boldsymbol{x})\quad \text{as }\Vert \boldsymbol{x}\Vert \rightarrow \infty . & \displaystyle\end{eqnarray}$$
 $\dot{\boldsymbol{x}}=\boldsymbol{v}$
on
 $\unicode[STIX]{x1D6FE}$
, where
 $\boldsymbol{x}$
is a material point on the membrane. Using the BIE formulation, we can now write the membrane evolution equation by combining the kinematic condition with the governing equation (2.1) as (Veerapaneni et al.
Reference Veerapaneni, Gueyffier, Zorin and Biros2009)

where
 $\boldsymbol{f}_{hd}$
is the hydrodynamic traction jump across the membrane and
 $G_{s}$
is the free-space Green function for the Stokes equations, given by
 $$\begin{eqnarray}G_{s}(\boldsymbol{x}-\boldsymbol{y})=\frac{1}{4\unicode[STIX]{x03C0}\unicode[STIX]{x1D707}}\left(-\!\log \Vert \boldsymbol{x}-\boldsymbol{y}\Vert \unicode[STIX]{x1D644}+\frac{(\boldsymbol{x}-\boldsymbol{y})\otimes (\boldsymbol{x}-\boldsymbol{y})}{\Vert \boldsymbol{x}-\boldsymbol{y}\Vert ^{2}}\right).\end{eqnarray}$$
Equation (2.2b ) expresses the local inextensibility constraint on the membrane.
For a given vesicle configuration,
 $\boldsymbol{f}_{hd}$
can be evaluated by performing a force balance at the membrane. The elastic forces acting on the membrane are comprised of the bending and the tension forces, defined respectively as
 $$\begin{eqnarray}\boldsymbol{f}_{b}=\unicode[STIX]{x1D705}_{B}\left(\unicode[STIX]{x1D705}_{ss}+\frac{\unicode[STIX]{x1D705}^{3}}{2}\right)\boldsymbol{n},\quad \boldsymbol{f}_{\unicode[STIX]{x1D706}}=(\unicode[STIX]{x1D706}\boldsymbol{x}_{s})_{s},\end{eqnarray}$$
where
 $\unicode[STIX]{x1D705}_{B}$
is the bending modulus,
 $\unicode[STIX]{x1D705}$
is the curvature,
 $s$
is the arclength parameter,
 $\boldsymbol{n}$
is the outward normal to
 $\unicode[STIX]{x1D6FE}$
and the tension
 $\unicode[STIX]{x1D706}$
acts as a Lagrange multiplier to enforce the inextensibility constraint. A force balance at the membrane yields
 $\boldsymbol{f}_{hd}=\boldsymbol{f}_{b}+\boldsymbol{f}_{\unicode[STIX]{x1D706}}-\boldsymbol{f}_{el}$
, where
 $\boldsymbol{f}_{el}$
is the electric force that is determined by solving for the electric potential.
In the leaky-dielectric model, the electric charges are assumed to be present only at the interface and not in the bulk. Let
 $\unicode[STIX]{x1D719}(\boldsymbol{x})$
be the electric potential at
 $\boldsymbol{x}$
, so that
 $\boldsymbol{E}=-\unicode[STIX]{x1D735}\unicode[STIX]{x1D719}$
. Assuming that the vesicle membrane is charge-free and has a conductivity
 $G_{m}$
and a capacitance
 $C_{m}$
, the boundary value problem for the electric potential can be summarized as (Schwalbe et al.
Reference Schwalbe, Vlahovska and Miksis2011)
 $$\begin{eqnarray}-\triangle \unicode[STIX]{x1D719}=0\quad \text{in }\mathbb{R}^{2}\setminus \unicode[STIX]{x1D6FE},\end{eqnarray}$$
 $$\begin{eqnarray}-\unicode[STIX]{x1D735}\unicode[STIX]{x1D719}(\boldsymbol{x})\rightarrow \boldsymbol{E}_{\infty }(\boldsymbol{x})\quad \text{as }\Vert \boldsymbol{x}\Vert \rightarrow \infty ,\quad \unicode[STIX]{x27E6}\boldsymbol{n}\boldsymbol{\cdot }(\unicode[STIX]{x1D70E}\unicode[STIX]{x1D735}\unicode[STIX]{x1D719})\unicode[STIX]{x27E7}_{\unicode[STIX]{x1D6FE}}=0,\quad \unicode[STIX]{x27E6}\unicode[STIX]{x1D719}\unicode[STIX]{x27E7}_{\unicode[STIX]{x1D6FE}}=V_{m},\end{eqnarray}$$
 $$\begin{eqnarray}C_{m}\dot{V}_{m}+G_{m}V_{m}=-\boldsymbol{n}\boldsymbol{\cdot }(\unicode[STIX]{x1D70E}_{i}\unicode[STIX]{x1D735}\unicode[STIX]{x1D719}_{i})\quad \text{on }\unicode[STIX]{x1D6FE}.\end{eqnarray}$$
Here,
 $\boldsymbol{E}_{\infty }$
is the imposed electric field,
 $\unicode[STIX]{x27E6}\cdot \unicode[STIX]{x27E7}_{\unicode[STIX]{x1D6FE}}$
denotes the jump across the interface (e.g.
 $\unicode[STIX]{x27E6}\unicode[STIX]{x1D70E}\unicode[STIX]{x27E7}_{\unicode[STIX]{x1D6FE}}=\unicode[STIX]{x1D70E}_{i}-\unicode[STIX]{x1D70E}_{e}$
) and
 $V_{m}$
is the transmembrane potential. The electric force on the membrane is then defined by
 $\boldsymbol{f}_{el}=\unicode[STIX]{x27E6}\boldsymbol{n}\boldsymbol{\cdot }\unicode[STIX]{x1D6F4}^{el}\unicode[STIX]{x27E7}_{\unicode[STIX]{x1D6FE}}$
, where the Maxwell stress tensor
 $\unicode[STIX]{x1D6F4}^{el}=\unicode[STIX]{x1D716}\boldsymbol{E}\otimes \boldsymbol{E}-(1/2)\unicode[STIX]{x1D716}\Vert \boldsymbol{E}\Vert ^{2}\unicode[STIX]{x1D644}$
. Therefore, we need to determine the electric field on both sides of the membrane by solving (2.5) to evaluate
 $\boldsymbol{f}_{el}$
.
Since we are only interested in interfacial variables and (2.5) is a linear partial differential equation, we can recast it as a BIE with the unknowns residing only on the interface. We will employ an indirect integral equation formulation to solve for the electric potential
 $\unicode[STIX]{x1D719}$
. Assume that the electric potential in the domain interior and exterior of the membrane is given by Veerapaneni (Reference Veerapaneni2016),

where the membrane charge density
 $q=\unicode[STIX]{x27E6}\unicode[STIX]{x2202}\unicode[STIX]{x1D719}/\unicode[STIX]{x2202}\boldsymbol{n}\unicode[STIX]{x27E7}_{\unicode[STIX]{x1D6FE}}$
, and the Laplace single and double layer integral operators are defined by
 $$\begin{eqnarray}{\mathcal{S}}[q](\boldsymbol{x})=\int _{\unicode[STIX]{x1D6FE}}G(\boldsymbol{x}-\boldsymbol{y})q(\boldsymbol{y})\,\text{d}\unicode[STIX]{x1D6FE}(\boldsymbol{y})\quad \text{and}\quad {\mathcal{D}}[V_{m}](\boldsymbol{x})=\int _{\unicode[STIX]{x1D6FE}}{\displaystyle \frac{\unicode[STIX]{x2202}G(\boldsymbol{x}-\boldsymbol{y})}{\unicode[STIX]{x2202}\boldsymbol{n}(\boldsymbol{y})}}V_{m}(\boldsymbol{y})\,\text{d}\unicode[STIX]{x1D6FE}(\boldsymbol{y}),\end{eqnarray}$$
respectively. Here
 $G(\cdot )$
is the Laplace fundamental solution in the free space.
Note that, by construction, equation (2.6) implies
 $\unicode[STIX]{x27E6}\unicode[STIX]{x1D719}\unicode[STIX]{x27E7}_{\unicode[STIX]{x1D6FE}}=V_{m}\,$
since the single layer potential is continuous across
 $\unicode[STIX]{x1D6FE}$
. Applying the current continuity condition and using the standard jump conditions for the Laplace layer potentials, we arrive at the second-kind integral equation for the unknown
 $q$
:

where
 $\unicode[STIX]{x1D702}=(\unicode[STIX]{x1D70E}_{i}-\unicode[STIX]{x1D70E}_{e})/(\unicode[STIX]{x1D70E}_{i}+\unicode[STIX]{x1D70E}_{e})$
, and
 ${\mathcal{S}}^{\prime }$
and
 ${\mathcal{D}}^{\prime }$
denote the normal derivatives of the single and double layer potentials, respectively. Furthermore, the interfacial conditions
 $\unicode[STIX]{x27E6}\unicode[STIX]{x2202}\unicode[STIX]{x1D719}/\unicode[STIX]{x2202}\boldsymbol{n}\unicode[STIX]{x27E7}_{\unicode[STIX]{x1D6FE}}=q$
and
 $\unicode[STIX]{x27E6}\unicode[STIX]{x1D70E}\unicode[STIX]{x2202}\unicode[STIX]{x1D719}/\unicode[STIX]{x2202}\boldsymbol{n}\unicode[STIX]{x27E7}_{\unicode[STIX]{x1D6FE}}=0$
imply that
 $-\boldsymbol{n}\boldsymbol{\cdot }(\unicode[STIX]{x1D70E}_{i}\unicode[STIX]{x1D735}\unicode[STIX]{x1D719}_{i})=(\unicode[STIX]{x1D70E}_{i}\unicode[STIX]{x1D70E}_{e}/(\unicode[STIX]{x1D70E}_{i}-\unicode[STIX]{x1D70E}_{e}))q$
. Substituting this result in (2.5e
) and using (2.8), we arrive at the following integro-differential equation for the evolution of
 $V_{m}$
:

The steps involved within a time-stepping procedure for the electric problem for a given vesicle shape can now be summarized as follows: update
 $V_{m}$
using (2.9), which also gives
 $q$
since the right-hand side of (2.9) is just
 $(\unicode[STIX]{x1D70E}_{i}\unicode[STIX]{x1D70E}_{e}/(\unicode[STIX]{x1D70E}_{i}-\unicode[STIX]{x1D70E}_{e}))q$
, then evaluate the membrane electric force
 $\boldsymbol{f}_{el}$
by computing
 $\boldsymbol{E}_{i}$
and
 $\boldsymbol{E}_{e}$
using (2.6).
Finally, the formulation generalizes to the two- (or multiple-) vesicle case in a trivial manner. Let
 $\unicode[STIX]{x1D6FE}$
now denote the union of the vesicle membranes, i.e.
 $\unicode[STIX]{x1D6FE}=\bigcup _{i=1}^{2}\unicode[STIX]{x1D6FE}_{i}$
, where
 $\unicode[STIX]{x1D6FE}_{i}$
is the boundary of the
 $i$
th vesicle. Then the definitions of the boundary integral operators introduced earlier hold unchanged; for example,
 $$\begin{eqnarray}{\mathcal{S}}[q](\boldsymbol{x})=\int _{\unicode[STIX]{x1D6FE}}G(\boldsymbol{x}-\boldsymbol{y})q(\boldsymbol{y})\,\text{d}\unicode[STIX]{x1D6FE}(\boldsymbol{y}):=\mathop{\sum }_{j=1}^{2}\int _{\unicode[STIX]{x1D6FE}_{j}}G(\boldsymbol{x}-\boldsymbol{y})q(\boldsymbol{y})\,\text{d}\unicode[STIX]{x1D6FE}_{j}(\boldsymbol{y}).\end{eqnarray}$$
2.2 Numerical method
We now describe a numerical scheme to solve the coupled integro-differential equations for the evolution of vesicle position (2.2) and its transmembrane potential (2.9). It directly follows from ideas introduced in Veerapaneni et al. (Reference Veerapaneni, Gueyffier, Zorin and Biros2009), Barnett et al. (Reference Barnett, Wu and Veerapaneni2015) and Veerapaneni (Reference Veerapaneni2016). Each vesicle boundary is parameterized by a Lagrangian variable
 $\unicode[STIX]{x1D6FC}\in [0,2\unicode[STIX]{x03C0}]$
and a uniform discretization in
 $\unicode[STIX]{x1D6FC}$
is employed. Derivatives of functions defined on the boundary are then computed using spectral differentiation in the Fourier domain, accelerated by the fast Fourier transform.
2.2.1 Evaluating boundary integrals
We use the standard periodic trapezoidal rule for computing boundary integrals that are smooth (e.g. the double-layer potential defined in (2.7)), which yields spectral accuracy. On the other hand, we discretize the weakly singular operators such as the single-layer potential defined in (2.7) using a spectrally accurate Nyström method (with periodic Kress corrections for the log singularity (Kress Reference Kress1999, § 12.3)). The same method is also applied for computing the Stokes single-layer potential (2.2).
The operator
 ${\mathcal{D}}^{\prime }[\cdot ]$
requires special attention as its kernel is hyper-singular. We employ the following standard transformation (Hsiao & Wendland Reference Hsiao and Wendland2008) to turn it into a weakly singular integral:
 $$\begin{eqnarray}{\mathcal{D}}^{\prime }[V_{m}](\boldsymbol{x})=\frac{\unicode[STIX]{x2202}}{\unicode[STIX]{x2202}\boldsymbol{n}(\boldsymbol{x})}\int _{\unicode[STIX]{x1D6FE}}\frac{\unicode[STIX]{x2202}G(\boldsymbol{x}-\boldsymbol{y})}{\unicode[STIX]{x2202}\boldsymbol{n}(\boldsymbol{y})}V_{m}(\boldsymbol{y})\,\text{d}\unicode[STIX]{x1D6FE}=\frac{\unicode[STIX]{x2202}}{\unicode[STIX]{x2202}s(\boldsymbol{x})}\left(\int _{\unicode[STIX]{x1D6FE}}G(\boldsymbol{x}-\boldsymbol{y})\frac{\unicode[STIX]{x2202}V_{m}(\boldsymbol{y})}{\unicode[STIX]{x2202}s(\boldsymbol{y})}\,\text{d}\unicode[STIX]{x1D6FE}\right)\quad \forall \boldsymbol{x}\in \unicode[STIX]{x1D6FE}.\end{eqnarray}$$
The surface gradients,
 $\unicode[STIX]{x2202}/\unicode[STIX]{x2202}s(\boldsymbol{x})$
and
 $\unicode[STIX]{x2202}/\unicode[STIX]{x2202}s(\boldsymbol{y})$
, are computed via spectral differentiation.
Lastly, when the vesicles are located arbitrarily close to each other, the boundary integrals evaluating the interaction forces become nearly singular. For example, consider the integral
 $$\begin{eqnarray}\int _{\unicode[STIX]{x1D6FE}_{1}}G(\boldsymbol{x}-\boldsymbol{y})q(\boldsymbol{y})\,\text{d}\unicode[STIX]{x1D6FE}_{1}(\boldsymbol{y}),\quad \text{where }\boldsymbol{x}\in \unicode[STIX]{x1D6FE}_{2}.\end{eqnarray}$$
The periodic trapezoidal rule loses its uniform spectral convergence in evaluating this integral as
 $\boldsymbol{x}$
approaches
 $\unicode[STIX]{x1D6FE}_{1}$
; moreover, the singular quadrature rule is also ineffective for this integral. These inaccuracies, in turn, may lead to numerical instabilities and breakdown of the simulation. To remedy this problem, we employ the recently developed close evaluation scheme of Barnett et al. (Reference Barnett, Wu and Veerapaneni2015) whenever vesicles are located closer than a cut-off distance (which is heuristically chosen to be five times the minimum spacing between the nodes, the so-called ‘
 $5h$
rule’). This scheme achieves spectral accuracy in evaluating (2.11), regardless of the distance of
 $\boldsymbol{x}$
from
 $\unicode[STIX]{x1D6FE}_{1}$
. We use this scheme to accurately evaluate the Stokes layer potential in (2.2) as well.
2.2.2 Time-stepping scheme
The numerical stiffness associated with the bending force on the vesicle membranes is overcome by using the semi-implicit scheme proposed in Veerapaneni et al. (Reference Veerapaneni, Gueyffier, Zorin and Biros2009) to discretize (2.2) in time. Following McConnell et al. (Reference McConnell, Miksis and Vlahovska2013) and Veerapaneni (Reference Veerapaneni2016), we treat the electric force on the membrane explicitly, thereby decoupling the evolution equations (2.2) and (2.9). Then we use a semi-implicit scheme to evolve the transmembrane potential independently, which we describe next.
Let
 $\unicode[STIX]{x0394}t$
be the time-step size, and let
 $V_{m}^{n}(\boldsymbol{x})$
be the transmembrane potential at time
 $n\unicode[STIX]{x0394}t$
at a point
 $\boldsymbol{x}$
on the membrane. Our semi-implicit time-stepping scheme for (2.9) is given by
 $$\begin{eqnarray}C_{m}{\displaystyle \frac{V_{m}^{n+1}-V_{m}^{n}}{\unicode[STIX]{x0394}t}}+G_{m}V_{m}^{n+1}={\displaystyle \frac{\unicode[STIX]{x1D70E}_{i}\unicode[STIX]{x1D70E}_{e}}{\unicode[STIX]{x1D70E}_{i}+\unicode[STIX]{x1D70E}_{e}}}\left({\displaystyle \frac{1}{2}}+\unicode[STIX]{x1D702}{\mathcal{S}}^{\prime }\right)^{-1}(\boldsymbol{E}_{\infty }\boldsymbol{\cdot }\boldsymbol{n}+{\mathcal{D}}^{\prime }V_{m}^{n+1}),\end{eqnarray}$$
where the boundary integral operators are treated explicitly, i.e. evaluated using the boundary position at
 $n\unicode[STIX]{x0394}t$
. This linear system for the unknown
 $V_{m}^{n+1}$
is solved using an iterative method (GMRES).
3 Results and discussions
We now turn to analysing the simulation results obtained using the numerical method outlined above. We first compare our results on single vesicle EHD with those obtained in prior studies and present some new insights on dynamics and rheology of dilute suspensions, followed by analysis of pairwise dynamics. Let
 $A$
and
 $L$
denote the area and perimeter of the vesicle, respectively. Setting the characteristic length scale as
 $a=L/2\unicode[STIX]{x03C0}$
, we characterize our results on the following six non-dimensional parameters:
 $$\begin{eqnarray}\displaystyle & & \displaystyle \text{reduced volume:}\quad \unicode[STIX]{x1D6E5}=4\unicode[STIX]{x03C0}A/L^{2},\nonumber\\ \displaystyle & & \displaystyle \text{conductivity ratio:}\quad \unicode[STIX]{x1D6EC}=\unicode[STIX]{x1D70E}_{i}/\unicode[STIX]{x1D70E}_{e},\nonumber\\ \displaystyle & & \displaystyle \text{membrane conductivity:}\quad G=aG_{m}/\unicode[STIX]{x1D70E}_{e},\nonumber\\ \displaystyle & & \displaystyle \text{electric field strength:}\quad \unicode[STIX]{x1D6FD}=\unicode[STIX]{x1D716}|\boldsymbol{E}_{\infty }|^{2}aC_{m}/\unicode[STIX]{x1D707}\unicode[STIX]{x1D70E}_{e},\nonumber\\ \displaystyle & & \displaystyle \text{capillary number:}\quad Ca=\unicode[STIX]{x1D707}\dot{\unicode[STIX]{x1D6FE}}a^{3}/\unicode[STIX]{x1D705}_{B},\nonumber\\ \displaystyle & & \displaystyle \text{bending rigidity:}\quad \unicode[STIX]{x1D712}=C_{m}\unicode[STIX]{x1D705}_{B}/\unicode[STIX]{x1D70E}_{e}\unicode[STIX]{x1D707}a^{2},\nonumber\end{eqnarray}$$
where
 $\dot{\unicode[STIX]{x1D6FE}}$
is the shear rate, e.g. for imposed linear shear flow, we have
 $\boldsymbol{v}_{\infty }(\boldsymbol{x})=(\dot{\unicode[STIX]{x1D6FE}}x_{2},0)$
. In all the simulations, the time is non-dimensionalized by the bending relaxation time scale
 $t_{\unicode[STIX]{x1D705}_{B}}=\unicode[STIX]{x1D707}a^{3}/\unicode[STIX]{x1D705}_{B}$
and the bending rigidity
 $\unicode[STIX]{x1D712}\approx 0.08$
.
3.1 Isolated vesicle EHD: transition from squaring to budding in POP
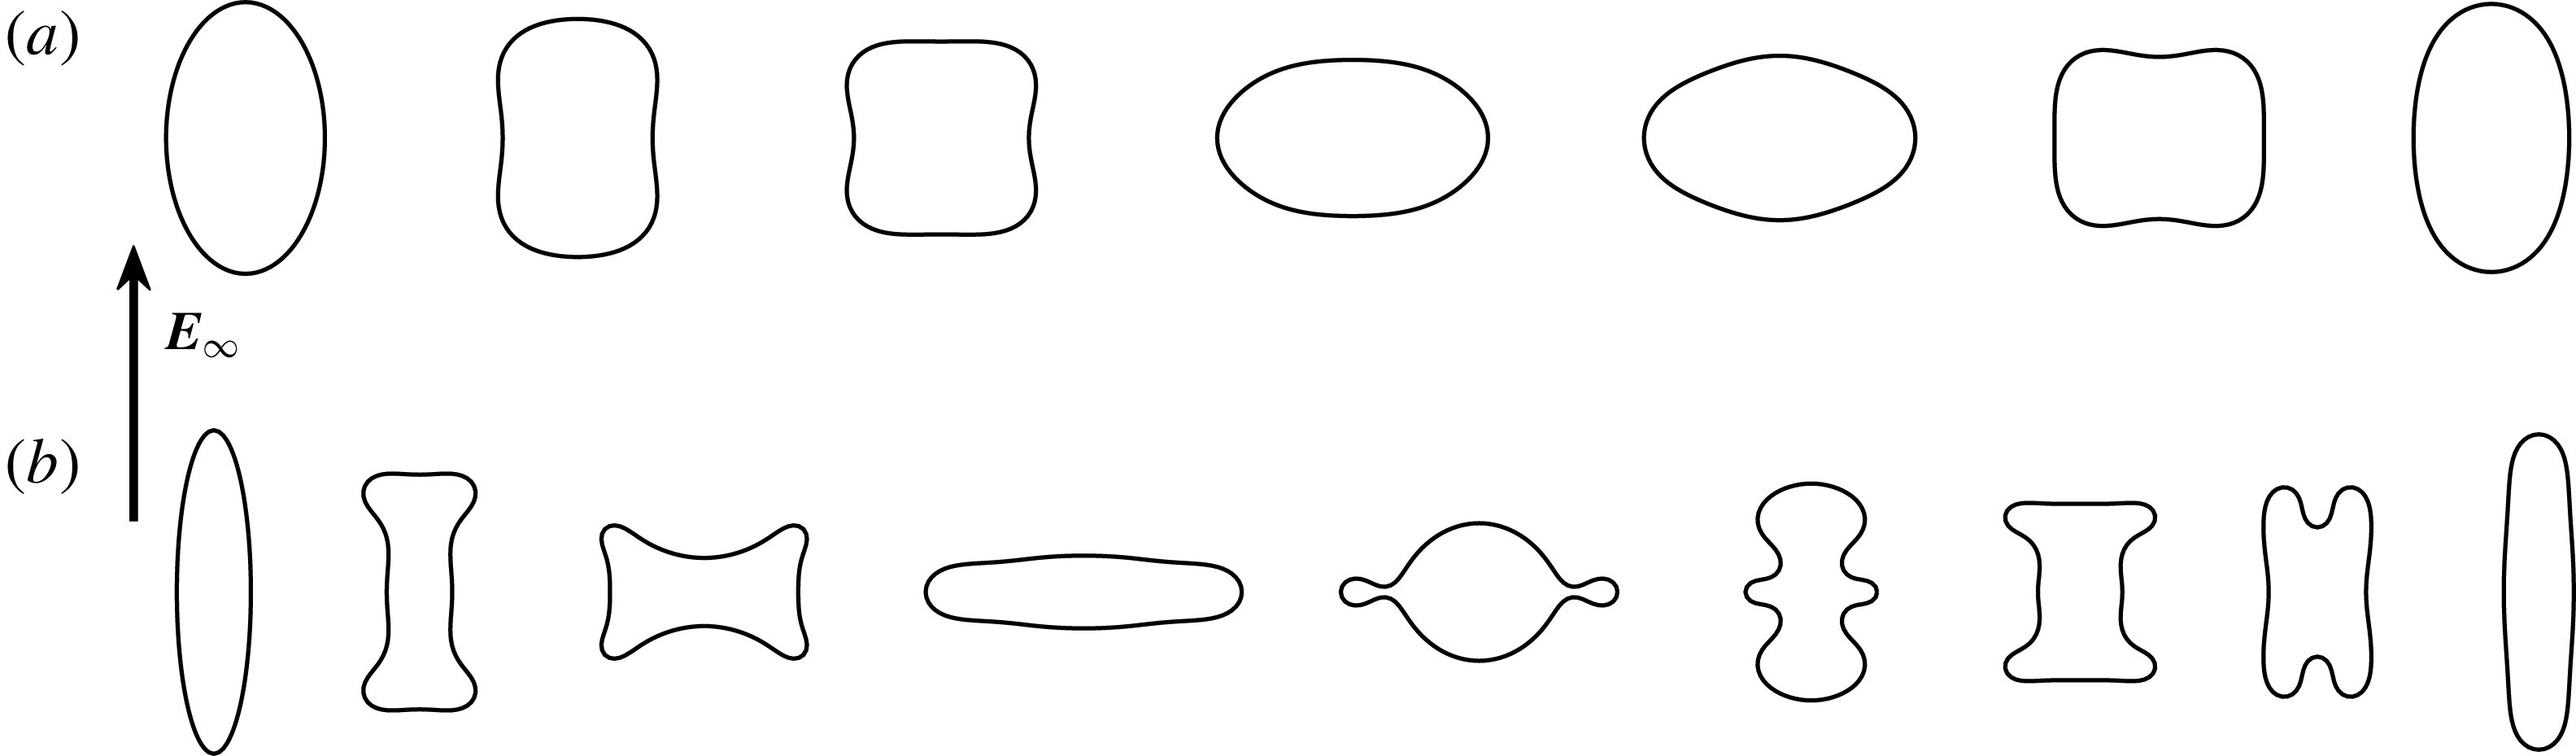
When an arbitrarily shaped vesicle is subjected to uniform electric field, it is known to transform into either a prolate shape or an oblate shape at equilibrium (Riske & Dimova Reference Riske and Dimova2005; Sadik et al. Reference Sadik, Li, Shan, Shreiber and Lin2011). Since ours is a 2-D construct, we refer to ellipses whose major axis aligns with the electric field direction as ‘prolates’; similarly, those whose minor axis aligns as ‘oblates’. A classical observation in vesicle EHD studies is the prolate–oblate–prolate (POP) transition that arises in certain parameter regimes. Figure 1(a) illustrates the POP transition simulated using our numerical method.
Snapshots from two different simulations of a single vesicle subjected to an external electric field, with
 $\unicode[STIX]{x1D6EC}=0.1$
,
 $G=0$
,
 $Ca=0$
and (a)
 $\unicode[STIX]{x1D6E5}=0.9$
,
 $\unicode[STIX]{x1D6FD}=3.2$
and (b)
 $\unicode[STIX]{x1D6E5}=0.5$
,
 $\unicode[STIX]{x1D6FD}=12.8$
. While the vesicle undergoes a prolate–oblate–prolate transition, the transient ‘square-like’ shapes observed here (in (a)) and in prior numerical studies cannot be observed when the reduced volume is lowered. Instead, to sustain the electric compression forces, the vesicle forms buds as it undergoes the POP transition (more details on this phase are shown in figure 2).

Three conditions are generally required for a vesicle to undergo POP transition: (i)
 $G$
is very small so that the vesicle membrane acts more like a capacitor than a conductor; (ii)
 $\unicode[STIX]{x1D6EC}$
is less than one; and (iii)
 $\unicode[STIX]{x1D6FD}$
is strong enough. Since
 $\unicode[STIX]{x1D6EC}<1$
, charges accumulate faster on the membrane exterior initially, and thus the vesicle appears to be negatively charged at the top and positively charged at the bottom, leading to a compressional force from the applied electric field, and the vesicle transitions from a prolate to an oblate shape. At longer times, once the membrane, acting as a capacitor, is fully charged, the apparent charge becomes zero and the vesicle transforms back into a prolate shape, which minimizes the electrostatic energy (McConnell, Vlahovska & Miksis Reference McConnell, Vlahovska and Miksis2015).
A notable feature of the POP transition is the squaring effect – a transient shape of the vesicle with four smoothed corners (as can be observed in figure 1
a) – which attracted attention of researchers due to its implications for electroporation. Since the reduced volume of a square is around 0.785, a question naturally arises: what transient shapes would a vesicle with much lower reduced volume assume? In figure 1(b), we illustrate the POP transition of a vesicle with
 $\unicode[STIX]{x1D6E5}=0.5$
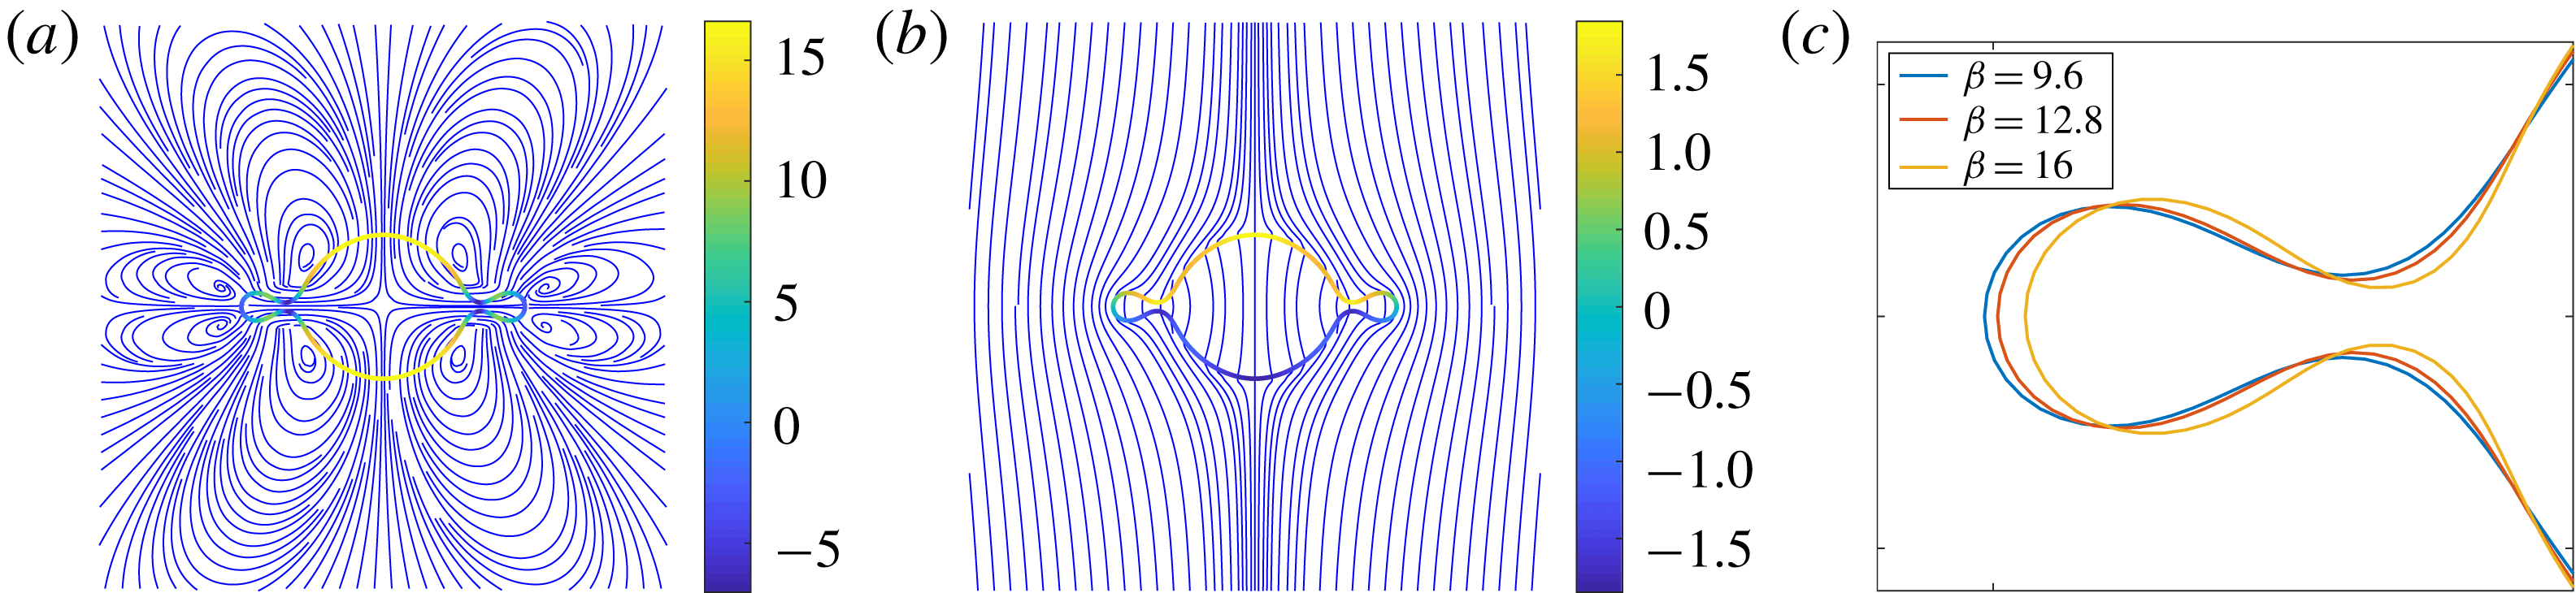
. Since the fluid incompressibility acts to preserve its enclosed area, the vesicle forms small protrusions or ‘buds’ to sustain the electrical compression forces. Figure 2 shows more details of this bud formation phase. The tension becomes negative, as expected, in the neck region of the buds. These intermediary shapes are reminiscent of those obtained by growing microtubules within the vesicles (Fygenson, Marko & Libchaber Reference Fygenson, Marko and Libchaber1997); the notable feature here, however, is that only body forces are applied as opposed to local microtubule-membrane forces.
Streamlines (a) and electric field lines (b) plotted at the moment when the vesicle with
 $\unicode[STIX]{x1D6E5}=0.5$
shown in figure 1(b) forms buds while undergoing POP transition. In (a) the membrane colour indicates the magnitude of tension, while in (b) it indicates the magnitude of the transmembrane potential. (c) A closer look at the narrowest buds formed under different values of
 $\unicode[STIX]{x1D6FD}$
, where the times corresponding to this state for
 $\unicode[STIX]{x1D6FD}=9.6$
, 12.8 and 16 are
 $t=0.253$
, 0.216 and 0.184, respectively. The neck of the buds becomes narrower as
 $\unicode[STIX]{x1D6FD}$
increases.

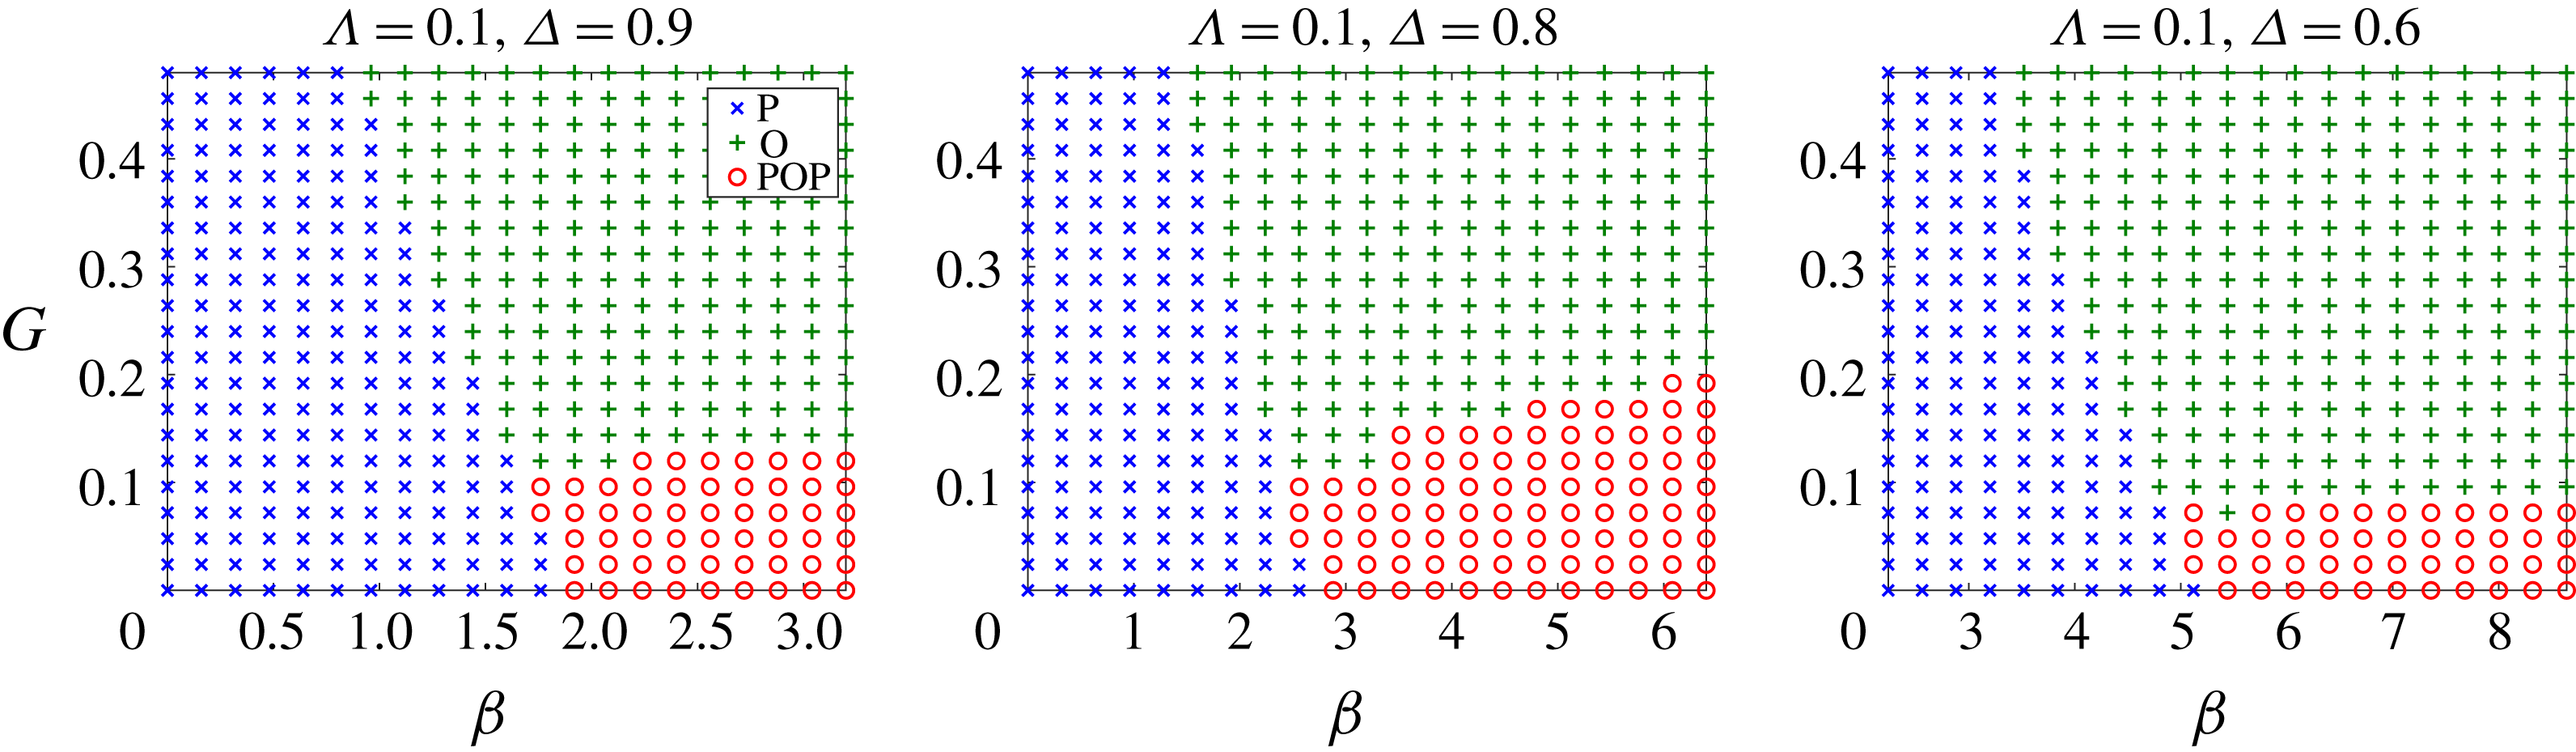
Phase diagrams of vesicle dynamics for different reduced volumes as a function of the membrane conductivity
 $G$
and electric field strength
 $\unicode[STIX]{x1D6FD}$
. Here, the different phases of the dynamics are indicated by
 $O$
when the vesicle remains oblate for all times,
 $P$
when it remains prolate or POP when it transitions from prolate to oblate to prolate shapes. For all the cases, the conductivity ratio
 $\unicode[STIX]{x1D6EC}$
is set to 0.1,
 $Ca=0$
.

We further characterize the POP mechanism in figure 3 for different reduced volumes. In all cases, we observe that there exists some critical field strength
 $\unicode[STIX]{x1D6FD}_{0}$
for POP transition to happen (e.g. from the figure, for
 $G=0$
,
 $\unicode[STIX]{x1D6FD}_{0}\approx \{1.9,2.6,5.1\}$
corresponding to
 $\unicode[STIX]{x1D6E5}=\{0.9,0.8,0.6\}$
, respectively). On the other hand, when the field strength is weak the vesicle remains a prolate, and when the membrane conductivity is high it transitions to an equilibrium oblate shape. These results are in qualitative agreement with McConnell et al. (Reference McConnell, Vlahovska and Miksis2015), where similar phase diagrams were presented but only for higher reduced volume vesicles. Thus the phase diagrams in figure 3 show that the POP mechanism works consistently for different
 $\unicode[STIX]{x1D6E5}$
.
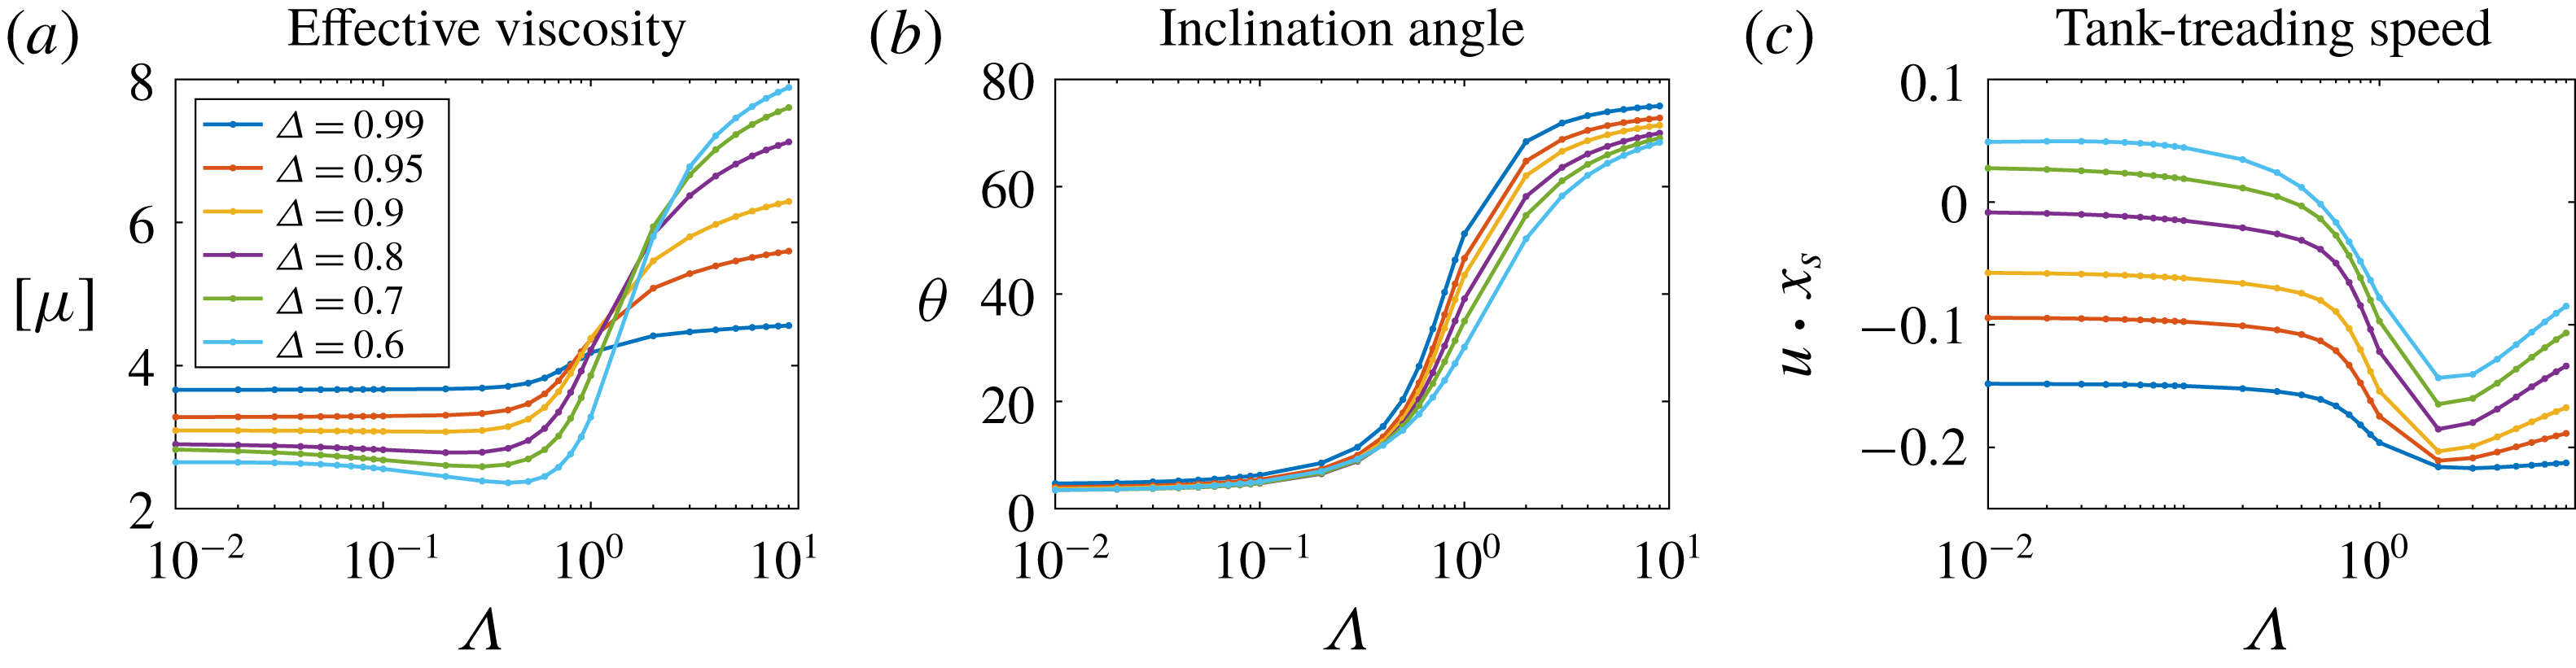
Single vesicle rheology when
 $G=4$
,
 $\unicode[STIX]{x1D6FD}=6.4$
and
 $Ca=10$
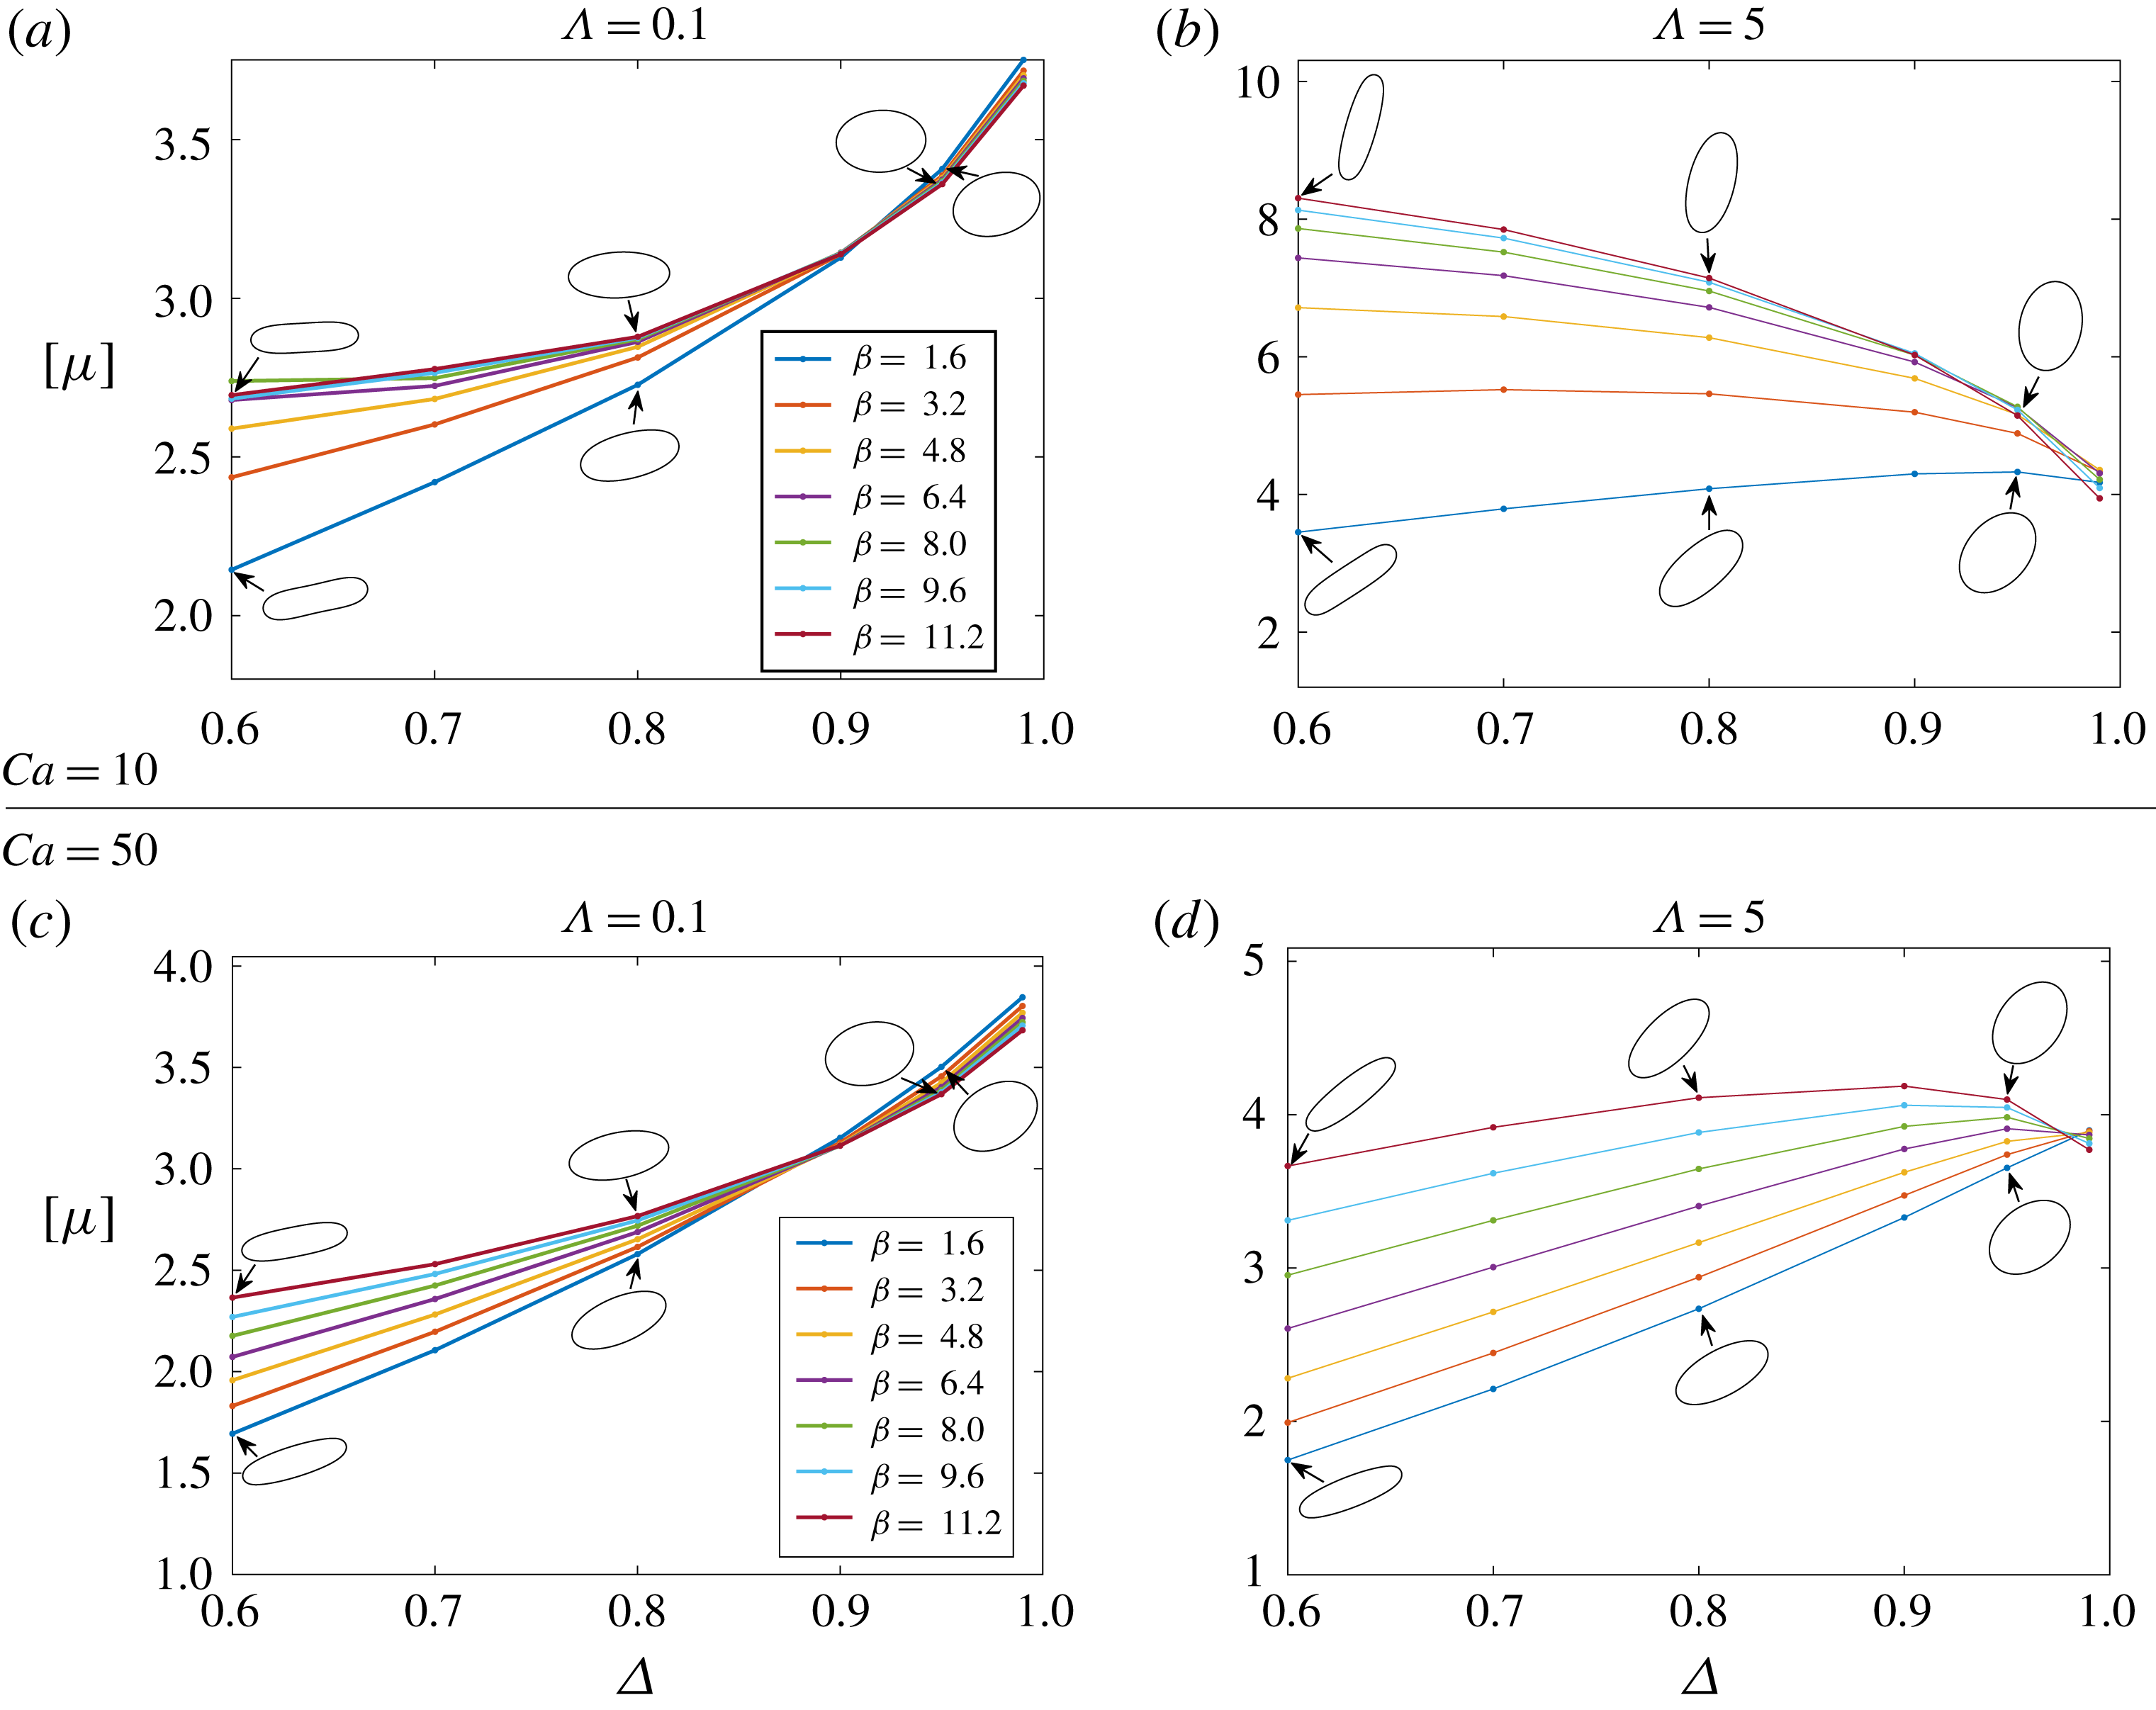
. Plots of the effective viscosity (a), angle of inclination (b) and the tangential velocity (c) when a vesicle is suspended in a linear shear flow as a function of the conductivity ratio. We can observe that the inclination angle increases as
 $\unicode[STIX]{x1D6EC}$
is increased, i.e. the vesicle tries to align with the electric field direction and away from the direction of shear. It thereby presents more resistance to imposed flow, leading to higher effective viscosity. One remarkable effect of low reduced volume, as is evident from panel (c), is that the vesicle tank-treads in the opposite direction compared to high reduced volume vesicles when
 $\unicode[STIX]{x1D6EC}$
is small.

Dependence of effective viscosity
 $[\unicode[STIX]{x1D707}]$
on
 $\unicode[STIX]{x1D6FD}$
and
 $\unicode[STIX]{x1D6E5}$
. Conductivity
 $G=4$
and
 $Ca=10$
(a,b) or
 $Ca=50$
(c,d). We note that (i)
 $[\unicode[STIX]{x1D707}]$
is higher whenever the equilibrium angle at which the vesicle tank-treads is away from the direction of shear, and (ii) when
 $\unicode[STIX]{x1D6E5}$
is close to 1 (vesicle closer to a circle),
 $[\unicode[STIX]{x1D707}]$
is nearly
 $\unicode[STIX]{x1D6FD}$
-independent and shear-independent (as can be expected).

Finally, when
 $\unicode[STIX]{x1D6EC}>1$
, the EHD forces act to extend the vesicle and it remains a prolate throughout the simulation.
3.2 Electrorheology in the dilute limit
We next look at the combined effect of an imposed shear flow and a DC electric field on a single vesicle. In the presence of both fields, the dynamics is characterized by a competition between the electrical and hydrodynamical shear stresses and the migration of electric charges along the vesicle membrane.
Figure 4 shows the rheological properties of a vesicle subjected to an applied linear shear and an applied uniform electric field. In this case, where the membrane has non-zero
 $G$
, we observe that the vesicles with different reduced volumes all stabilize into a tank-treading motion and that the tank-treading speed and angle of inclination are affected nonlinearly by the conductivity ratio
 $\unicode[STIX]{x1D6EC}$
. Note that as
 $\unicode[STIX]{x1D6EC}$
is increased, the vesicle tries to align with the electric field direction and away from the direction of shear, presenting higher resistance to the imposed flow and hence leading to higher effective viscosity. Here, the effective viscosity
 $[\unicode[STIX]{x1D707}]$
is computed using the usual formula (Rahimian, Veerapaneni & Biros Reference Rahimian, Veerapaneni and Biros2010):
 $$\begin{eqnarray}[\unicode[STIX]{x1D707}]:={\displaystyle \frac{1}{\dot{\unicode[STIX]{x1D6FE}}\unicode[STIX]{x1D707}(T_{e}-T_{i})}}\int _{T_{i}}^{T_{e}}\langle \unicode[STIX]{x1D70E}_{12}^{p}\rangle \,\text{d}t,\quad \text{where }\langle \unicode[STIX]{x1D70E}^{p}\rangle ={\displaystyle \frac{1}{A}}\int _{\unicode[STIX]{x1D6FE}}(\boldsymbol{f}_{b}+\boldsymbol{f}_{\unicode[STIX]{x1D706}}-\boldsymbol{f}_{el})\otimes \boldsymbol{x}\,\text{d}s.\end{eqnarray}$$
Here
 $A$
is the area of the vesicle and
 $\unicode[STIX]{x1D70E}^{p}$
represents the perturbation in the stress due to membrane forces. After the vesicle reaches a steady state, the effective viscosity is measured over an arbitrary time interval
 $[T_{i},T_{e}]$
.
We further characterize the rheology in figure 5 by plotting the effective viscosity as
 $\unicode[STIX]{x1D6E5}$
is varied. Highly deflated vesicles prominently display shear-rate and
 $\unicode[STIX]{x1D6FD}$
-dependent rheology since their shapes at equilibrium tank-treading dynamics are different, thereby presenting varied resistance to applied shear.
When
 $G$
is set to zero, the rheological behaviour becomes much more complex, primarily because of the tendency of vesicles to undergo a POP transition while at the same time tank-treading due to the applied shear. For different values of
 $\unicode[STIX]{x1D6EC}$
and
 $\unicode[STIX]{x1D6E5}$
, we observed various behaviours such as tumbling, staggering (tank-treading with periodically varying inclination angles), ‘mirrored’ tank-treading (tank-treading in the opposite direction and with inclination against the applied shear direction), and even chaotic staggering. A detailed analysis and characterization of these dynamics are currently under way and will be reported at a later date.
3.3 Two-body EHD interactions
Next we present results from simulation of two-body vesicle interactions in an applied electric field and in the absence of imposed flow. As before, we assume that the viscosity and permittivity of the interior and exterior fluids are the same. We set the initial shape of both the vesicles to be identical and their initial location not symmetric with respect to the electric field direction. (When they are aligned along
 $\boldsymbol{E}_{\infty }$
they simply attract each other (after transient shape changes), and when aligned in the perpendicular direction they simply repel each other. Both results are consequences of one vesicle appearing to the other as a dipole with the same orientation.) We apply a DC electric field, pointing upwards, strong enough to cause the POP transition when
 $\unicode[STIX]{x1D6EC}=0.1$
(i.e.
 $\unicode[STIX]{x1D6FD}>\unicode[STIX]{x1D6FD}_{0}$
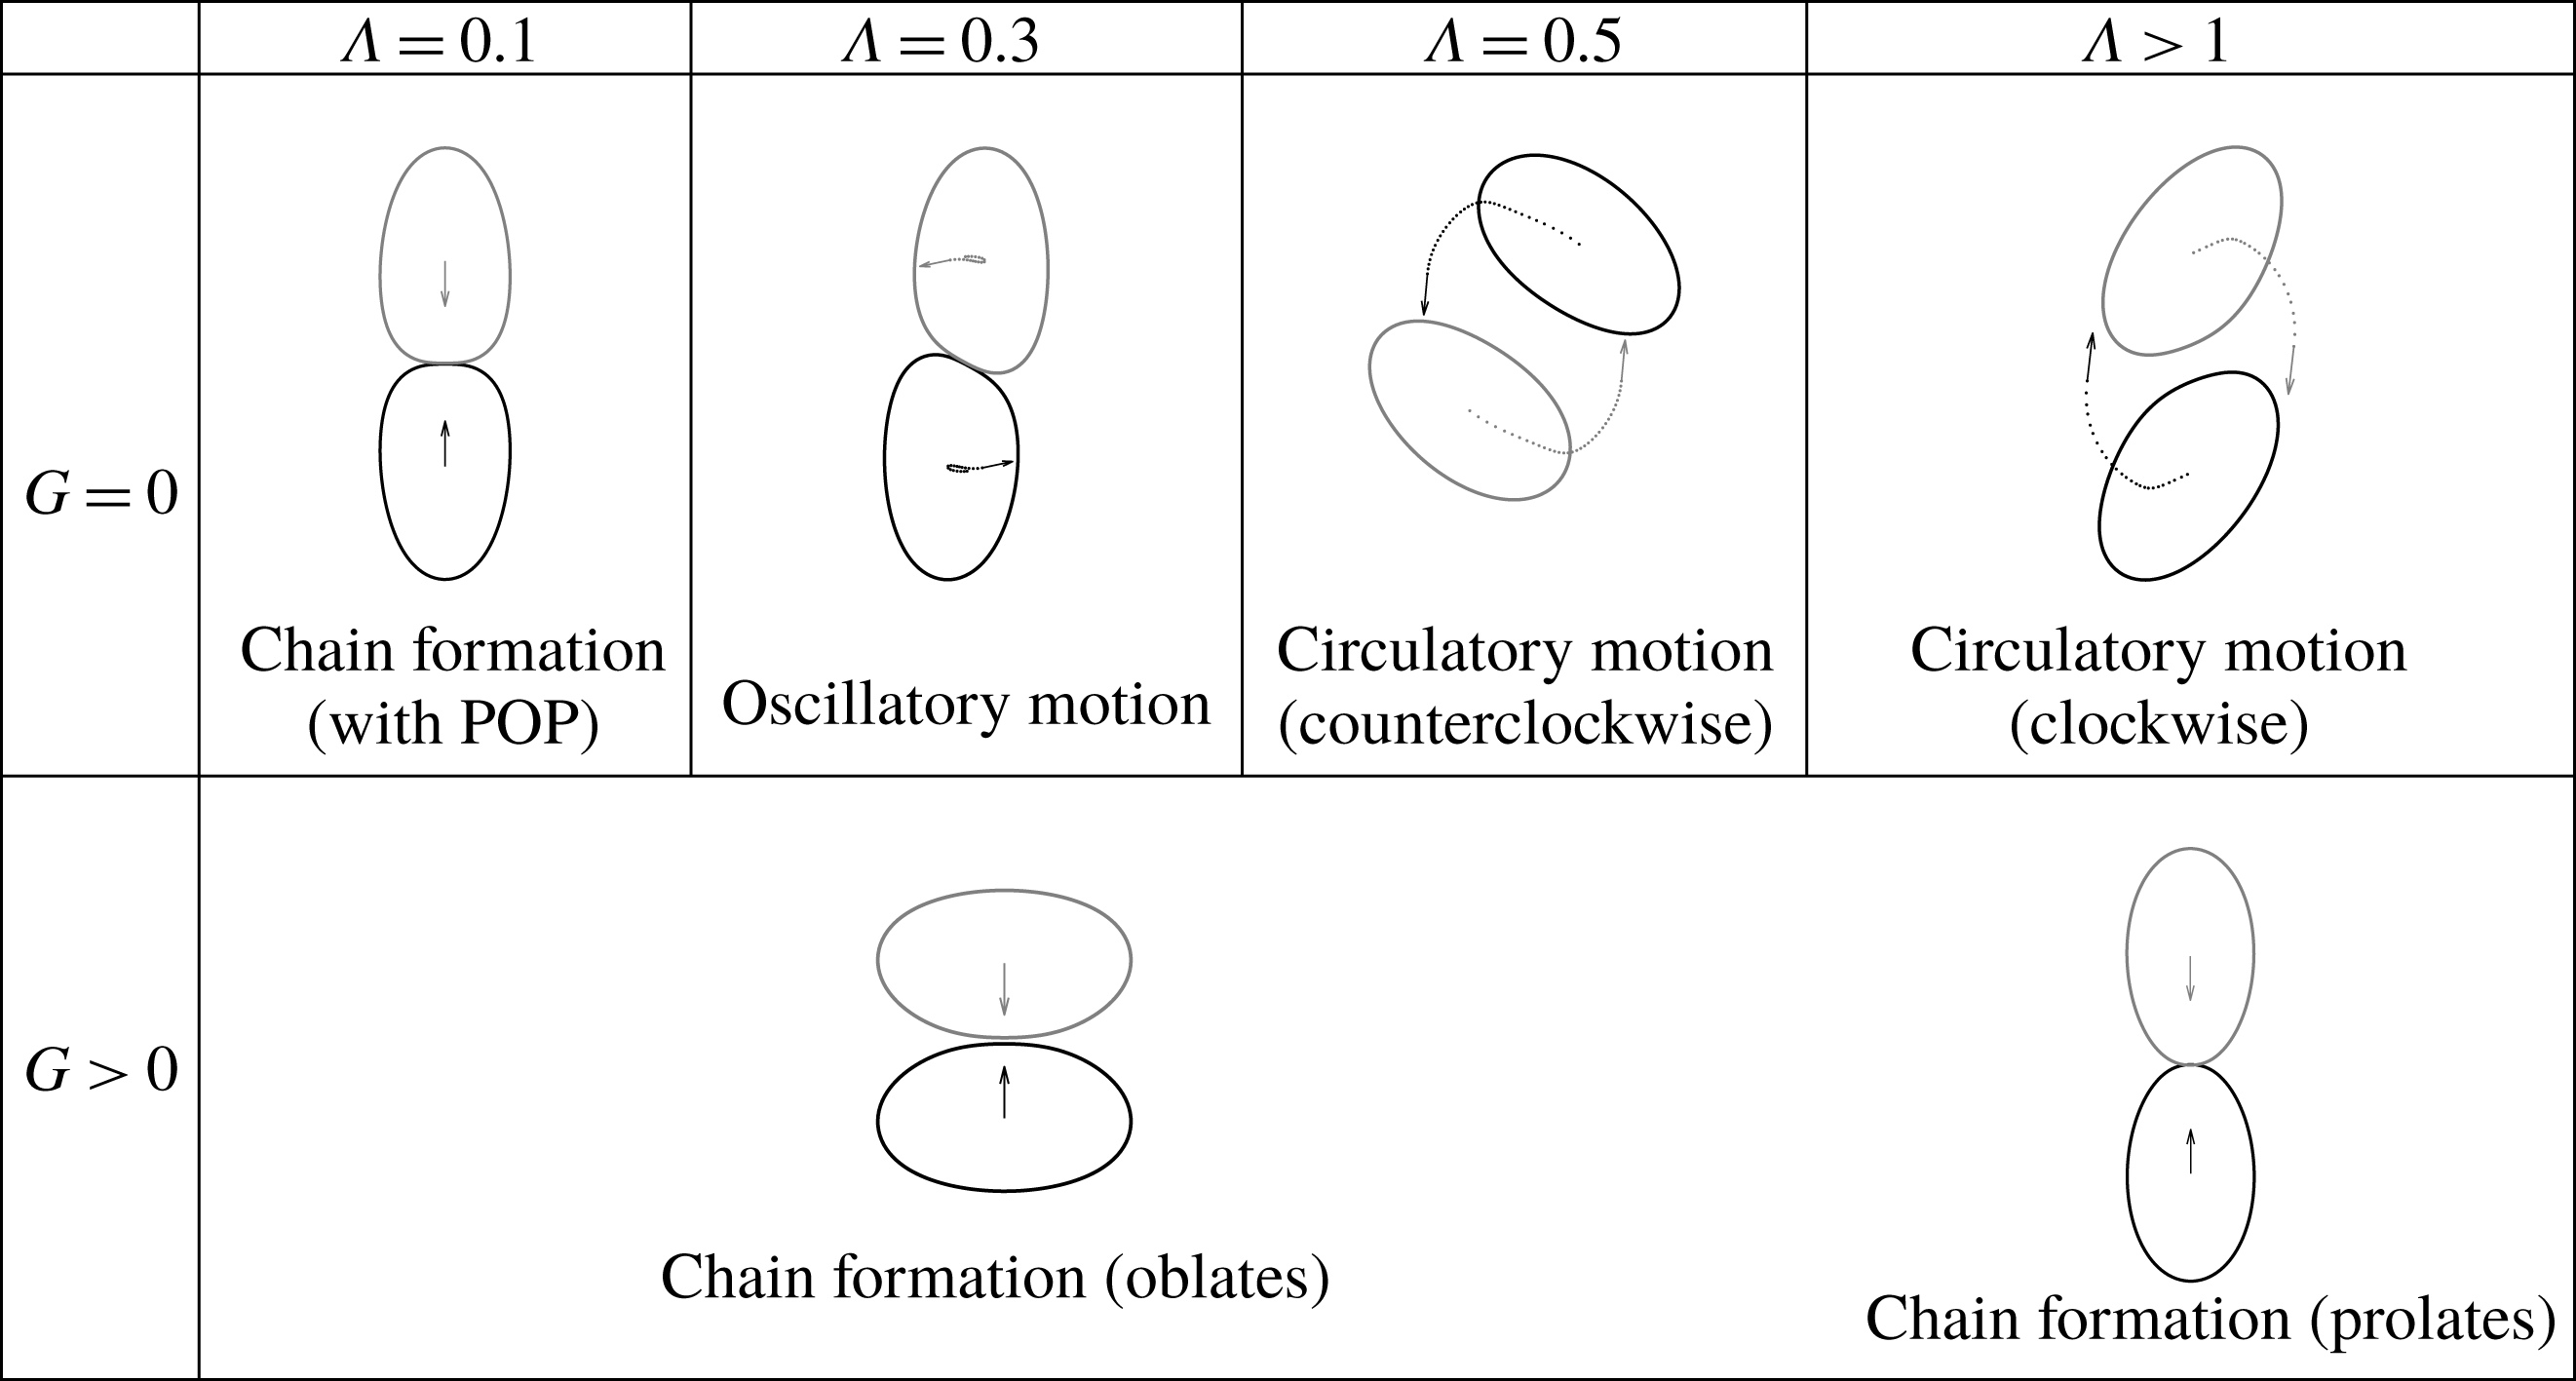
). Under these conditions, the different representative classes of dynamics observed are summarized in figure 6.
The complex nature of these pairwise interactions can be understood from three predominant, competing mechanisms: (i) the electrically driven vesicle alignment due to one vesicle appearing as a dipole (to leading order) in the far-field electrical disturbance produced by the second vesicle (the two vesicles always tend to form a chain along the direction of dipole orientation); (ii) the EHD flow induced by the tangential electrical stresses at the fluid-vesicle interfaces, driving the vesicles to rotate about each other; (iii) the prolate–oblate deformation mentioned in § 3.1, generating extensional flows around each vesicle.
A summary of pairwise vesicle EHD interactions (
 $\unicode[STIX]{x1D6E5}=0.9$
,
 $\unicode[STIX]{x1D6FD}=3.2$
,
 $Ca=0$
).

First, let us consider the case of
 $G=0$
, i.e. the vesicle membranes are impermeable to charges. Three different types of dynamics can be observed from figure 6. The first is chain formation, observed when
 $\unicode[STIX]{x1D6EC}$
is small enough, wherein pronounced deformation, due to mechanism (iii), induces flows that dominate the circulatory flow of mechanism (ii). Thereby, it completely halts the tank-treading motion. At the end of their POP cycle, both vesicles become almost vertically aligned. Then, mechanism (i) slowly drives them to form a stable chain. From our numerical experiments, we noticed that the thin layer of fluid between the vesicles gets continuously drained, albeit at a very slow pace (the distance between them decays exponentially with time).
The second type is a circulatory motion, observed when
 $\unicode[STIX]{x1D6EC}$
is large enough, wherein mechanism (iii) becomes negligible. As the two vesicles move to form a chain, mechanism (ii) causes both of them to tank-tread. Consequently, the induced disturbance flow on each vesicle becomes dominant and they start to rotate about each other. The tank-treading motion also causes the vesicles to appear as tilted dipoles, so they tend to form a tilted chain. The circulatory motion is periodically reinforced by the tilted-chain-formation process. The direction of rotation depends on the net torque on each vesicle, which has opposite orientations for
 $\unicode[STIX]{x1D6EC}>1$
and
 $\unicode[STIX]{x1D6EC}\leqslant 1$
. A sample simulation displaying this dynamics is shown in figure 7.
Snapshots from a simulation of two vesicles undergoing circulatory motion described in figure 6 with
 $G=0$
and
 $\unicode[STIX]{x1D6EC}=0.5$
. Here, one of the vesicles is coloured by the magnitude of
 $V_{m}$
(yellow indicates positive and blue indicates negative values, respectively). We can observe that each vesicle undergoes tank-treading motion on its own (as indicated by the streamlines), they rotate about each other and the vesicles viewed as dipoles are always tilted with respect to the applied field direction.

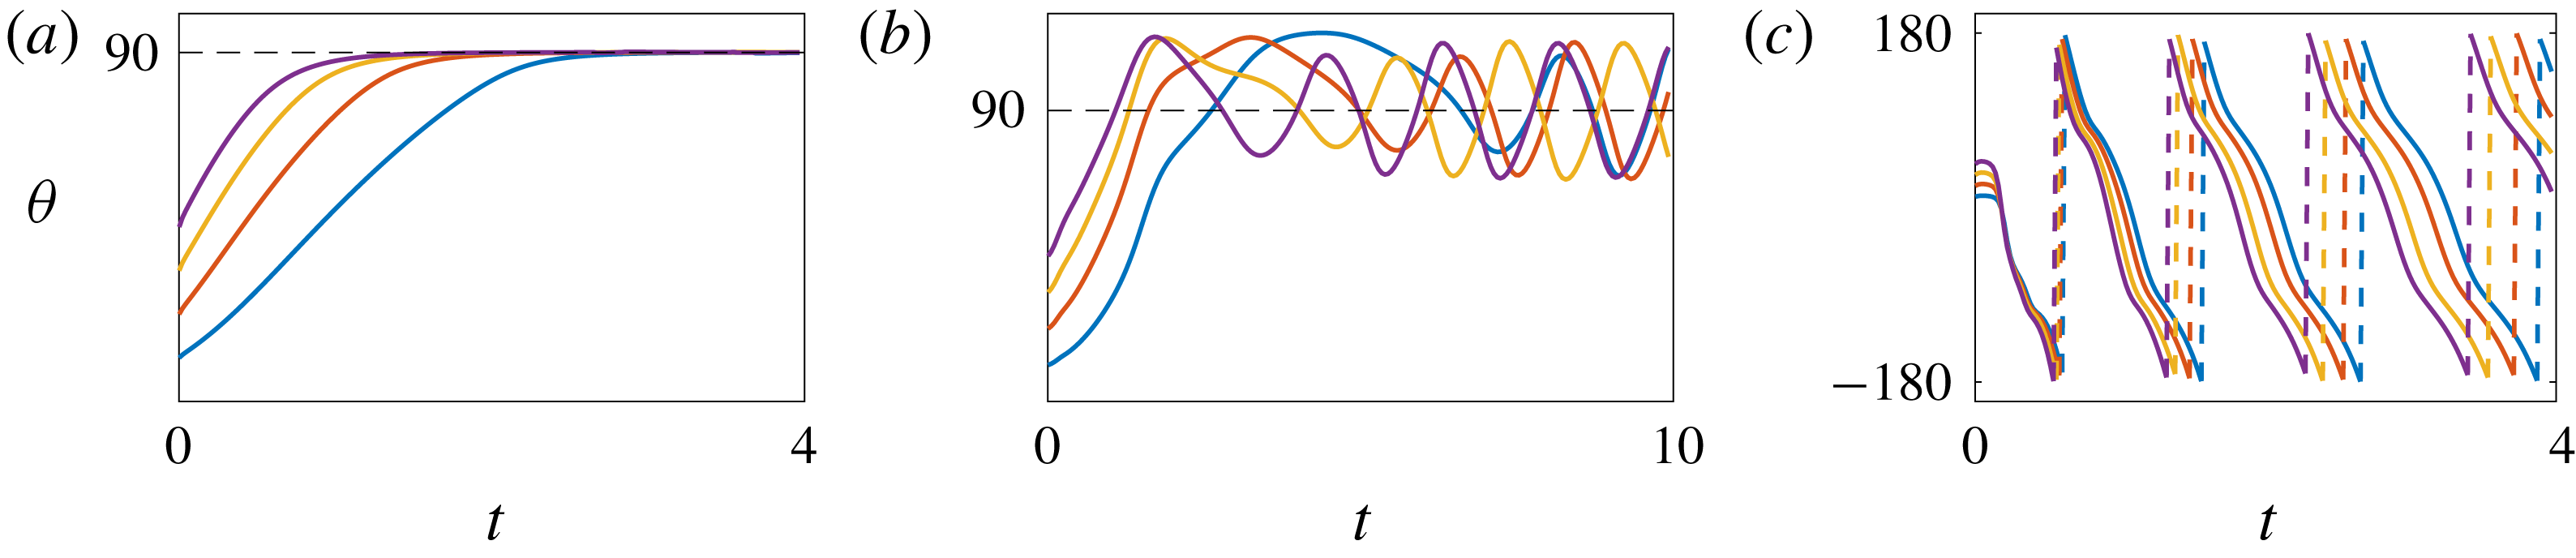
Insensitivity of the EHD pairwise interactions to the initial offset from the aligned position.
 $\unicode[STIX]{x1D703}$
measures the angular offset of the two vesicles relative to the horizontally aligned position. (a) Chain formation. (b) Oscillatory motion. (c) Circulatory motion. In each case, the same pattern is observed regardless of the initial
 $\unicode[STIX]{x1D703}>0$
.

The last type is an oscillatory motion, where the two vesicles form an unstable chain and oscillate about each other. This is a transitional situation between the first two types, observed when
 $\unicode[STIX]{x1D6EC}$
is between the values of those types. In this case, neither the circulatory flow of mechanism (ii) is strong enough to keep vesicles rotating about each other nor the deformational flow of mechanism (iii) is strong enough to completely halt the rotations. The two vesicles tend to form a chain that is periodically tilted one way or the other; each time the vesicles pass a tilted-chain position, tank-treading slows down and the dipole orientation oscillates back. Therefore, mechanisms (i) and (ii) collaborate to keep the vesicles oscillating near the vertical chain position.
On the other hand, the dynamics is much simpler when the membrane is permeable to charges, i.e.
 $G\gg 0$
. After a very short period of initial charging, the electric stresses become almost normal to the surface of each vesicle, so mechanism (ii) does not arise at all. By mechanism (iii) the vesicles eventually become oblate when
 $\unicode[STIX]{x1D6EC}<1$
(with strong enough
 $\unicode[STIX]{x1D6FD}$
) and become prolate when
 $\unicode[STIX]{x1D6EC}>1$
, and mechanism (i) drives the vesicles to form a vertical chain.
3.3.1 Sensitivity to positions and shapes
Note that all of the aforementioned dynamics are insensitive to the initial offset or shapes of the vesicles. In figure 8, we demonstrate that for different initial angular offsets from the aligned position, the vesicles undergo the same type of pairwise interaction that corresponds to the given
 $\unicode[STIX]{x1D6EC}$
and
 $G$
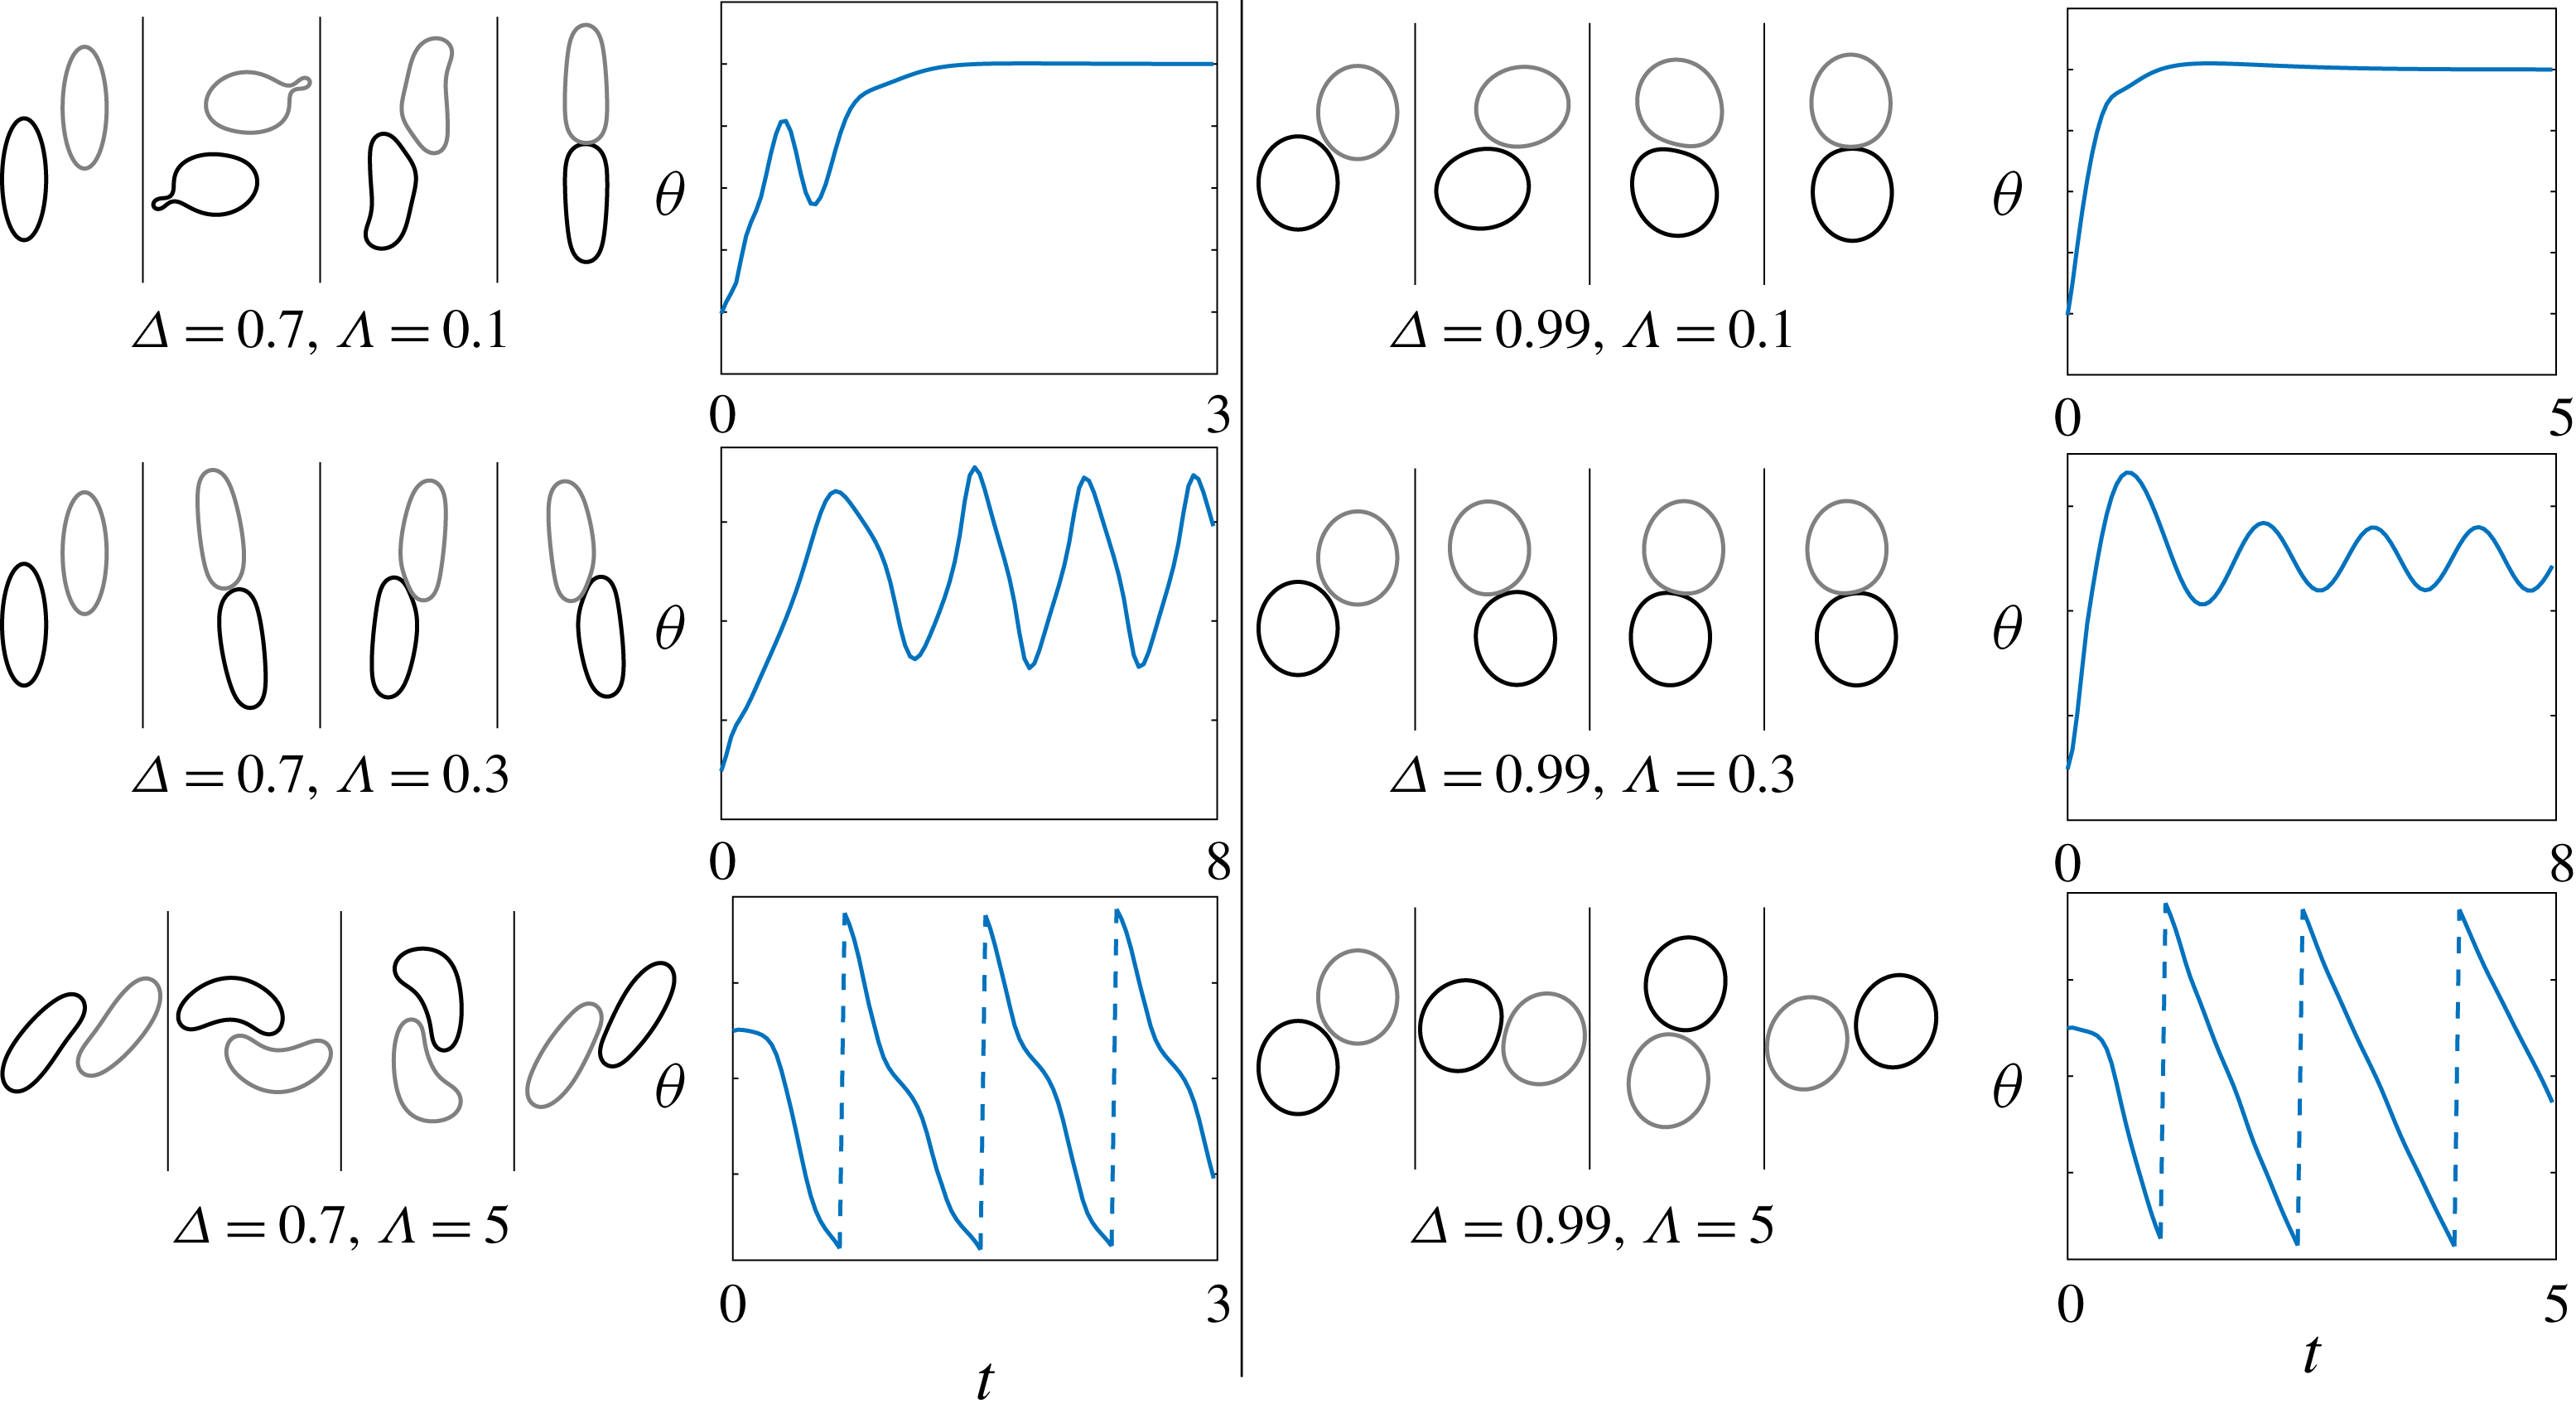
. Furthermore, figure 9 shows that a similar kind of dynamics is observed for vesicles with different reduced volumes, therefore, the pairwise EHD interaction mechanisms appear to be consistent for highly deflated or close-to-circular vesicles.
Pairwise interactions for
 $G=0$
vesicles of reduced volumes
 $\unicode[STIX]{x1D6E5}=0.7$
(with
 $\unicode[STIX]{x1D6FD}=4.8$
) and
 $\unicode[STIX]{x1D6E5}=0.99$
(with
 $\unicode[STIX]{x1D6FD}=2.4$
).
 $Ca=0$
. The behaviours (e.g. chain formation, oscillatory motion, circulatory motion) are the same as in the
 $\unicode[STIX]{x1D6E5}=0.9$
case (figure 6), showing that the mechanism of pairwise interactions is insensitive to the reduced volume. Note that the bud formation also happens in the case
 $\unicode[STIX]{x1D6E5}=0.7,\unicode[STIX]{x1D6EC}=0.1$
.

3.3.2 Continuous transition
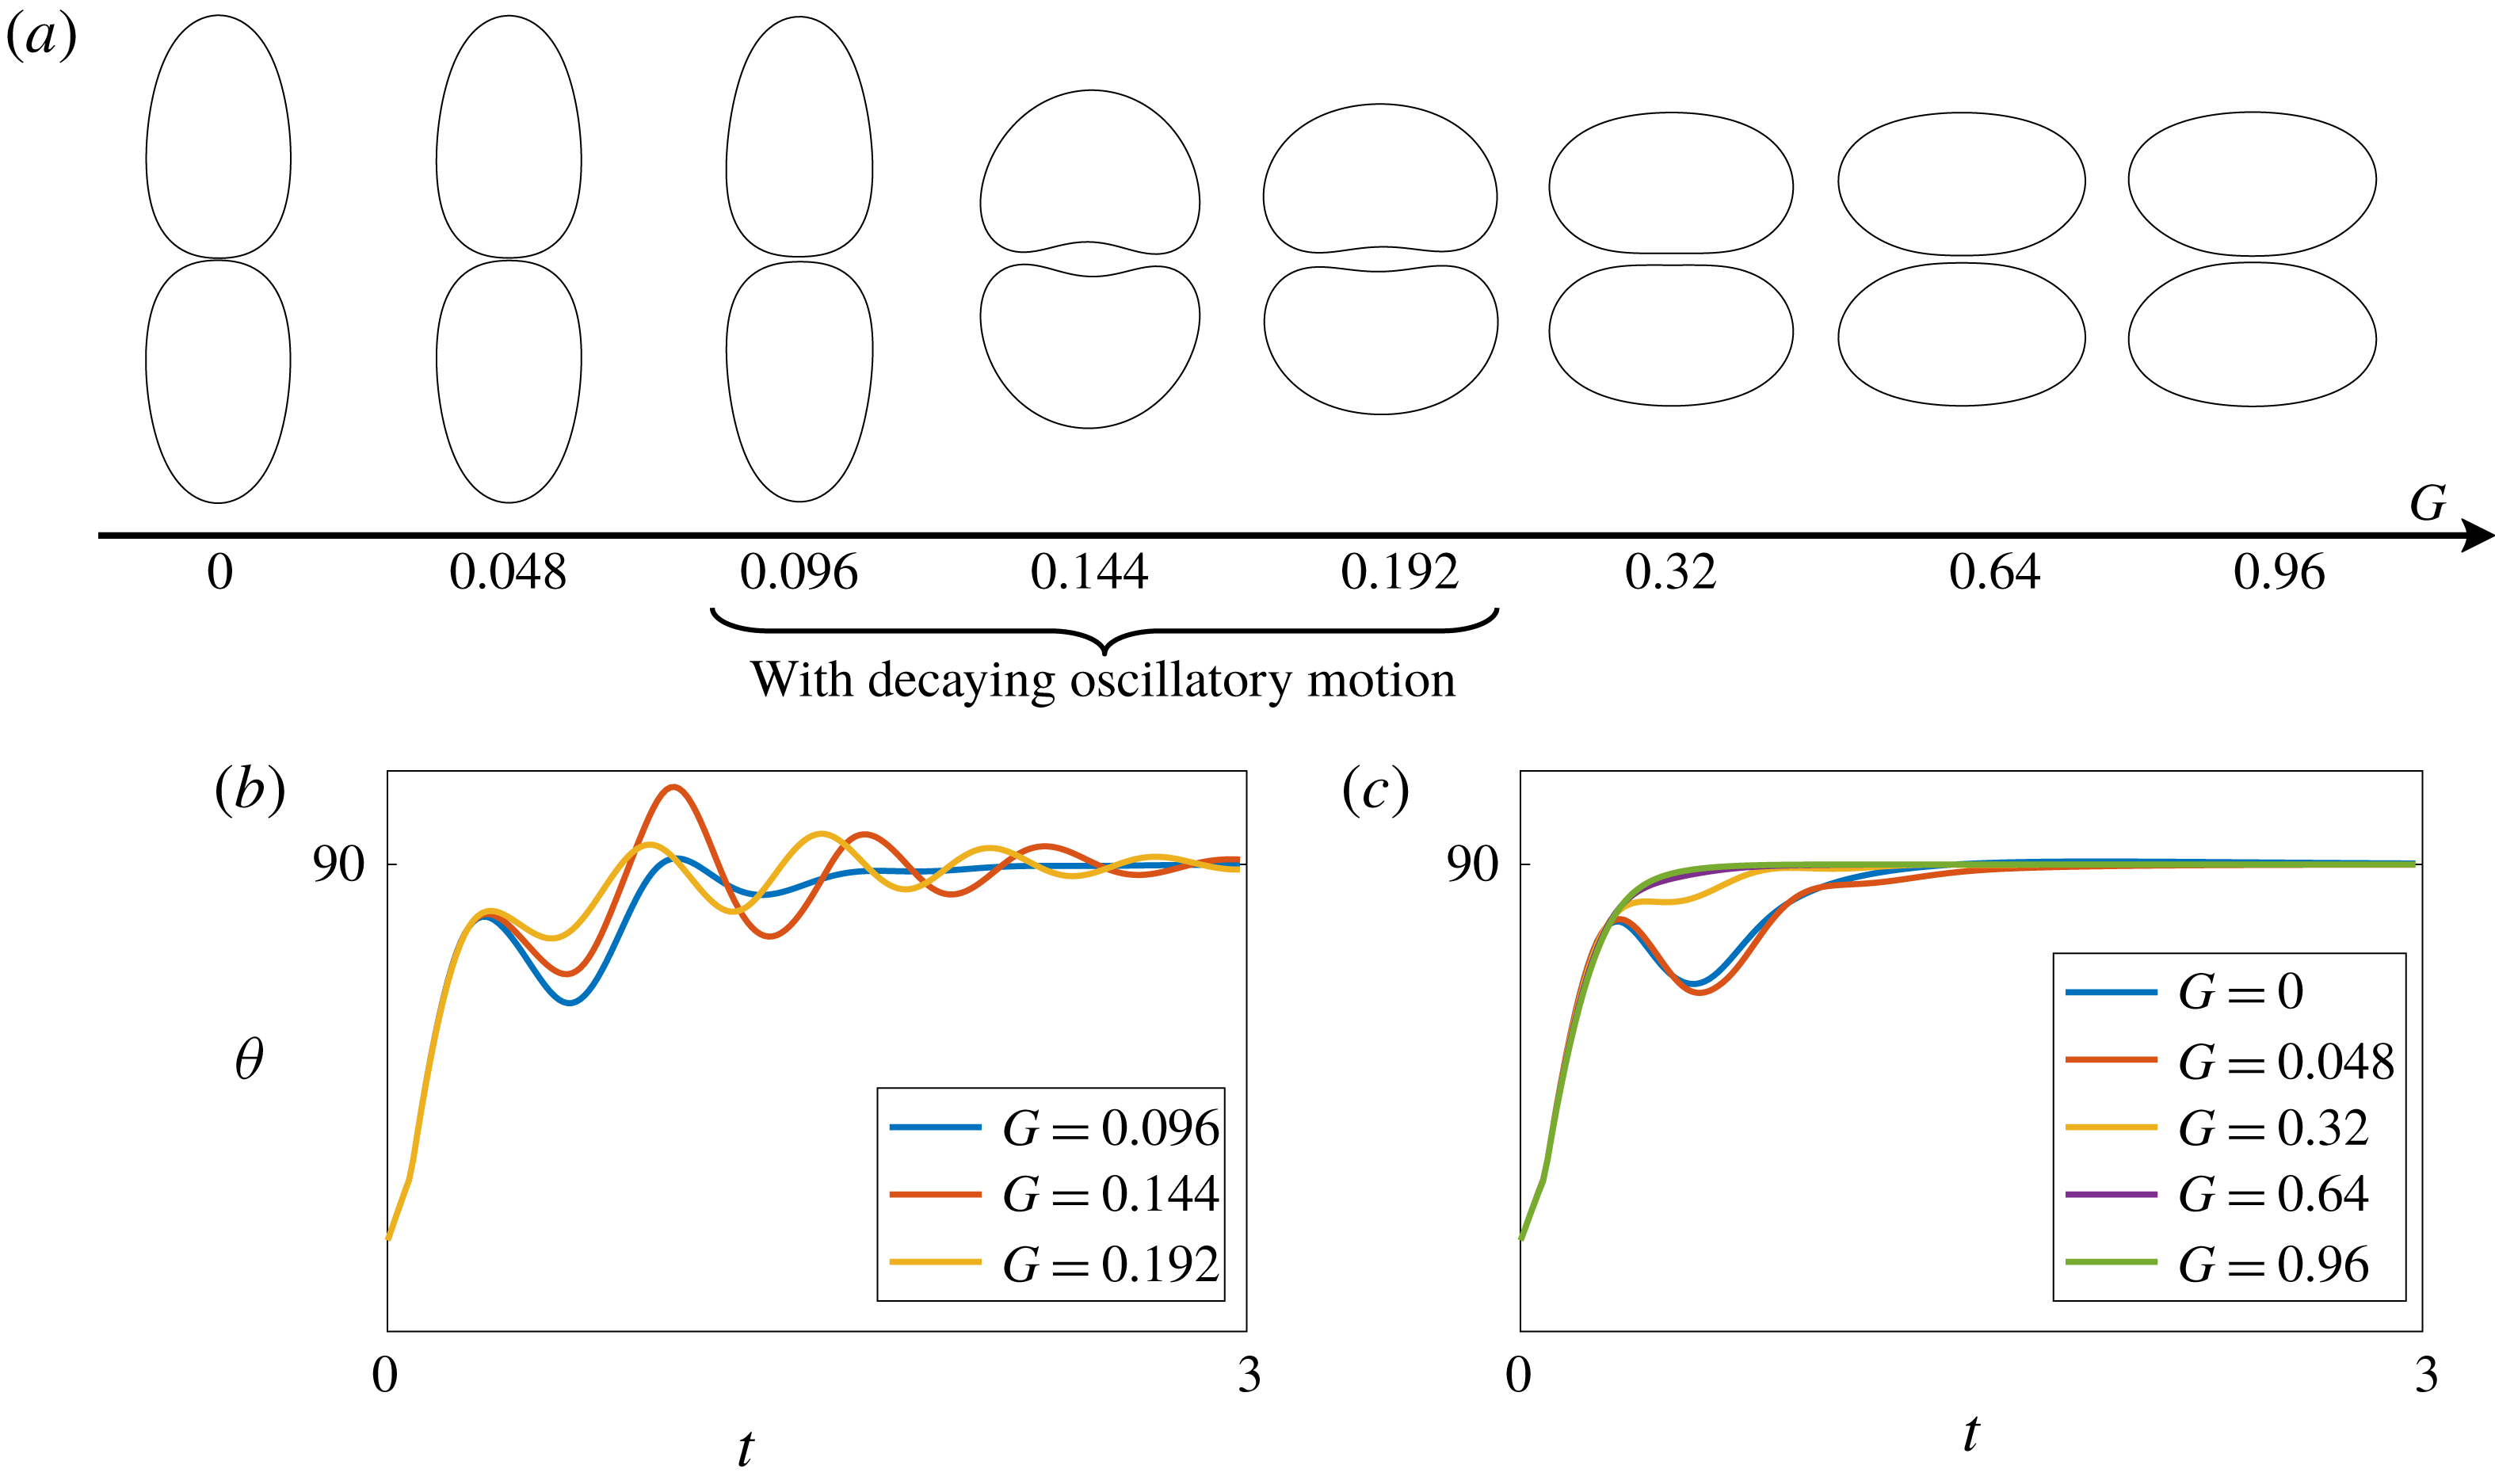
Finally, we note that the dynamics transitioning from
 $G=0$
to
 $G>0$
, as shown in figure 6, is not abrupt. To illustrate this, we show in figure 10 the pairwise dynamics of vesicles with
 $\unicode[STIX]{x1D6EC}=0.1$
, demonstrating a continuous transition from a chain of prolates (
 $G=0$
) to a chain of oblates (
 $G\gg 0$
); for certain intermediate values of
 $G$
, one can even observe interesting kidney-like shapes as well as decaying oscillations of the vesicles as they settle into their equilibrium shapes.
(a) Final configurations of eight separate simulations, each corresponding to a different membrane conductivity
 $G$
. There is a continuous transition from a chain of prolates (
 $G\approx 0$
) to a chain of oblates (
 $G\gg 0$
). For certain intermediate value of
 $G$
(e.g.
 $G=0.096$
, 0.144, 0.192) the chain formation process is accompanied by decaying oscillatory motions (b), while for more extreme values of
 $G$
the vesicles directly form a chain without oscillations (c). For all simulations
 $\unicode[STIX]{x1D6FD}=3.2$
,
 $\unicode[STIX]{x1D6EC}=0.9$
and
 $Ca=0$
.

4 Conclusions
We presented a well-conditioned BIE formulation for solving the leaky-dielectric model describing the EHD of deformable vesicles. A collection of numerical advances (semi-implicit time-stepping, spectrally accurate evaluation of weakly singular, nearly singular and hyper-singular integrals) enabled us to shed light onto the mechanics of highly deflated vesicles, and study their rheology and pairwise dynamics in DC electric fields. We showed that a much richer set of pairwise interactions can be observed when the membranes are impermeable to charges. This is somewhat unique to vesicle EHD compared to other systems such as drops (Baygents, Rivette & Stone Reference Baygents, Rivette and Stone1998), driven mainly by the capacitative nature of the membranes. However, we explored only a small fraction of the possible dynamics; relaxing our simplifying assumptions (varying the viscosity and permittivity contrasts, imposing an AC electric field, accounting for charge convection along the membrane) is expected to enrich the space much further. We are currently exploring these as well as analysing the collective dynamics of dense suspensions in periodic domains using the periodization techniques developed recently in Marple et al. (Reference Marple, Barnett, Gillman and Veerapaneni2016) and Barnett et al. (Reference Barnett, Marple, Veerapaneni and Zhao2018). Another important direction we are currently pursuing is to extend our numerical scheme to handle more general EHD models such as those discussed in the recent work of Mori & Young (Reference Mori and Young2018).
Acknowledgement
The authors gratefully acknowledge support from the National Science Foundation under grants DMS-1418964, DMS-1454010 and DMS-1719834.