Introduction
Forming and utilizing categories are important cognitive abilities which aid learning, understanding, and navigation of the world. Awareness of categories and category structure allows for generalization of knowledge, and the fast transfer of information via inductive reasoning. When categories are known, properties of objects do not have to be learned on an instance by instance basis; rather, some of the work can be shifted to the category. For example, instead of learning that bird A has a four-chambered heart, and bird B has a four-chambered heart, and so on for every bird encountered, employing category reasoning can collapse individual statements into general statements that cover multiple instantiations (e.g., birds have four-chambered hearts). The category label itself, for example the label bird, often provides an entrance to many both obvious (e.g., wings and beaks) and non-obvious (e.g., four-chambered hearts and 80 chromosomes) properties of the category. Having a category label also affords the transfer of properties from one member of the group to other members of the category such that a new feature learned about one member can be passed onto another category member through a process known as categorical induction. The category label itself, in this type of inductive reasoning, is a type of cue to the category and its properties. The label can become a shortcut to the category, such that just saying a particular animal is a bird leads to the belief that the qualities of bird are true about it, and that if it is true of one bird it will be true of another.
The phenomenon of categorical induction, while robust in typically developing (TD) children across a wide array of studies (e.g., Gelman & Markman, Reference Gelman and Markman1987; Gelman & Markman, Reference Gelman and Markman1986; Gutheil & Gelman, Reference Gutheil and Gelman1997; Rhodes, Brickman & Gelman, Reference Rhodes, Brickman and Gelman2008; Deák & Bauer, Reference Deák and Bauer1996; Davidson & Gelman, Reference Davidson and Gelman1990; Welder & Graham, Reference Welder and Graham2001; Jaswal & Markman, Reference Jaswal and Markman2007; Xu, Dewar & Perfors, Reference Xu, Dewar, Perfors, Hood and Santos2009; Brandone, Reference Brandone2017), is nonetheless not universally observed in all children in all studies, as will be described below. Moreover, categorical induction has been reported to be particularly fragile and inconsistent in individuals with autism spectrum disorders (ASD) (Naigles, Kelley, Troyb & Fein, Reference Naigles, Kelley, Troyb and Fein2013). The basis for their fragile grasp, however, is still unclear, as other developmental skills vary in their relationship to categorical induction (Naigles et al., Reference Naigles, Kelley, Troyb and Fein2013; Kelley, Paul, Fein & Naigles, Reference Kelley, Paul, Fein and Naigles2006). The current study breaks new ground by comparing categorical induction performance in a new sample of TD children and children with ASD, whose language development has been tracked since they were 1–2 years of age (Naigles & Fein, Reference Naigles, Fein and Naigles2017). We investigate whether group differences in categorical induction abilities are observed in this sample, and the degree to which concurrent and/or early correlates of language are associated with individual differences in categorical induction performance.
Categorical induction in TD children
Natural kinds are non-invented categories hewn from the natural world (e.g., birds, roses, and volcanoes), and are ontologically different from artifacts which are man-made objects designed for a particular function or purpose (e.g., cars, chairs, and laptops). Natural kinds are particularly compelling because they showcase essentialism (Gelman, Reference Gelman2003), in that people tend to believe that natural kinds are real, are rooted in the natural order, are united by an unobservable essence which causes the category to cohere, and that words can be used as labels to map onto them. As a category, a natural kind has no set necessary and sufficient perceptual criteria for membership (e.g., a bird that has no feathers or does not lay eggs is still a bird). Rather it depends upon the co-occurrence of multiple possible properties, and is not dependent upon the presence of any one property. Some properties are obvious upon seeing a member of a category (e.g., birds have wings), but many are nonobvious upon casual observation. Nonobvious properties are those that lie beneath the surface of an object or being, such as internal material (e.g., DNA or organs) or behavior (e.g., nest-building, eating worms). These properties are generally considered stable over time and provide each natural kind an “essence” which holds members of the category together in a conceptual way (Gelman, Reference Gelman2003). While members of a natural kind category cannot be known solely on perceptual properties (e.g., a bat may resemble a bird, but is a mammal), many perceptible traits can also serve as pointers to category membership (e.g., most birds can be categorized as a bird based on the occurrence of wings, beaks, feathers, stick-like legs, and grasping or webbed toes). The whole, however, is greater than the sum of its parts, as the essence of being a bird transcends any combination of physical properties.
Furthermore, categorical induction can be made without perceptual support, indicating a reliance on the label over the physical appearance of a category member. For example, while a bat may share many physical similarities with a bird, it does not share an underlying essence of “birdness,” and does not receive the label of bird. Thus, despite the perceptual similarities, transferring properties known about a bird to a bat, would be unwarranted. Penguins, on the other hand, share few perceptual traits with other birds, yet they share “birdness” (possibly in the form of DNA) conveyed by the shared category label, and this supports the extension of bird traits to penguins. The shared label bird provides the cue that penguins and robins, while perceptually quite different, can share many common traits. The power of language to organize category awareness can be observed in infants during their first year of life (Fulkerson & Waxman, Reference Fulkerson and Waxman2007; Ferry et al., Reference Ferry, Hespos and Waxman2010) and, by twelve months of age, individual words promoted object categorization (Waxman & Braun, Reference Waxman and Braun2005; Waxman & Booth, Reference Waxman and Booth2003). For example, when infants were presented with different exemplars from a category (e.g., dinosaurs) accompanied by a category label, at test they indicated a category had been formed by showing a novelty preference for a non-category member (e.g., a fish). No novelty preference was shown when the exemplars were accompanied by a tone stimulus (Fulkerson & Waxman, Reference Fulkerson and Waxman2007). Thus, the category label appears to incite the grouping of perceptually similar, yet distinct, objects into a category associated with that label. Other auditory stimuli do not seem to elicit that same tendency to group objects (Fulkerson & Waxman, Reference Fulkerson and Waxman2007).
The willingness to transfer information about a known category member to a novel labelled category member has been observed in preschool-aged children even when perceptual information might point them another way (Gelman & Markman, Reference Gelman and Markman1986; Gelman & Markman, Reference Gelman and Markman1987). Gelman and Markman (Reference Gelman and Markman1986) tested four-year-old children with a forced choice task using a set of three pictures. They intentionally pitted perceptual similarity against category membership to see which characteristic children would use to extend properties known about an object. In 68% of the trials, children based their inductions on category membership rather than perceptual similarity.
In a follow up study, three-year old children were found to perform similarly (Gelman & Markman, Reference Gelman and Markman1987). Here three and four-year-old children were presented with an exemplar of a natural kind and told a basic fact about it. They were then serially questioned whether or not that property would be extended to four other objects: another exemplar from the same category and of similar appearance; another example from the same category but of different appearance; another example from a different category but of similar appearance; and an example from a different category and of different appearance. Both three and four-year-old children transferred properties more often on the basis of category membership (via the label) than on the basis of similar appearance. The highest numbers of property extensions occurred in the case where the category label and appearance were similar to the original exemplar. Extension was much lower when only the physical appearance was similar (Gelman & Markman, Reference Gelman and Markman1987).
While children as a group are reliably able to use category membership to extend properties, some children are less consistent than others. That is, a given sample can be performing above chance in extending properties on the basis of category rather than perceptual features, but above-chance performance doesn't necessarily extend to all children, nor all items. Indeed, across a wide range of studies, in age groups that perform above chance (60% to 80% category-level responses), none reach 100% (Brandone, Reference Brandone2017; Gelman, Reference Gelman2003; Graham, Gelman & Clarke, Reference Graham, Gelman and Clarke2016; Jaswal & Markman, Reference Jaswal and Markman2007; Gelman & Markman, Reference Gelman and Markman1986, 1987). For example, 67% of three-year-old children and 60% of four-year-old children extended properties to category matches in a yes/no testing procedure where the category match differed in appearance from its category mate (e.g., from a leaf bug to a black beetle). When asked if properties could be extended to perceptually similar members of a different category (e.g., from a small brown snake to a brown worm) 37% of the three-year-olds and 22% of the four-year olds said yes; these percentages are different from chance, but not all children are responding in this way with all items (Gelman & Markman, Reference Gelman and Markman1987). Similarly, in a forced choice task that directly pitted the perceptually different category member against a perceptually similar object from a different category, 67% of four-year-old children chose the category member if the category was living (e.g., fish) and 69% chose the category member when the category was non-living (e.g., gold; Gelman & Markman, Reference Gelman and Markman1986). Other contributing factors have not been examined (e.g., vocabulary, nonverbal IQ); thus, it is unclear how to attribute the variation in performance of these typically developing children. It is likely that some amount of this less-than-perfect responding simply reflects the experimental noise characteristic of tasks involving young children; i.e., attributable to momentary lapses of attention and interest. However, it is also possible that children's individual variability in category-level responding in induction tasks is indicative of stable individual differences. We examine this possibility in the current study by investigating the degree to which variability in categorical induction performance is associated with developmentally earlier performance in a related skill. This is a widely attested analysis when tracing the precursors of language and other impairments in children with developmental disorders (e.g., Mawhood, Howlin & Rutter, Reference Mawhood, Howlin and Rutter2000), and, as we discuss in the next section, categorical induction, and categorization in general, have been found to be impaired in children with ASD.
Categorical induction in children with ASD
In contrast to the general robustness of early categorical induction in TD children, children and adolescents with autism spectrum disorder (ASD) show fragility and inconsistency with similar tasks. For example, Kelley and colleagues (Reference Kelley, Paul, Fein and Naigles2006) used the same task as Gelman and Markman (Reference Gelman and Markman1987) with a group of children with a history of ASD (H-ASD) ranging in age from five to nine years who were attending mainstream schools and judged to be functioning academically on par with TD classmates. These children performed less consistently than their age matched TD peers; in particular, the H-ASD group extended properties to the category match only 52.68% of the time compared to 70.19% of the time for the control group. For the identical match, the H-ASD group extended the property for 83.04% of cases compared to 94.64% for the controls. Across both groups, children with better categorical induction scores also performed better on a mental verb distinction task but not on assessments of complex syntax or pragmatics. The H-ASD group's performance on standardized vocabulary tests was on par with the TD group; however, knowledge of individual words did not translate into a greater awareness of how words relate to categories.
Subsequently, Naigles and colleagues (Reference Mottron, Dawson, Soulières, Hubert and Burack2013) found that nine-year-old, and even 12-year-old, children with ASD were less consistent in their inductive abilities than TD peers, despite equivalent vocabularies and full-scale IQs. This inconsistency in categorization in general is frequently reported for children with ASD; for example, processing of somewhat typical and atypical exemplars takes longer and is less accurate in school age children and adolescents with ASD compared to TD peers (Gastgeb, Strauss & Minshew, Reference Gastgeb, Strauss and Minshew2006). In addition, the presence of an atypical example from any category just prior to assessing a somewhat typical exemplar has been shown to diminish accuracy (Ellawadi, Fein & Naigles, Reference Ellawadi, Fein and Naigles2017). Furthermore, even when children with ASD's performance on a category identification task was identical to that of TD children, electrophysiological evidence has revealed atypical hemispheric asymmetries in the ASD group's processing of category information (Fiebelkorn, Foxe, McCourt, Dumas & Molholm, Reference Fiebelkorn, Foxe, McCourt, Dumas and Molholm2013). Taken together, these findings suggest that, while category information or category structure is available to children with ASD, it may be less readily accessed, and/or structured differently, compared with TD peers (see also Naigles & Chin, Reference Naigles, Chin, Bavin and Naigles2015; Alderson-Day & McGonigle-Chambers, Reference Alderson-Day and McGonigle-Chambers2011; Mercado & Church, Reference Mercado and Church2016).
What we still do not know is why categorical induction specifically, and categories more generally, are so challenging for children with ASD. One difficulty in interpreting the findings is that concurrent language correlates of categorical induction and categorization vary across studies. For example, only knowledge of mental verbs was associated with categorical induction in Kelley et al. (Reference Kelley, Paul, Fein and Naigles2006), while pragmatic ability and nonverbal IQ were the primary correlates in Naigles et al. (Reference Naigles, Kelley, Troyb and Fein2013) and Ellawadi et al. (Reference Ellawadi, Fein and Naigles2017), respectively; other studies (e.g., Gastgeb et al., Reference Gastgeb, Strauss and Minshew2006) did not report concurrent correlates. Given this variability with concurrent correlates, in the current study we propose to look for developmentally earlier correlates, in the hopes of discovering how earlier semantic challenges may shed light on later ones. This analytic procedure has had considerable success at the macro-level, revealing for example that early general language performance, nonverbal IQ (both assessed via standardized tests), and joint attention abilities (Mawhood et al., Reference Mawhood, Howlin and Rutter2000; Szatmari, Bryson, Duku, Vaccarella, Zwaigenbaum, Bennett & Boyle, Reference Szatmari, Bryson, Duku, Vaccarella, Zwaigenbaum, Bennett and Boyle2009; Turner, Stone, Pozdol & Coonrod, Reference Turner, Stone, Pozdol and Coonrod2006; Wodka, Mathy & Kalb, Reference Wodka, Mathy and Kalb2013) are predictors of early language. In the current study, we propose to use the same analytic procedure with a more specific aspect of language outcome (namely, categorical induction) and a more specific precursor (namely, the shape bias).
The shape bias
The shape bias refers to the general tendency shown by young word-learners, as well as older children and adults, to use shape as the basis of generalization about a labelled object as opposed to other properties such as color or texture (Landau, Smith & Jones, Reference Landau, Smith and Jones1988; Diesendruck, Markson & Bloom, Reference Diesendruck, Markson and Bloom2003). In a typical shape bias teaching trial, children are shown a novel 2-dimensional or 3-dimensional object with a novel label (e.g., “dax”). Test trials involve presenting a set of novel objects that match the original object on various properties (e.g., shape, size, color, material). Children are then asked to find “another dax”. TD children taught the novel word robustly extend based on shape, compared to less or no extension by children in no-word conditions (Keates & Graham, Reference Keates and Graham2008; Landau et al., Reference Landau, Smith and Jones1988; Diesendruck et al., Reference Diesendruck, Markson and Bloom2003; Xu et al., Reference Xu, Dewar, Perfors, Hood and Santos2009). Although the shape bias relies on recognition of some degree of perceptual similarity, it is the linking of shape to the label, over just grouping unnamed objects by shape, that makes the shape bias a powerful word-learning strategy. Indeed, the shape bias has been shown to be pivotal in early lexical development, as children with larger vocabularies often showed an earlier and/or stronger shape bias (Samuelson & Smith, Reference Samuelson and Smith1999). The shape bias is thus an early categorization skill which privileges a particular perceptual aspect of an object, shape, which is arguably the most global and functional characteristic of an object, and links it to a linguistic label. At the same time, the influence of other perceptual features, such as color or texture, must be constrained.
The underlying mechanism supporting the shape bias is a topic of active debate, with some supporting a conceptual account of the shape bias in which children use the shape of an object as a cue to its category membership, simultaneously incorporating conceptual knowledge they have about objects (e.g., Diesendruck et al., Reference Diesendruck, Markson and Bloom2003; Booth & Waxman, Reference Booth and Waxman2008). Others posit an attentional learning account (e.g., Smith, Reference Smith and MacWhinney1999; Colunga & Smith, Reference Colunga and Smith2008) which suggests that children capitalize on correlations they observe in the real word that object labels often group by shape (Smith, Reference Smith and MacWhinney1999). Regardless of mechanism, the shape bias is agreed to be pervasive among TD children over the age of 18 months (Landau et al., Reference Landau, Smith and Jones1988; Perry & Samuelson, Reference Perry and Samuelson2011) and to underlie semantic acquisition and possibly organization.
Children with ASD as a group have not consistently manifested a shape bias (Field, Allen & Lewis, Reference Field, Allen and Lewis2016; Hartley & Allen, Reference Hartley and Allen2014; Potrzeba, Fein & Naigles, Reference Potrzeba, Fein and Naigles2015; Tek, Jaffery, Fein & Naigles, Reference Tek, Jaffery, Fein and Naigles2008). In a key study, children with ASD aged around 33 months and younger 20-month-old language matched TD children were tested using an intermodal preferential looking (IPL) paradigm in 4–6 sessions spanning 2 years (Potrzeba et al., Reference Potrzeba, Fein and Naigles2015; Tek et al., Reference Tek, Jaffery, Fein and Naigles2008). TD toddlers consistently across sessions looked longer to the shape match in a condition where the object was named compared to one (within subjects) where the object was not named. The toddlers with ASD did not, as a group, show this looking pattern. Instead, they showed no stronger preference for shape extensions when they heard ‘find another dax’ compared to ‘which one looks the same’. These findings indicate that in ASD the label may not be consistently used as a cue to category membership. Further analyses indicated that the children with ASD did not show a systematic color bias either, nor was their shape bias performance affected by the complexity of the visual stimuli or the number of ‘shape-related’ words in their vocabularies; see Potrzeba et al. (Reference Potrzeba, Fein and Naigles2015) and Abdel-Aziz, Kover, Wagner and Naigles (Reference Abdel-Aziz, Kover, Wagner and Naigles2018) for more details.
Choosing to use shape to extend a novel object's label can be evidence that a higher order generalization, such as function or kind, has been made (Colunga & Smith, Reference Colunga and Smith2008; Diesendruck & Bloom, Reference Diesendruck and Bloom2003). Early on, toddlers learn many individual categories (e.g., cup, ball, or dog) as well as specific perceptual properties of those categories (Samuelson & Smith, Reference Samuelson and Smith1999). On the attention learning account, this has been proposed to set the stage for noticing higher order similarities (such as shape determining function) allowing for abstract knowledge to arise (Colunga & Smith, Reference Colunga and Smith2008). On the conceptual account, the use of shape as a cue to kind also reflects some level of abstraction from specific characteristics of the objects (Booth & Waxman, Reference Booth and Waxman2002). Thus, on both accounts, this budding ability to abstract might be an early skill that is also important for categorical induction.
The shape bias and categorical induction are not identical operations. Manifesting a shape bias indicates that a child is able to extract particularly useful perceptual information (in this case, shape) from a novel object, and subsequently map this information to a novel label, and, finally, use shape as a basis on which to extend the novel label. In categorical induction, a child first utilizes the knowledge that members of a category share many obvious and non-obvious properties, then uses a shared category label as a cue to extend properties to new members. What these two skills may share is the child's use of organizing principles. In the shape bias the organizing principle is that objects of the same category share a common shape and label, and the expectation is that shape is a cue to category membership. In induction the organizing principle is that category members share multiple properties and the expectation is that the label is a cue to occurrence of those properties.
The current study
The current study has two goals. First, we attempt to replicate previous findings of group differences in categorical induction in a new sample of school age TD children and children with ASD. We predict that children with ASD will not exhibit categorical induction as robustly as TD peers: in other words, fewer children with ASD will extend properties on the basis of category membership in a highly consistent manner compared with TD children. A secondary prediction is that children with ASD will extend properties more to objects that are perceptually similar to the example object than TD peers. This could indicate a utilization of perceptual information in inductive extensions, which may not be warranted since the perceptually similar object is a member of a different category. Second, we examine the extent to which concurrent and/or early correlates of language are associated with individual differences in school age categorical induction performance. If the shape bias is rooted in similar processes as categorical induction, we predict that children with stronger shape biases as toddlers will perform better on categorical induction tasks in early childhood. For the children with ASD, a group characterized by weaknesses in both areas, two possible results might be observed. First, the same pattern might emerge as predicted for TD children, that those with stronger shape biases will perform better on categorical induction. This would indicate a similar developmental trajectory, with some children falling behind early in development. A second pattern might emerge, though, such that shape bias and categorical induction are not related, which could suggest an alternative language development trajectory for children with ASD.
Methods
Participants
The current study was approved by the Institutional Review Board at the University of Connecticut as part of an ongoing longitudinal investigation of early language development of children with ASD (Naigles & Fein, Reference Naigles, Fein and Naigles2017). A total of 54 children participated in the categorical induction task; however, eight children with ASD were not included in the current analysis, either because they did not complete the task (n = 5), or because they answered yes to every question (n = 3). The final sample included a total of 16 children with ASD (2 females, 14 males) and 30 TD children (5 females, 25 males). The children with ASD were originally recruited through various service providers in New England; all had been diagnosed with DSM-IV Autistic Disorder or PDD-NOS prior to being contacted for the study. The Autism Diagnostic Observation Schedule-Generic (ADOS-G; Lord, Rutter, DiLavore & Risi, Reference Lord, Rutter, DiLavore, Risi, Gotham and Bishop2002) was used to confirm the diagnosis at their first visit. The TD children, also participants in the longitudinal study, were recruited from the local area via birth announcements and word of mouth.
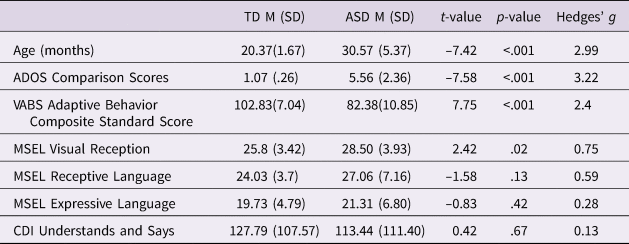
The current sample (i.e., those who participated in the categorical induction task) comprised a subset of the entire longitudinal sample; as can be seen in Table 1, the children in the current TD and ASD groups did not differ on language ability, resulting in an ASD group chronologically older than the TD group. These children's ages, autism severity, vocabulary, and cognitive scores at their initial visit can be found in Table 1.
Participant Characteristics at Initial Visit for Those who Participated in the Categorical Induction Task

Note: ADOS-= Autism Diagnostic Observation Schedule; comparison scores allow for comparisons across modules, ages, and language ability; MSEL = Mullen Scales of Early Learning, Raw Scores; VABS =Vineland Adaptive Behavior Scale; CDI= MacArthur Communicative Development Inventory
Hedges’g is a measure of effect size suitable for comparisons with unequal sample sizes.
One TD child is missing the CDI
A follow up visit was conducted approximately one year later (designated here as Visit 2). At that time, nonverbal cognitive abilities were still similar between the two groups, and the shape bias was assessed (see Table 2). These shape bias findings differ somewhat from those reported by Potrzeba et al. (Reference Potrzeba, Fein and Naigles2015) because the ones in Table 2 only include the children in the current sample, those who participated in the categorical induction task.
Participant Characteristics at Visit 2 for Those who Participated in the Categorical Induction Task

Note: MSEL= Mullen Scales of Early Learning, Raw Scores: The Shape Bias Score reflects the proportion of time the child looked to the same-shape object during the Name trials compared to the NoName trials; Hedges’g is a measure of effect size suitable for comparisons with unequal sample sizes. (one child with ASD is missing MSEL scores)
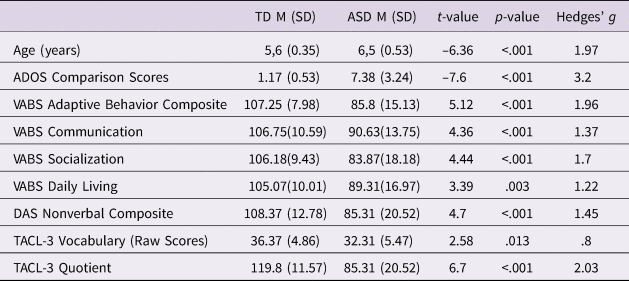
At the time of the current study (designated as Visit 3), the TD children had progressed beyond the ASD group in general language measures. Participants’ current language ability, nonverbal IQ scores, autism severity, and adaptive functioning scores are provided in Table 3.
Participant Characteristics at time of the Current Study (Visit 3)

Note: ADOS-= Autism Diagnostic Observation Schedule, Comparison Scores are reported to facilitate comparisons across multiple Modules: VABS= Vineland Adaptive Behavior Scales; DAS = Differential Ability Scales; TACL 3= Test for Auditory Comprehension of Language, 3rd edition: All scores are Standardized Scores unless noted. Hedges’g is a measure of effect size suitable for comparisons with unequal sample sizes.
Three TD children and one child with ASD are missing VABS data
Overall Procedure
All testing was conducted in the homes of the children in the course of an ongoing longitudinal study. Children were assessed by the experimenter in a quiet room, usually a living room or family room. Measures for the current study, Visit 3, were given in two sessions that occurred a maximum of two weeks apart. Parents had the option of being present during assessment but were asked not to guide their children's answers in any way.
Materials
Standardized test measures.
Autism Diagnostic Observation Schedule-Generic (ADOS-G; Lord et al., Reference Lord, Rutter, DiLavore, Risi, Gotham and Bishop2002), a semi-structured, standardized assessment of communication, social interaction, play/imaginative use of materials, and restricted and repetitive behaviors, was used to reconfirm the autism diagnosis. For current study, Modules 3 (fluent speech), 2 (phrase speech), and 1 (preverbal, single words) were used depending on the language level of the participants; calibrated scores for comparison were calculated based on Gotham, Pickles and Lord (Reference Gotham, Pickles and Lord2009).
Vineland Adaptive Behavior Scales, 2nd Edition (Vineland II; Sparrow, Cicchetti & Balla, Reference Sparrow, Cicchetti and Balla2005), a parent interview used to evaluate children's communication, socialization, daily living skills, and motor skills, was administered at each visit.
Test for Auditory Comprehension of Language, 3rd edition (TACL 3; Carrow-Woolfolk, Reference Carrow-Woolfolk1999), a standardized assessment of receptive language ability in children, was utilized to measure language level at Visit 3. Three raw subscores are reported: Vocabulary, Grammatical Morphemes, and Elaborated Phrases and Sentences as well as the overall TACL-quotient. The TACL 3 was normed on 1,102 children and internal consistency for all subscores exceeds 0.84.
The Differential Ability Scales (DAS; Elliot, Reference Elliott1990), an assessment of cognitive ability suitable for children aged 2 to 17, was used to measure nonverbal cognition at Visit 3. The Nonverbal Composite Score was computed, using four subtests: Recall of Designs; Matrices; Pattern Construction; and Sequential and Quantitative Reasoning. The DAS was normed on 3475 children, with internal consistency coefficients above 0.90.
The Mullen Scales of Early Learning (Mullen, Reference Mullen1995), a test battery including visual reception, fine motor skills, receptive language, and expressive language subscales designed for infants and children through age five, was given at Visit 1. At Visit 2, only the visual reception subscale was administered.
The MacArthur Communicative Developmental Inventory-Words and Gestures (CDI-I; Fenson, Dale, Reznick, Thal, Bates, Hartung, Pethick & Reilly, Reference Fenson, Dale, Reznick, Thal, Bates, Hartung, Pethick and Reilly1993), a parental report of productive vocabulary, was given at Visit 1. “Total Understands and Says” was used as an index of language.
Visit 2 task: Shape Bias ( Potrzeba et al., Reference Potrzeba, Fein and Naigles2015)
The shape bias was assessed via Intermodal Preferential Looking (IPL), in which children viewed side-by-side videos of objects while listening to an audio track. IPL is suitable for investigating linguistic comprehension in children as young as 12 months, as well as children with ASD, as it lacks strong social demands and does not require word production. The shape bias task presented children with an unfamiliar target object, and two test objects: one object was the same shape, but of a different color; the other object was the same color but of a different shape. Novel objects were presented in two blocks: in the ‘NoName’ condition, children saw a novel target object while they heard, “Look at this!”, then the test objects were simultaneously presented while they heard, “Which one looks the same?” In the ‘Name’ condition, novel objects were introduced with the phrase “Look at the dax”; the sentence “Find another dax” was heard as the test items were presented. Five objects were presented in this way with ‘NoName’ trials in a block preceding ‘Name’ trials. A shape bias was indicated when children looked longer at the same-shape item in the ‘Name’ trials compared to the ‘NoName’ ones, indicating a coupling of name to shape rather than color. The difference score, calculated as the proportion of time a child looked at the same-shape object relative to the same-color object in the ‘Name’ block, minus the proportion of looking to the same-shape object relative to the same color object in the ‘NoName’ trials, is used here as the dependent measure. This is because our primary question concerned the children's usage of shape in the novel word extension context over and above any non-word shape generalization bias they might have. Further details concerning the task, setup, coding, and procedures can be found in Abdel-Aziz et al. (Reference Abdel-Aziz, Kover, Wagner and Naigles2018); Potrzeba et al. (Reference Potrzeba, Fein and Naigles2015) and Tek et al. (Reference Tek, Jaffery, Fein and Naigles2008).
Visit 3 task: Categorical induction. (Gelman & Markman, Reference Gelman and Markman1986).
Children were asked to predict whether a known property of one member of a category would be applicable to another member of the same category. The task specifically assesses whether the property would be extended (i.e., induction) based on the name of the category being the same.
Stimuli and procedure.
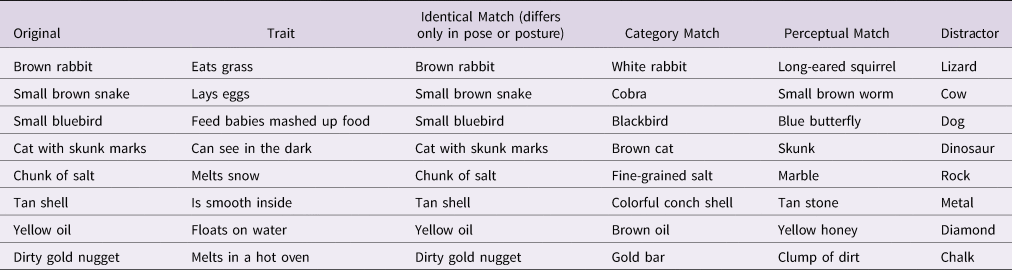
A total of eight natural kinds, four animate (e.g., a bird) and four inanimate (e.g., a shell), were tested. Children were shown cards with black and white line drawings of the objects. In each block, children were shown a picture of an object, told its basic level category name, and given an additional property of the object. Four subsequent test pictures were presented, and the child was asked if the new object shared the property. The four test pictures included: (1) an identical match, of the same category and similar in appearance; (2) a category match, sharing the same category only; (3) a perceptual match, sharing only a similar appearance; and (4) a distractor item, of a different category and having a different appearance. The category match is the critical item as extending the property is based on category membership and not appearance. A sample trial script for one block would be as follows.
The child is shown a picture of a black cat with a white stripe. “This black cat can see in the dark.” (Target)
The child is shown a picture of a black cat also with a white stripe sitting in a different pose. “Can this black cat also see in the dark?” (Identical Match)
The child is shown a picture of a brown cat. “Can this brown cat also see in the dark?” (Category Match).
The child is shown a picture of a skunk similar in appearance to the target cat. “Can this skunk also see in the dark?” (Perceptual Match)
The child is shown a picture of a dinosaur. “Can this dinosaur also see in the dark? (Distractor)
For the first card, the children were asked to repeat the information. For example, “See this black cat, it can see in the dark. What is this? What can it do?” The children then provided answers and the investigator recorded their responses on a response sheet. If the children were unsure, they were gently encouraged to pick the answer they thought was best. The overall order of presentation of items was consistent across all participants. The substructure of the test pictures was constructed in such a way as that the Identical Match, Category Match, Perceptual Match, and Distractor were presented in different orders for each item block. Children received a score of “1” for every time they extended a property to a new item, and a score of “0” when an extension was not made. The maximum number of extensions for each type of match was eight. Descriptions of the stimuli used can be found in Table 4.
Categorical Induction stimuli

Analysis plan
Between groups (independent samples) t-tests were used to determine if the groups differed in their performance on the categorical induction task; preliminary analyses revealed no differences in performance between the animate vs. inanimate items so these were combined for subsequent analyses. Group level differences were examined by independent samples t-tests for the Identical Match, Category Match, Perceptual Match, and Distractor trials, controlling for concurrent language because TACL vocabulary and quotient scores differed between the groups (see Table 3). In a secondary descriptive analysis to determine group level performance stability, the children in each group were further classified based on the consistency of their extensions. Children were classified as “Highly Consistent Extenders” (extending on 7 or 8 of the 8 trials or 88–100 percent of the time), “Consistent Extenders” (extending on 5 or 6 of the trials or 63 to 75 percent of the time), “Occasional Extenders” (extending on 3 or 4 of the trials or 38 to 50 percent of the time), or “Rare Extenders” (extending on 0–2 of the trials) for the Identical, Category, and Perceptual Matches, respectively. These divisions roughly match those used by Portzeba and colleagues (2015) to classify shape bias performance. Chi-square analyses were then performed to determine whether there were differences in the distributions of the two groups on property extension to each type of Match. Pearson Product Moment Correlation coefficients were calculated to investigate the relationship between performance on the Category Match, Identical Match, and Perceptual Match measures, and concurrent performance on the DAS and TACL-3 (i.e., nonverbal cognition and language, respectively). The relationships between earlier shape bias performance and current categorical induction (Category Match, Identical Match, Perceptual Match) were also examined using correlational analysis. Finally, the role of early language variables was examined via linear regression to determine whether shape bias performance and early language each independently contributed to induction performance.
Results
Results are organized around three central questions. First, do children with ASD perform similarly to TD peers when provided with a property of an object and asked to extend that property to new examples that share both a category and physical similarities, share only a category, or share only physical similarities to the given object? Second, is categorical induction performance related to concurrent language ability and/or concurrent nonverbal cognitive ability? Finally, does earlier shape bias performance and/or language ability predict categorical induction?
Group level performance
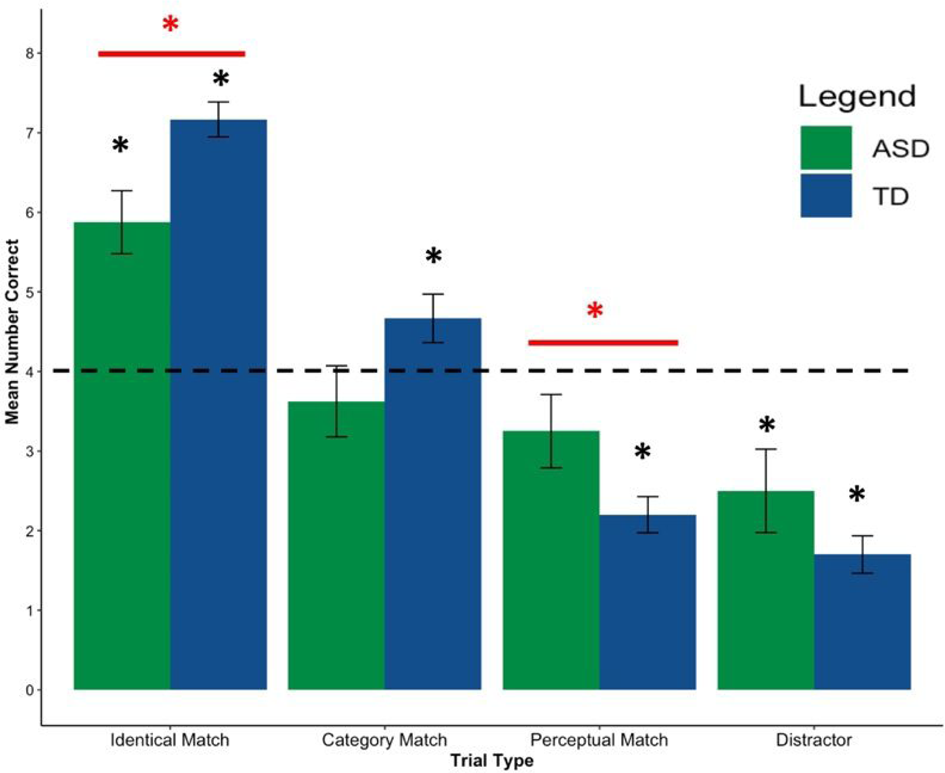
Group level results for property extension are presented in Figure 1. One sample t-tests revealed that with respect to extension of a novel property to the Identical Match, both TD (t(29)= 14.38, p<.001) and ASD (t(15) = 4.73, p<.001) groups performed above chance (i.e., 50%). A 3 x 2 mixed Repeated Measures ANOVA with Match Type (Identical, Category, Perceptual) and Group showed a main effect of Match Type (F(2,88) = 80.03, p<.001, Partial Eta Squared =.65), indicating that responses differed depending on what children were asked to extend the property to. A Group by Match Type interaction, indicating the Groups differed in their responses overall, was also observed (F(2,88) = 8.99, p<.001, Partial Eta Squared = .17). To further investigate the significant interaction, follow-up ANOVAs were conducted with concurrent vocabulary entered as a covariate.
Extension of properties to Identical, Category, Perceptual Matches, and Distractors across eight trials.
Mean property extensions for novel exemplars that shared a category label and perceptual similarity (Identical Match), category label (Category Match), and perceptual similarity (Perceptual Match) with the initial eight items. Both groups performed at levels differencing from chance for the Identical Match, while only the TD group performed differently from chance on the other two items. The TD group, in green, performed significantly more extensions than the ASD group for the Identical Match and the Category Match. The dotted black line indicates chance performance. A black star (*) indicates performance by that group on that trial type differed significantly from chance. Red lines and stars indicate the between groups comparison was significant. Stars of either color indicate significance at p<.05 level.

The TD group (M = 7.17, SD = 1.21) endorsed the extension of a property to Identical Matches significantly more often than the ASD group, (M = 5.88, SD = 1.59), controlling for the effect of concurrent vocabulary (F(1,43) = 7.42, p = .009, Partial Eta Squared = .147). The extension of a property to a Category Match was also higher in the TD group (M = 4.67, SD = 1.67) than the ASD group (M = 3.63, SD = 1.78); however, when controlling for concurrent vocabulary the group difference only approached significance (F(1,43) = 2.9 p = .096). A one sample t-test further showed that the children with ASD did not extend the category attribute at a level differing from chance (t(15) = −.84, p = .414) while the TD group endorsed the extension at a level that was significantly above chance (t(29) = 2.19, p = .037).
Finally, the ASD group (M = 3.25, SD = 1.84) extended properties significantly more often to the Perceptual Matches (i.e., those examples sharing only physical similarity with the original) than the TD group (M = 2.2, SD = 1.24), (F(1, 43) = 4.91, p = .032, Partial Eta Squared = .10). While the TD group extended based on perception at a level significantly below chance (t(29) = −7.93, p<.001), the ASD group's performance was not different from chance (t(15) = −1.63, p = .125). The ASD group (M = 2.5, SD = 2.09) also extended more properties to the Distractor than the TD group (M = 1.7, SD = 1.29), although the two groups did not differ significantly (F(1, 44) = 1.42, p = .241). Both groups endorsed extending to the Distractor at levels significantly below chance: TD group (t(30) = −9.76, p<.001); ASD group (t(15) = −2.86, p = .012).
As the groups differed on extensions to both the Identical Match and to the Category Match, we next compared the children's Category Match performance only for those trials in which the child also extended the property to the Identical Match. With this re-analysis, the TD group (M = 4.3, SD = 1.78) performed significantly more extensions to the Category Match than the ASD group (M = 3, SD = 1.55) (t(44) = 2.46, p = .018, Hedges’ g = 0.76). It is unlikely, then, that the source of the group difference in categorical induction is the group difference in extensions to the Identical Match.
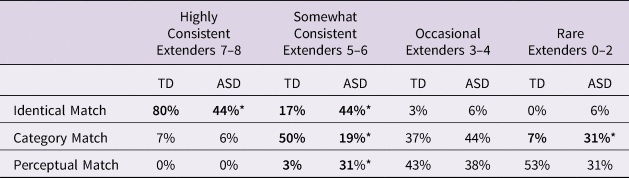
The previous analyses used children's extensions as the outcome variable. A secondary, descriptive analysis was performed to examine how stable were the children in the two groups as they extended properties in the different conditions. This performance stability, or consistency of induction across similar trials, also differed across groups. The findings for performance stability can be found in Table 5. For extension to the Identical Match, where extension should be high, Chi-square analyses showed that there were significant differences between the TD and ASD group for the distributions of Highly Consistent Extenders (χ2 = 6.24, p = .012, Cramer's V = .37) and Consistent Extenders (χ2 = 3.97, p = .046, Cramer's V = .29), with the majority of the TD group falling in the former group. For the Category Match items, where again extensions should be high, significant group differences were found for the Consistent Extenders (χ2 = 4.28, p = .039, Cramer's V = .31) and Rare Extenders (χ2 = 4.89, p = .027, Cramer's V = .33). More children in the TD group were Consistent Extenders while more children in the ASD group were Rare Extenders. For the Perceptual Match, where extension should be low, the two groups were significantly different in the numbers of Consistent Extenders (χ2 = 7.17, p = .007, Cramer's V = .39) with more children in the ASD group extending the property to the Perceptual Match.
Response Consistency for TD and ASD groups

Note: Percentage of each group who responded in a highly consistent, somewhat consistent, occasional, or rare manner on Identical Matches, Category Matches, and Perceptual Matches.
A star (*) and boldface indicates a significant difference at p<.05 level based on a Chi Square test.
Relationship to concurrent abilities
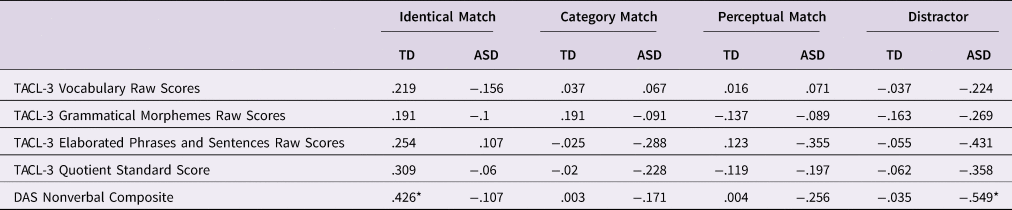
Correlations were used to examine the relationships between children's category match, identical, match, perceptual match, and distractor scores, concurrent nonverbal cognition as measured by the DAS Composite Score, concurrent language as measured by the overall TACL-3 score, autism severity assessed via the ADOS-2, and adaptive functioning as measured by the Vineland composite score. The resulting correlations are presented in Table 6. For the category match scores, no significant relationships emerged for either the TD group or the ASD group with respect to nonverbal cognition, TACL-3 quotient, autism severity, or adaptive functioning. Extending properties to the identical match was related to nonverbal cognitive ability in the TD group (r = .426, p = .019), but no such relationship was observed in the ASD group (r = −.107, p = .692). Extensions to the distractor were negatively correlated with nonverbal cognitive ability in the ASD group (r = −.549, p = .028) but were unrelated in the TD group (r = −.035, p = .855). Overall, then, extensions were not related to general language ability in either group.
Relationships between Property Extension and Concurrent Language Ability and Nonverbal Cognition

DAS = Differential Ability Scales; TACL 3 = Test for Auditory Comprehension of Language, 3rd edition. A * indicates significance at the p<.05 level.
Relationship to earlier abilities
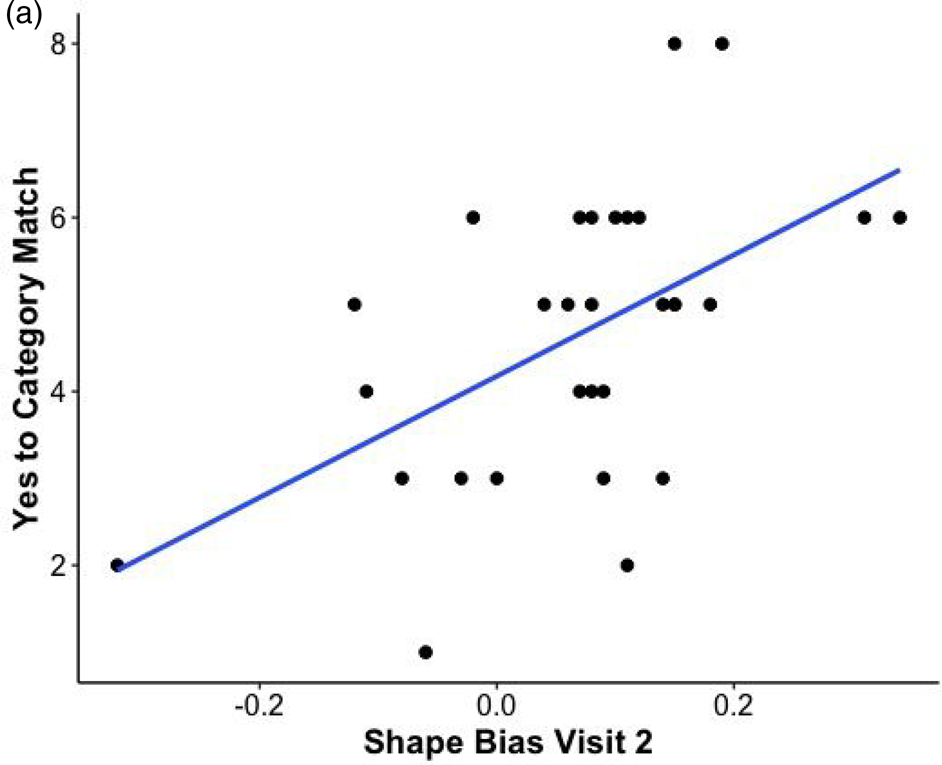
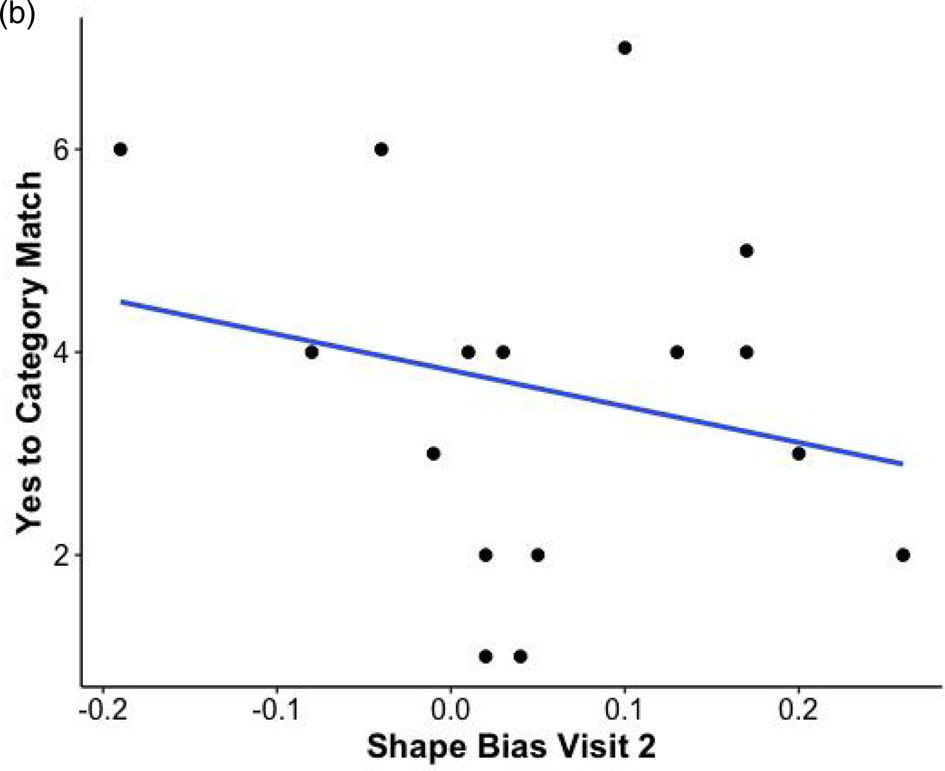
A significant positive relationship of moderate effect size was found between the strength of children's shape bias at visit 2 and their categorical induction performance at visit 3 within the TD group (r = .54, p = .002). This relationship did not approach significance within the ASD group (r = −.23, p = .39); these correlations differ significantly (z = 2.47, p = .007). Figures 2a and 2b display the scatterplots of these relationships. Shape bias at visit 2 did not predict extensions to Identical Matches for either group (TD r = .26; ASD r = −.19), or extensions to the Perceptual Match for either group (TD r = .19; ASD r = .18). We also calculated an alternate measure of categorical induction performance; a difference score of category extensions minus perceptual extensions was derived, on the conjecture that such a score would prioritize children who allowed category extensions but not perceptual extension. However, this score again yielded a significant positive relationship to the shape bias in the TD group (r = .38, p = .037) but not in the ASD group (r = −.47, p = .06; although a (negative) trend is apparent).
Relationship between Categorical Induction and Shape Bias for the TD group
Scatterplot displaying the relationship between shape bias performance at age 2 and extensions of properties to novel exemplars sharing a category label at age 5 for the typically developing group. The graph shows the significant positive relationship between performance on these two tasks (r = .537, p = .002).

Relationship between Categorical Induction and Shape Bias for the ASD group
Scatterplot displaying the relationship between shape bias performance at age 3 and extensions of properties to novel exemplars sharing a category label at age 6 for the children with ADS. The graph illustrates the lack of relationship between performance on these two tasks (r = −.228, p = .396).

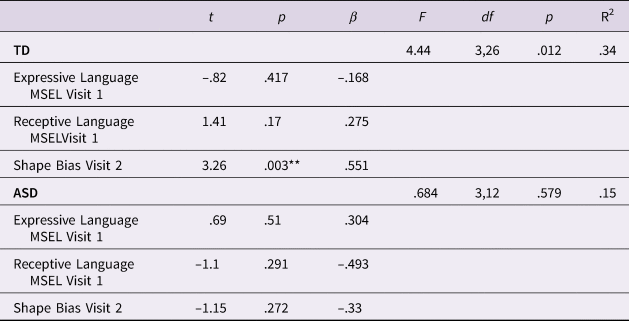
A multiple linear regression revealed that neither Visit 1 expressive language nor receptive language as measured by the Mullen Scales of Early Learning raw scores predicted categorical induction at Visit 3 for either group, while the TD children's shape bias scores at Visit 2 continued to account for significant variance. The results of the multiple regression analyses can be found in Table 7.
Results of the Linear Regression for Categorical Induction

Note: MSEL = Mullen Scales of Early Learning, Raw Scores
Discussion
Categories play a critical role in everyday life as they aid in the generalization of knowledge. Categories support induction, which is the transfer of properties from one category member to another, which in turn reduces memory load (Gastgeb et al., Reference Gastgeb, Strauss and Minshew2006; Klinger & Dawson, Reference Klinger and Dawson2001) and aids learning (Brandone, Reference Brandone2017). This study investigated the ability of children with ASD and TD children to extend properties based on category membership to novel category members. We further examined whether their shape bias performance, measured approximately three years earlier, was predictive of their categorical induction performance. Consistent with numerous other reports, the TD children in this study performed above chance – although not perfectly – on extending properties to category matches whereas the children with ASD performed at chance, and significantly more poorly than the TD group. This contrast between groups remained even when we controlled for differences in their concurrent language ability, and in their general tendency to extend. Moreover, while both groups included the same percentage of highly consistent extenders (i.e., those who extended properties on seven or eight of the eight trials), the TD group was comprised of more ‘somewhat consistent’ extenders (extending on five or six trials) and very few ‘rare’ extenders (extending on less than two trials), while the ASD group contained more ‘rare’ extenders and fewer ‘somewhat consistent’ extenders.
Relationships with concurrent measures of nonverbal IQ, language, ASD characteristics, and adaptive behavior were not significant for either group, indicating that, for these children at this point in development, their categorical induction abilities were not primarily dependent upon either verbal or nonverbal skills, nor were their ASD severity or adaptive skills meaningfully contributing to performance. However, one longitudinal predictor was significantly associated with categorical induction. Specifically, for TD children the strength of their shape bias at age two was positively predictive of their categorical induction ability at age five, with a moderate effect size. Although different in both procedure and tasks, performance in these areas is related in typical development, hinting at a common underlying skill. Interestingly, early general language did not make an independent contribution for the TD children, indicating that the strength of the shape bias was not reducible to overall language ability. Finally, no significant relationships were observed for the ASD group. In what follows, we discuss these findings with respect to our original questions about category differences in children with ASD and developmental precursors to categorical induction.
Group level induction performance – categories are different in ASD
Group performance highlighted both similarities and difference between TD and ASD groups. Performance was comparable insofar as neither the TD group nor the ASD group used perceptual similarity alone as a basis for induction. Although the ASD group endorsed more extensions to the Perceptual Match than the TD group, their inductions remained at chance levels, indicating the absence of an overall strategy that privileges perceptual similarity. If perceptual information alone had been a strong basis for induction, we would have expected more extensions to Perceptual Matches. Furthermore, both groups extended more often to the Identical match for which there was both category membership and perceptual similarity, indicating sensitivity to multiple converging cues. In this condition, the label and perceptual information aligned, doubling the support for the induction, as the child could be using either the category name or perceptual information or both to inform extension. Importantly, this condition offers no conflicting or competing cues; the absence of these has been shown to facilitate inference making in young children (Gelman & Markman, Reference Gelman and Markman1986, Reference Gelman and Markman1987).
The groups differed, however, when the basis for induction was the category label alone, with the TD group endorsing overall more property extensions to the Category Match, and significantly more when Identical Match scores were controlled. Fewer children with ASD accepted category membership alone as a basis of induction, replicating prior findings of induction difficulties in children with ASD (Kelley et al., Reference Kelley, Paul, Fein and Naigles2006; Naigles et al., Reference Naigles, Kelley, Troyb and Fein2013). Although this was a yes/no task, this pattern of results, consistent with previous studies, does not support the idea that children were answering with either a ‘yes’ or ‘no’ bias (Gelman & Markman, Reference Gelman and Markman1986, Reference Gelman and Markman1987). For TD children, category membership of an object appeared predictive of which properties individual members were likely to have, allowing them to generalize about a particular exemplar without having to directly experience all of its properties. Children with ASD, on the other hand, were much less inclined to extend a property only on the basis of shared category membership. Interestingly, these difficulties do not appear to be part of an overall problem with generalization, because many children with ASD (including the children in this study assessed via different tasks) demonstrate the ability to generalize syntactic patterns (Naigles, Kelty, Jaffery & Fein, Reference Naigles, Kelty, Jaffery and Fein2011; Naigles & Fein, Reference Naigles, Fein and Naigles2017) and to align syntactically during conversation (Hopkins, Yuill & Keller, Reference Hopkins, Yuill and Keller2016; Allen, Haywood, Rajendran & Branigan, Reference Allen, Haywood, Rajendran and Branigan2011). Rather, this reluctance to generalize seems specific to semantics. Other differences with semantic organization have been noted in ASD, such as semantic similarity of nouns not aiding memory (Tager-Flusberg, Reference Tager-Flusberg1991) and naming more atypical category members (Dunn, Gomes & Sebastian, Reference Dunn, Gomes and Sebastian1996). Differences in category stability and processing have also been observed (Ellawadi et al., Reference Ellawadi, Fein and Naigles2017; Gastgeb et al., Reference Gastgeb, Strauss and Minshew2006), primarily with atypical examples of a category as well as prototype formation (Church, Krauss, Lopata, Toomey, Thomeer, Coutinho, Volker & Mercado, Reference Church, Krauss, Lopata, Toomey, Thomeer, Coutinho, Volker and Mercado2010; Plaisted, Reference Plaisted, Baron-Cohen, Tager-Flusberg and Dohen2000; Klinger & Dawson, Reference Klinger and Dawson2001). Semantic information thus appears to be both collected and organized differently in ASD, with less emphasis on commonalities and greater awareness of differences that is not constrained to perceptual information alone. Findings that the induction effects were not correlated with overall vocabulary size or language performance on standardized tests further points to a difference rather than a developmental lag.
These findings tell us that property extension does not rely primarily on perceptual similarity for either the TD or ASD groups (in contrast to Sloutsky & Fisher, Reference Sloutsky and Fisher2004), and that the category label is under-utilized in the ASD group. The former effect indicates that neither group is making decisions only on shared perceptual traits. The latter difference raises further questions about category awareness in ASD. Why was the ASD group less likely to perform induction on the basis of a shared category membership? One possibility is that their hesitation to infer might arise from oversensitivity to differences rather than commonalities. A category is helpful because it is an aid to quick thinking; the similarities between individual category members become highlighted while differences are minimized, allowing for the generalization of knowledge. While categories lack 100% similarity, TD children and adults appear to better tolerate exceptions (Brandone, Gelman & Hedglen, Reference Brandone, Gelman and Hedglen2015). The focus on exemplar differences could result in children with ASD being hesitant to judge new non-identical category members as having properties similar to other members. This is not rooted in a misunderstanding of the categories, however, as classification of objects into categories remains typical (Gastgeb et al., Reference Gastgeb, Strauss and Minshew2006; Tager-Flusberg, Reference Tager-Flusberg1991). Rather, while the similarities within a category are recognized and used in classification they do not seem to be used for induction.
It has been well-documented that individuals with ASD have heightened visual discriminatory abilities: for example, children with ASD are better at finding embedded figures, copying impossible designs and visual searches than their TD peers (see Mottron, Dawson, Soulières, Hubert & Burack Reference Mottron, Dawson, Soulières, Hubert and Burack2006). Plaisted (Reference Plaisted, Burack, Charman, Yirmiya and Zelazo2001) proffers that differences in categorization are attributable to these perceptual differences, suggesting that these abilities may lead them to perceive more differences between items thereby impairing generalization. In categorical induction, though, the label functions to highlight the similarity between category members, enabling the downplaying of differences. If children with ASD do perceive differences in the exemplars of a category more acutely, then they would need the labels to carry relatively more weight than they do for TD individuals. Perhaps this may be the basis for their inconsistent inductions: sometimes the label is able to outweigh enhanced perceptual sensitivity, and sometimes it is not. The degree to which this variable deployment of the label by children with ASD may be affected by visual specifics of the items vs. familiarity with labels (see Abdel-Aziz et al., Reference Abdel-Aziz, Kover, Wagner and Naigles2018 for one suggestion, and Tovar, Rodriguez-Granados & Arias-Trejo, Reference Tovar, Rodríguez-Granados and Arias-Trejo2020, for a relevant computer simulation) might be a fruitful direction for future research.
Developmental trajectories and shape bias as precursory skill
For TD children, extending labels by shape and extending properties by category are both well-attested, but this study has demonstrated for the first time that these processes are developmentally connected. Both the shape bias and use of category labels during induction are important reasoning skills that aid in generalization. They differ in that the shape bias operates with respect to a salient perceptual property while the use of the category label in induction concerns non-obvious properties attributable to the category. What links the two may be the ease with which children can pick up on patterns of generalization in general, especially those that involve object labels and object properties. What we conjecture is that the children who were quicker to learn that objects sharing the same label mostly have the same shape were also the first to pick up on the fact that objects sharing a label mostly have the same properties, including non-obvious ones.
The shape bias thus seems to be a supporting skill for categorical induction, as those toddlers who had stronger shape biases at the age of two subsequently became five-year-olds who had better categorical induction skills. This finding is consistent with other recent reports that have documented links between early implicit eye gaze language assessments, such as Head-turn Preference Procedure (Newman, Ratner, Jusczyk, Jusczyk & Dow, Reference Newman, Ratner, Jusczyk, Jusczyk and Dow2006), Looking While Listening (e.g., Fernald & Marchman, Reference Fernald and Marchman2012), and IPL (e.g., Naigles et al., Reference Naigles, Kelty, Jaffery and Fein2011), and later language. Our findings are also an important extension of numerous findings showing links between early and later standardized tests (most recently Brinchmann, Braeken & Lyster, Reference Brinchmann, Braeken and Lyster2019), now with a psycholinguistic task – categorical induction – as the outcome. While standardized tests have been designed to categorize individuals on macro level skills (e.g., IQ, language) they are not finely honed on particular skills. Thus, the linkage of two highly targeted behavioral tests offers insight into a common developmental story for TD children.
We suggest that this shape bias-categorical induction relationship highlights a common, underlying strategy for organizing semantic information that is emerging in TD children. Moreover, we suggest that this strategy is specific to lexical semantics because shape bias performance has not been found to correlate with other language skills that we measured at visit 3, including morphosyntax and argument structure (Naigles & Piskin, Reference Ellawadi, Fein and Naigles2017; Tecoulesco et al., 2019). This indicates that categorical induction and the shape bias share a common mechanism in typical development. Our data do not mandate that the shape bias is a necessary developmental precursor to categorical induction, at least partly because categorical induction- like abilities – and shape bias-like abilities – have been observed in infants (Dewar & Xu, Reference Dewar and Xu2009). Whether or not one skill is developmentally prior or if they emerge together still remains to be investigated; however, they appear to be connected in typical development, over and above general language abilities.
In the shape bias, shape and label are linked and assist in the identification of further examples of the label. Perhaps the shape bias could be interpreted an as early type of implicit categorical induction, in which category members, indicated by a common name, are expected to share a common shape. Shape is the most salient property of many solid objects, has the most direct implications for function in many cases, and one that probably varies the least across multiple exemplars (i.e., cats may be of different colors, cups may be of different sizes or materials). The common name serves as the link to common attributes. And while shape may not remain the most salient of an object's properties, the common implicit strategy to organize by name remains. In categorical induction, the label allows for the rapid extension of characteristics independent of weighing whether or not any particular category member would have the trait. Thus, we suggest that one reason that shape bias and categorical induction abilities are connected in TD children is because, in both of these, the label serves as an organizing factor, as an invitation to form categories (Waxman & Markow, Reference Waxman and Markow1995).
In the children with ASD, this connection was not observed. Furthermore, the absence of such a connection cannot be attributable to reduced variability in either ability, as the variances for both the shape bias and categorical induction measures were comparable in the TD and ASD groups (Tables 2 and 3, Figure 2). The absence of this significant connection, therefore, raises the possibility that the developmental trajectory of word and category learning in children with ASD is different from that of TD children. On the one hand, the shape bias is not consistently observed in children with ASD. It does not seem to be the case that the shape similarity itself is not recognized (see Potrzeba et al., Reference Potrzeba, Fein and Naigles2015 for details); rather, it is that the shape does not seem to be linked to the label, and thus the label lacks power. As vocabulary development does occur, and categories do form, it is unlikely that children with ASD are unaware of physical similarities between objects in the same category. Moreover, children with ASD do demonstrate some ability to correctly classify objects into categories, exhibiting that category structure is known (Ellawadi et al., Reference Ellawadi, Fein and Naigles2017). But, in tasks calling for categorical induction of properties, no consistent strategy is seen that uses category similarity; instead, the differences dominate. In a nutshell, we conjecture that the lack of a shape bias in ASD, coupled with their inconsistent categorical inductions, suggests that shape similarities are observed, and categories are created, but, unlike in the TD case, the labels are not the primary means by which these processes are facilitated.
Limitations
Several limitations to this study must be acknowledged. First, the sample size was relatively small, providing less statistical power for finer grained analysis, especially in the ASD group. Also, these results reflect the performance of the children with ASD who demonstrated the verbal ability needed to complete the categorical induction task. While the group was not homogenous, it did not include any individuals unable to perform the task thus limiting generalizability to the ASD population as a whole. As in any study with individuals with ASD, we cannot insure uninterrupted attention on the part of the children. Lack of sustained attention, focus on detail, and overselective attention (Ploog, Reference Ploog2010) during the categorical induction task have the potential to have influenced performance. The fact that no significant relationship was found between nonverbal cognitive abilities and performance on the categorical induction task reduced the likelihood, though, that categorical induction performance was simply a result of attention resources or other executive function skills.
A further limitation might be that performance on the IPL shape bias task might not accurately reflect peak shape bias ability in the children with ASD. The particular visit was chosen as the source of the shape bias scores because it was the last visit in which the TD children were assessed on shape bias, and thus depicted their strongest performance. Over the course of one year, both groups had seen the shape bias video the same number of times, and the TD children had shown a steady increase in shape bias, with no regression. The ASD group, on the other hand, showed variable performance (with no linear increase) over the same timeframe, as there were children who showed a shape bias at one time, but not several months later. Thus, the shape bias scores in the current study may not represent the peak of every child's shape bias performance (see Potrzeba et al., Reference Potrzeba, Fein and Naigles2015. for more discussion). On the other hand, this hit or miss performance does indicate the absence of a consistent shape bias, and shape bias performance at the visit we targeted has been found to be related to other individual differences in the ASD group (Abdel-Aziz et al., Reference Abdel-Aziz, Kover, Wagner and Naigles2018).
A final point is that the IPL task did necessitate our use of 2-dimensional visual stimuli, as well as a color foil rather than a texture one; both of these differ from some canonical formats of the shape bias task (Landau et al., Reference Landau, Smith and Jones1988, passim). However, others have used both successfully, even with younger TD infants (Keates & Graham, Reference Keates and Graham2008). Moreover, an earlier report of our shape bias findings compared 2-dimensional and 3-dimensional stimulus presentation, and reported similar success in the TD group and difficulties in the ASD group, across stimulus types (Tek et al., Reference Tek, Jaffery, Fein and Naigles2008).
Conclusion
The TD children in our study, who more consistently expected objects sharing a label to be similarly shaped, three years later more consistently expected examples belonging to the same labelled category to share features. Thus, the TD children showed developmental consistency in their expectations of how objects relate and also how labels function. At the age range tested, categorical induction was not related to concurrent language performance; thus, the tendency to extend properties based on category membership held across a wide range of language abilities. In the ASD group there was less consistent categorical induction overall, and there was no evidence of a relationship between an early shape bias and later categorical induction. In ASD, thus, we may see an alternative language trajectory that may not limit overall semantic and syntactic acquisition but does appear to affect semantic organization. The alternative trajectory seems to revolve around differences in what is expected of word referents. Possibly, an over focus on differences in real world examples leads to an underutilization of labels as predictors of properties. Further research is needed to illuminate how perceptual processing and word usage inform this difference.
Acknowledgements
We thank all of the children and their families who participated in this research, as well as Iris Chin, Devin Rubin, Caitlyn Reynolds, and Christian Navarro-Torres for their exemplary data collection at Visit 3. Thanks are also due to the members of the UConn Child Language
Lab for their assistance in data collection and coding of the shape bias task. We also appreciate the helpful feedback we received from attendants of INSAR 2018 in Rotterdam. This grant was funded by the National Institute on Deafness and Other Communication Disorders: NIHDCD, R01 DC07428.