1 Background
In the 1970s, researchers observed ‘vortex wandering’ (also referred to as meandering) in wind-tunnel experiments which, through coherent side-to-side motion, effectively concealed pertinent characteristics of the measured core of the trailing vortex (Corsiglia, Schwind & Chigier Reference Corsiglia, Schwind and Chigier1973; Baker et al. Reference Baker, Barker, Bofah and Saffman1974). Although this phenomenon has been observed in experiments for decades, the underlying mechanism that causes the wandering remains uncertain. Despite this, the effects of wandering can be accounted for (Devenport et al. Reference Devenport, Rife, Liapis and Follin1996); most pertinent for the present study is the method by Heyes, Jones & Smith (Reference Heyes, Jones and Smith2004), which removes wandering directly using particle image velocimetry (PIV). This method shifts the instantaneous vortex to collocate with the mean vortex centre position, directly removing the effect of wandering while retaining the instantaneous velocity field and its random fluctuations within the vortex core.
Many researchers speculate that wandering is a consequence of either the wind-tunnel environment (Corsiglia et al. Reference Corsiglia, Schwind and Chigier1973; Beresh, Henfling & Spillers Reference Beresh, Henfling and Spillers2010) or a vortex instability (Rokhsaz, Foster & Miller Reference Rokhsaz, Foster and Miller2000; Jacquin et al. Reference Jacquin, Fabre, Geffroy and Coustols2001). Wandering persists at zero angle of attack, indicating that it occurs despite the presence of a vortex (Baker et al. Reference Baker, Barker, Bofah and Saffman1974), which may suggest that the motion is independent of the vortex itself and may be a result of the wind-tunnel environment. Conversely, there is an increase in the amplitude of the vortex wandering with downstream position (Devenport et al. Reference Devenport, Rife, Liapis and Follin1996), potentially indicating an instability mechanism. Jacquin et al. (Reference Jacquin, Fabre, Geffroy and Coustols2001) found that the wandering is unaffected by the wind-tunnel walls, and the frequencies of vortex instabilities found in the literature match well with the frequencies of the wandering. Through a stochastic forcing of a Lamb–Oseen vortex, Fontane, Brancher & Fabre (Reference Fontane, Brancher and Fabre2008) found a long-wavelength helical mode to cause ‘global translation’ of the vortex consistent with wandering. Despite the arguments on each side, removing the effects of wandering without certainty of its origin is precarious, as one may disregard pertinent dynamics of the flow field.
The purpose of the present study is to further examine the hypothesis that vortex wandering is due to a vortex instability. Using stereoscopic particle image velocimetry (SPIV) data (Deem et al. Reference Deem, Edstrand, Reger, Pascioni and Cattafesta2013), an approach is developed to extract the coherent wandering motion. This motion is discerned through a triple decomposition (Reynolds & Hussain Reference Reynolds and Hussain1972) of the SPIV data, and the most energetic structures are determined through the proper orthogonal decomposition (POD) (Sirovich Reference Sirovich1987). We then fit a canonical Batchelor vortex to the mean experimental data, and perform a spatial stability analysis on the resulting base flow field. The results show a strikingly similar spatial structure between the leading POD mode and the primary stability mode of the Batchelor vortex. Based on this similarity, coupled with the measured growth in kinetic energy, we propose wandering as a vortex instability rather than purely an artefact of the wind-tunnel environment.
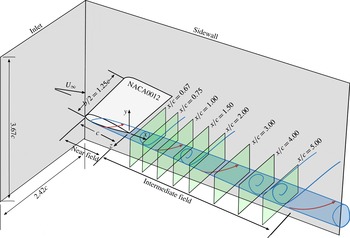
Schematic of the trailing vortex and coordinate system (
 $x$
streamwise,
 $y$
vertical,
 $z$
spanwise directions). The blue cone denotes the area of the vortex core, while the green planes represent the areas of available SPIV data. The grey regions represent the inlet and sidewalls. The wing chord is
 $c=304.8~\text{mm}$
.

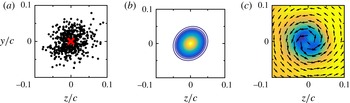
The instantaneous vortex centres from the experimentally obtained vortex centres are shown in (a). The red
 $\times$
in (a) denotes the mean vortex location, and the computed correlation coefficient is
 ${\it\rho}=0.24$
. The equivalent Gaussian j.p.d.f. is shown in (b). The wandering-corrected mean flow field,
 $\overline{\hat{\boldsymbol{u}}}$
, is shown in (c), with the contours of
 $\overline{u}/U_{\infty }$
displayed between 0.9 and 1. The quiver plot in (c) shows the in-plane velocities. All correspond to the
 $x/c=5$
downstream location.

2 Methodology
2.1 Experimental set-up
The trailing vortex was generated by a 304.8 mm chord NACA0012 airfoil with a half-aspect-ratio of 1.25, a rectangular wingtip, and positioned at an angle of attack of
 $5^{\circ }$
. Results reported herein are non-dimensionalized by the free-stream velocity
 $U_{\infty }$
and chord
 $c$
for a chord-based Reynolds number of
 $Re_{c}\equiv U_{\infty }c/{\it\nu}_{\infty }=530\,000$
, where
 ${\it\nu}_{\infty }$
is the free-stream kinematic viscosity. Experimental measurements were acquired in the University of Florida Anechoic Flow Facility (Mathew et al.
Reference Mathew, Bahr, Sheplak, Carroll and Cattafesta2005), a
 $1.12~\text{m}\times 0.74~\text{m}$
open-jet wind tunnel installed inside a semi-anechoic chamber. Owing to the open-jet nature of the facility, the wandering effects may be further exacerbated by the shear layers on three of the four sides when compared with conventional wind tunnels with rigid tunnel walls. However, we expect minimal differences between open and closed-wall settings as the wind-tunnel blockage is less than 1.5 % with a thin streamlined body at a small angle of attack. We performed SPIV measurements perpendicular to the free stream from
 $x/c=0.67$
to 5 on eight measurement planes, as shown in figure 1. Here,
 $x$
denotes the streamwise direction and
 $c$
is the chord of the airfoil. These measurements focused on the vortex core, which contained the trailing-edge wake of the wing up to
 $x/c\approx 3$
, after which the wake exited the measurement plane due to downwash. Details of the experimental set-up are provided in Deem et al. (Reference Deem, Edstrand, Reger, Pascioni and Cattafesta2013). The instantaneous vortex centres, as shown in figure 2(a), and the fitted Gaussian joint probability density function (j.p.d.f.), shown in figure 2(b), demonstrate that wandering is present and significant. The j.p.d.f. contains a slight correlation between the
 $y$
- and
 $z$
-motion, corresponding to a correlation coefficient of
 ${\it\rho}=0.24$
. After collocating the instantaneous vortex cores, the mean flow field at
 $x/c=5$
is shown in figure 2(c).
2.2 Triple decomposition
A triple decomposition (Reynolds & Hussain Reference Reynolds and Hussain1972) is employed to extract the coherent wandering motion from the SPIV data. To this end, for each SPIV snapshot, the vortex centres are collocated by linearly shifting the instantaneous core positions,
 $\boldsymbol{x}_{c}(t_{k})$
, to the mean vortex axis, shown as a red
 $\times$
in figure 2(a). This results in the wandering-corrected instantaneous flow field,
 $\hat{\boldsymbol{u}}(\boldsymbol{x}-\boldsymbol{x}_{\boldsymbol{c}}(t_{k}),t_{k})$
, where the image is shifted by
 $\boldsymbol{x}_{\boldsymbol{c}}(t_{k})$
. The wandering-corrected mean flow field
 $\bar{\hat{\boldsymbol{u}}}$
, see figure 2(c), is then obtained by averaging the snapshots in time according to
 $$\begin{eqnarray}\bar{\hat{\boldsymbol{u}}}(\boldsymbol{x})=\frac{1}{N}\mathop{\sum }_{k=1}^{N}\hat{\boldsymbol{u}}(\boldsymbol{x}-\boldsymbol{x}_{\boldsymbol{ c}}(t_{k}),t_{k}).\end{eqnarray}$$
We obtain the velocity fluctuations devoid of wandering,
 $\boldsymbol{u}^{\prime }$
, for each snapshot by subtracting the wandering-corrected mean as
 $$\begin{eqnarray}\boldsymbol{u}^{\prime }(\boldsymbol{x},t_{k})=\hat{\boldsymbol{u}}(\boldsymbol{x}-\boldsymbol{x}_{\boldsymbol{c}}(t_{k}),t_{k})-\bar{\hat{\boldsymbol{u}}}(\boldsymbol{x}).\end{eqnarray}$$
We then assume vortex wandering to be the consequence of a coherent motion, and by using the triple decomposition of Reynolds & Hussain (Reference Reynolds and Hussain1972), the instantaneous flow field is decomposed into mean, coherent and random components, given by
 $$\begin{eqnarray}\boldsymbol{u}(\boldsymbol{x},t_{k})=\bar{\boldsymbol{u}}(\boldsymbol{x})+\tilde{\boldsymbol{u}}(\boldsymbol{x},t_{k})+\boldsymbol{u}^{\prime }(\boldsymbol{x},t_{k}).\end{eqnarray}$$
For the SPIV data,
 $\boldsymbol{u}$
represents the instantaneous measured velocity field,
 $\bar{\boldsymbol{u}}$
denotes the time-averaged velocity field with the effects of wandering,
 $\tilde{\boldsymbol{u}}$
is the coherent wandering velocity field and
 $\boldsymbol{u}^{\prime }$
is the random perturbation obtained from (2.2). It is straightforward to solve for
 $\tilde{\boldsymbol{u}}$
using (2.3) and (2.2) to obtain
 $$\begin{eqnarray}\tilde{\boldsymbol{u}}(\boldsymbol{x},t_{k})=[\boldsymbol{u}(\boldsymbol{x},t_{k})-\bar{\boldsymbol{u}}(\boldsymbol{x})]-[\hat{\boldsymbol{u}}(\boldsymbol{x},t_{k})-\bar{\hat{\boldsymbol{u}}}(\boldsymbol{x})],\end{eqnarray}$$
where the first bracketed term contains the coherent wandering motion and background turbulence, while the second bracketed term removes the turbulence. The resulting velocity field,
 $\tilde{\boldsymbol{u}}(\boldsymbol{x},t_{k})$
, describes the coherent wandering motion. From these snapshots, the most energetic structures of the coherent portion are extracted via the POD (Sirovich Reference Sirovich1987).
2.3 Batchelor-vortex model
For comparison of the experimental results with a canonical vortex base flow, the Batchelor vortex (Batchelor Reference Batchelor1964) is fitted to the computed mean flow,
 $$\begin{eqnarray}V_{x}=1-{\it\gamma}\exp \left(-\frac{r^{2}}{{\it\delta}^{2}}\right),\quad V_{r}=0,\quad V_{{\it\theta}}=\frac{{\it\kappa}}{r}\left[1-\exp \left(-\frac{r^{2}}{{\it\delta}^{2}}\right)\right],\end{eqnarray}$$
originally developed as a model for trailing vortices. In the above expression,
 ${\it\kappa}$
represents the swirl parameter,
 ${\it\delta}$
is the core radius and
 ${\it\gamma}$
denotes the axial velocity deficit at
 $r=0$
. To fit (2.5) to the experimental data, the mean velocity field at
 $x/c=5$
,
 $\overline{\boldsymbol{u}}$
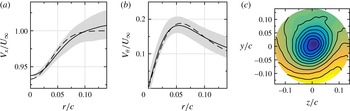
, is azimuthally averaged (see figure 3
c) and curve fitted using a nonlinear least-squares method. The resulting fit is shown in figure 3(a,b) with the non-dimensional parameters
 ${\it\kappa}=0.0152$
,
 ${\it\delta}={\it\delta}^{\ast }/c=0.0514$
and
 ${\it\gamma}=0.0671$
. All parameters and equations have been non-dimensionalized by the chord,
 $c=0.3048~\text{m}$
, and the free-stream velocity,
 $U_{\infty }=28.5~\text{m}~\text{s}^{-1}$
. These values correspond to the non-dimensional swirl parameter of
 $q={\it\kappa}/({\it\delta}{\it\gamma})=4.41$
of a
 $q$
-vortex. These parameters correspond to a Reynolds number based on the core radius of
 $Re_{{\it\delta}^{\ast }}=Re_{c}{\it\delta}=27\,200$
. Averaging over the azimuth, excluding the trailing-edge wake, shows that the fitting parameters are rather insensitive to the averaging region; the swirl
 ${\it\kappa}$
has been found to be the most sensitive parameter, varying by 11.5 %. These variations, however, have negligible impact on the stability results.
Velocity profiles from experimental data for (a) the streamwise velocity and (b) the azimuthal velocity. The azimuthal average of the velocities is shown by the solid line, with the shaded area representing the maximum azimuthal variation. Using this mean flow field, the Batchelor vortex is fitted using a least-squares method, shown by the dashed line. The contours in (c) show the mean streamwise velocity,
 $\overline{u}$
, without wandering correction used for the Batchelor fit, whose parameters are
 ${\it\kappa}=0.0152$
,
 ${\it\delta}=0.0514$
and
 ${\it\gamma}=0.0671$
, which correspond to a swirl parameter of
 $q=4.39$
.

2.4 Linear stability analysis
The governing equations for infinitesimal disturbances are given by
 $$\begin{eqnarray}\left.\begin{array}{@{}c@{}}\boldsymbol{{\rm\nabla}}\boldsymbol{\cdot }\tilde{\boldsymbol{u}}=0,\\ \displaystyle \frac{\partial \tilde{\boldsymbol{u}}}{\partial t}+\overline{\boldsymbol{u}}\boldsymbol{\cdot }\boldsymbol{{\rm\nabla}}\tilde{\boldsymbol{u}}+\tilde{\boldsymbol{u}}\boldsymbol{\cdot }\boldsymbol{{\rm\nabla}}\overline{\boldsymbol{u}}=-\boldsymbol{{\rm\nabla}}\tilde{p}+\frac{1}{Re_{c}}{\rm\nabla}^{2}\tilde{\boldsymbol{u}},\end{array}\right\}\end{eqnarray}$$
where
 $\tilde{\boldsymbol{u}}=[\tilde{v}_{x},\tilde{v}_{r},\tilde{v}_{{\it\theta}}]^{\text{T}}$
denotes the disturbance velocity field,
 $\overline{\boldsymbol{u}}=[V_{x},V_{r},V_{{\it\theta}}]^{\text{T}}$
is the base velocity field and
 $\tilde{p}$
represents the disturbance pressure. The experimentally measured vortex as well as the Batchelor vortex vary slowly with downstream progression, making streamwise variations higher order in nature. As such, we employ the parallel approximation and assume wave-like disturbances of the form
 $\tilde{\boldsymbol{q}}(x,r,{\it\theta},t)=\boldsymbol{q}(r)\exp (\text{i}{\it\alpha}x+\text{i}m{\it\theta}-\text{i}{\it\omega}t)$
, while neglecting streamwise gradients in the base flow. Here,
 ${\it\alpha}\in \mathbb{C}$
is the streamwise wavenumber,
 $m$
is the azimuthal wavenumber and
 ${\it\omega}\in \mathbb{R}$
is the radian frequency. We perform a spatial stability analysis, which yields a nonlinear eigenvalue problem which is linearized by employing the companion matrix method (Schmid & Henningson Reference Schmid and Henningson2001). This results in the generalized eigenvalue problem of the form
 $$\begin{eqnarray}\unicode[STIX]{x1D63C}\boldsymbol{q}_{\boldsymbol{\ast }}={\it\alpha}\unicode[STIX]{x1D63D}\boldsymbol{q}_{\boldsymbol{\ast }},\end{eqnarray}$$
where
 $\boldsymbol{q}_{\boldsymbol{\ast }}=[v_{x},v_{r},v_{{\it\theta}},p,{\it\alpha}v_{r},{\it\alpha}v_{{\it\theta}}]^{\text{T}}$
is the shape function of the perturbation, while
 $\unicode[STIX]{x1D63C}$
and
 $\unicode[STIX]{x1D63D}$
are the stability matrices, omitted for brevity (see, e.g. Paredes Reference Paredes2014). The coefficient matrices
 $\unicode[STIX]{x1D63C}$
and
 $\unicode[STIX]{x1D63D}$
are discretized using a Chebyshev spectral collocation method, and treatment of the centreline singularity arising from the cylindrical coordinates is handled through the method of Mohseni & Colonius (Reference Mohseni and Colonius2000). The disturbance is evaluated on a mapped Gauss–Lobatto grid for
 $r/{\it\delta}\in (0,100]$
(Hein & Theofilis Reference Hein and Theofilis2004), where Dirichlet boundary conditions are enforced at the computational boundary, forcing the disturbances to become zero in the far field. The current formulation has been validated with the Batchelor-vortex results of Paredes (Reference Paredes2014).
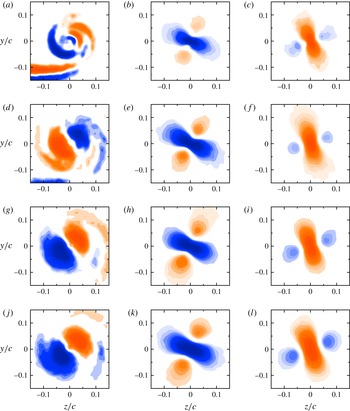
Leading POD mode for
 $\tilde{u}$
,
 $\tilde{v}$
and
 $\tilde{w}$
shown in (a,d,g,j), (b,e,h,k) and (c,f,i,l) respectively; (a,b,c), (d,e,f), (g,h,i) and (j,k,l) correspond to the downstream distances
 $x/c=1,2,3$
and 4 respectively.

3 Results
Figure 4 illustrates the leading POD mode as it progresses downstream. Upstream of
 $x/c=1$
(not shown), the streamwise velocity (a,d,g,j) demonstrates how the eventual helical mode forms in the presence of the trailing-edge wake. The existence of the wake component implies a coupling between the vortex and wake, underlining that, especially at the upstream locations, both the trailing-edge wake and the vortex are necessary to accurately capture the streamwise velocity of these modes. With downstream progression, the downwash from the vortex separates the trailing-edge wake from the vortex. This separation consequently diminishes the coupling and isolates the vortex, which develops into a classical helical pattern.
Figures 4(b,e,h,k) and 4(c,f,i,l) show the transverse velocities. An important characteristic is that these velocities support a non-zero magnitude at the vortex centreline, serving to perturb the vortex core by radially displacing it. This leads to the observed wandering motion. This particular mode paired with the POD mode 2 rotates in time; however, the direction of rotation remains undetermined due to insufficient temporal resolution. Therefore, we simply denote the azimuthal wavenumber by its magnitude as
 $|m|=1$
. The trailing-edge wake is absent in the transverse velocities of these modes, indicating that the small transverse velocity gradients in the wake are insignificant towards the coherent wandering motion. The structure of these modes is maintained with downstream progression; only growth as a consequence of viscous diffusion of the trailing vortex flow field is observed.
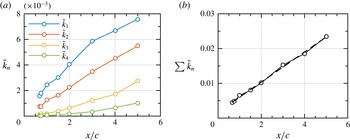
Figure 5(a) shows the kinetic energy of the first four POD modes as they progress downstream. All modes monotonically increase, with the modes maintaining their general structure throughout. The dominant two modes are paired helical
 $|m|=1$
modes, while the lower-energy modes consist of higher-order azimuthal modes (e.g.
 $|m|=2$
). The monotonic growth implies that the wandering mode is dominant and displays similarities to the monotonic growth of the wandering amplitude shown in previous studies (Devenport et al.
Reference Devenport, Rife, Liapis and Follin1996). Figure 5(b) shows that the overall coherent kinetic energy grows linearly in the downstream direction. The observed energy growth coupled with the helical mode structure supports our proposition that the wandering motion may be a consequence of a vortex instability.
(a) The kinetic energy,
 $\tilde{k}_{n}$
, of POD modes
 $n=1,2,3$
and 4. (b) The coherent kinetic energy, representing the sum of all of the individual modes, with a linear fit denoted by the dashed line.

The decoupling of the wake and the vortex in the transverse velocities suggests that the wake insignificantly affects the transverse motion, implying that the wake is unnecessary to model the base flow for the wandering motion. As such, we fit a Batchelor-vortex profile to the mean flow field, as discussed in § 2.3, at the
 $x/c=5$
location where any wake component is absent from even the streamwise velocity component. This procedure provides a base flow for our stability analysis. As we observe energy growth in the streamwise direction, we conduct a spatial stability analysis on the matched Batchelor vortex by prescribing a wandering frequency
 ${\it\omega}$
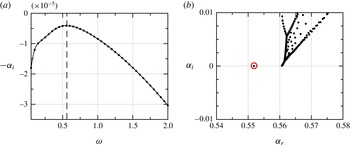
. A frequency sweep, shown in figure 6(a), yields the most unstable eigenvalue
 ${\it\alpha}=0.5420+\text{i}3.67\times 10^{-6}$
at a frequency of
 ${\it\omega}=0.56$
, or
 $St=fc/U_{\infty }\approx 0.1$
. Using our reference scales, this corresponds to a frequency of
 $f=8.2~\text{Hz}$
and agrees well with the frequencies of vortex wandering reported by Devenport et al. (Reference Devenport, Rife, Liapis and Follin1996) and Bailey & Tavoularis (Reference Bailey and Tavoularis2008) for similar parameters.
A frequency sweep (a) showing the growth rate,
 $-{\it\alpha}_{i}$
, as a function of the frequency,
 ${\it\omega}$
, for the fitted Batchelor-vortex parameters. The dashed vertical line indicates the point of maximum growth rate and the corresponding frequency (
 ${\it\omega}=0.56$
) examined throughout this study. The corresponding eigenvalue spectrum is shown in (b), with the most unstable discrete eigenvalue denoted by the red
 $\circ$
.

At this frequency, figure 6(
 $b$
) presents the spatial eigenvalue spectrum, which yields a single eigenvalue in the discrete branch near the neutral line,
 ${\it\alpha}_{i}=0$
. The remaining eigenvalues fall on the continuous branch; the corresponding eigenfunctions describe free-stream oscillations that decay in the streamwise coordinate direction. Therefore, the marginally stable mode, denoted by the red
 $\circ ,$
would prevail far downstream, as all modes decay to zero.
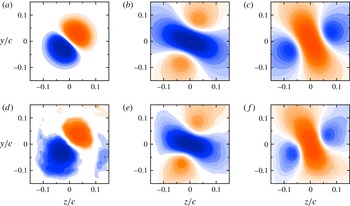
The eigenfunctions of this
 $m=-1$
marginally stable mode are shown in figure 7(a–c), and compared with the first POD mode at the equivalent
 $x/c=5$
position (figure 7
d–f). The leading POD and stability modes demonstrate striking similarities, showing nearly identical size and structure to one another. The stability mode is characterized by a two-lobed helical structure in the streamwise velocity, with non-zero transverse velocity at the vortex core. The qualitative structure of this mode proves to be robust to variations in the base flow, which testifies to the resilience of this mode seen across a variety of experimental conditions over many years of study.
Eigenfunctions and POD mode of the
 $\tilde{u}$
,
 $\tilde{v}$
and
 $\tilde{w}$
velocities, corresponding to (a,d), (b,e) and (c,f) respectively; (a–c) show the eigenfunctions of the most unstable modes from the spatial stability analysis of the Batchelor vortex and (d–f) show the first POD mode of the coherent wandering motion from experiments at
 $x/c=5$
.

The matching structure from the stability and the POD analyses, together with the measured energy growth in the streamwise direction, strongly points towards an instability as the underlying mechanism for vortex wandering; the type of instability, however, is still subject to debate. The instability observed in wind-tunnel experiments may be the response to stochastic forcing by wind-tunnel turbulence, requiring a frequency response (resolvent) analysis to quantify the amplification. Alternatively, an inherent instability could be at the heart of the energy growth, requiring an initial-value (matrix exponential) analysis to determine further details. In either case, for nearly neutrally stable configurations, as is the case in our study, a robust flow structure, consisting of the neutral stability eigenfunction, is expected. Moreover, we point out that our analysis assumed a parallel base flow; a streamwise variation of the base flow has not been accounted for. For upstream positions, however, the trailing-edge wake component is certainly significant, and a pure Batchelor-vortex base flow profile will show its limitations.
4 Conclusions
Using experimental measurements and a spatial stability analysis of a trailing vortex, we argue that the cause of vortex wandering is a vortex instability rather than being solely a result of wind-tunnel effects. By removing the effects of the wandering measured in SPIV data, we extract the wandering motion via a triple decomposition and perform POD to examine the most energetic POD mode, which is helical in nature, (i.e.
 $|m|=1$
). We first examine the formation of this mode as it progresses downstream, showing that a two-lobed structure is developed beyond
 $x/c=1.5$
. Furthermore, the trailing-edge wake is coupled to the vortex dynamics upstream of
 $x/c=1.5$
, indicating that, in the vortex near field, the wake is significant. On the centreline, the transverse velocities of the identified modes displace the vortex producing the wandering motion. This mode diffuses radially downstream, while their coherent kinetic energy grows – further corroborating our proposition of an underlying instability.
We performed a spatial stability analysis on a matched Batchelor vortex, which produced a primary instability mode nearly identical in size and structure to the experimentally captured POD mode. The frequency of the wandering motion is of the order of
 $St=fc/U_{\infty }=O(0.1)$
, which closely matches the frequency range reported in previous studies (Devenport et al.
Reference Devenport, Rife, Liapis and Follin1996; Bailey & Tavoularis Reference Bailey and Tavoularis2008). The growth rate from the stability analysis, however, shows marginal stability, which does not allow us to uniquely identify the type of amplification mechanism (inherent instability or selective noise amplification). Despite this shortcoming, the structure of the associated dominant mode (from both stability and POD-based analyses) could be identified in a robust manner, and an underlying selection mechanism based on a vortex instability can be safely proposed.
Acknowledgements
The authors would like to acknowledge Professor S. Bailey for stimulating discussions. K. Pascioni and Dr R. Reger were instrumental in acquiring the experimental data. We would like to thank the anonymous referees for their comments on the first submission, which ultimately improved the results and the overall impact of this paper. Financial support for this work was provided by the National Science Foundation (PIRE, grant NSF-0968313) and the Office of Naval Research (grants N00014-10-1-0832 and N00014-15-1-2403), monitored by Dr R. Joslin.