


Introduction
Dysmenorrhoea, known as painful menstrual bleeding, is among the most common gynecological issues in women of reproductive age.(Reference Bajalan, Alimoradi and Moafi1) This pain is often felt in the lower back, legs, and pelvic area, and less frequently, it may radiate to the perineal and bladder regions.(Reference Büyükkayacı Duman, Yıldırım and Vural2) A recent systematic review and meta-analysis reported that the global prevalence of dysmenorrhoea among menstruating women is approximately 71.3%.(Reference de Arruda, Barbosa-Silva, Driusso, Pathmanathan, Armijo-Olivo and Avila3) Studies conducted in Türkiye show that the prevalence of dysmenorrhoea ranges between 55.5% and 95.6%,(Reference Aktaş4,Reference Türkmen5) which may be attributable to differences in study populations, diagnostic criteria, and assessment methods.
Dysmenorrhoea is classified as primary or secondary.(Reference Burnett6) Primary dysmenorrhoea (PD) occurs without pelvic pathology,(Reference Burnett6) usually starting shortly before or at the onset of menstruation and lasting 1–3 days.(Reference Nagy, Carlson and Khan7,Reference Subasinghe, Happo, Jayasinghe, Garland and Wark8) It most commonly affects women under 25 and within 6–12 months after menarche.(Reference Büyükkayacı Duman, Yıldırım and Vural2) Risk factors include early menarche, age under 30, heavy or prolonged bleeding, obesity, nulliparity, and unhealthy dietary habits.(Reference Büyükkayacı Duman, Yıldırım and Vural2,Reference Güvey9) Secondary dysmenorrhoea, in contrast, is linked to underlying pathological conditions.(Reference Nagy, Carlson and Khan7) The pathophysiology of PD is primarily associated with excessive endometrial prostaglandin production, increased uterine contractions, inflammation, and oxidative stress, all of which contribute to menstrual pain and related symptoms.(Reference Szmidt, Granda, Sicinska and Kaluza10)
Nonsteroidal anti-inflammatory drugs, analgesics, and oral contraceptive pills are commonly used in the treatment of dysmenorrhoea.(Reference Greco, Carpini, González, Goteri, Ciavattini and Ciarmela11) However, since dysmenorrhoea is often perceived as a normal condition by women and their families, it has been reported that individuals suffering from dysmenorrhoea tend to seek non-pharmacological methods to alleviate their pain rather than seeking treatment from healthcare facilities.(Reference Kartal and Akyuz12) Some women seek natural and complementary remedies to alleviate dysmenorrhoea symptoms, partly because of concerns regarding the potential adverse effects of pharmacological treatments.(Reference Abdul-Razzak, Ayoub, Abu-Taleb and Obeidat13–Reference Choonara, Mobasheri, Hamdy and Jensen15)
Some foods and nutrients are considered natural treatment approaches due to their potential positive effects on alleviating dysmenorrhoea.(Reference Armour, Smith, Steel and Macmillan16) For instance, one study reported that higher dietary calcium intake may be effective in controlling PD.(Reference Abdul-Razzak, Ayoub, Abu-Taleb and Obeidat13) Nagata et al.(Reference Nagata, Hirokawa, Shimizu and Shimizu17) reported that dietary fibre intake is negatively associated with the severity of dysmenorrhoea, whereas dietary fat was found not to be associated with dysmenorrhoea. Tavallaee et al.(Reference Tavallaee, Joffres, Corber, Bayanzadeh and Rad18) found that women who followed a low-fat diet experienced less menstrual pain. Another study found that those who consumed fewer than two servings of fruit per day had a higher risk of experiencing PD.(Reference Onieva-Zafra, Fernández-Martínez and Abreu-Sánchez19) Other studies have highlighted the protective role of fruit and vegetable consumption against menstrual pain.(Reference Bajalan, Alimoradi and Moafi1,Reference Fjerbæk and Knudsen20) Fruits and vegetables may have positive effects on menstrual problems due to their rich vitamin and mineral content and bioactive compounds.(Reference Sergio, Compher and Mumford21)
Phytochemicals are bioactive compounds naturally found in fruits, vegetables, grains, and other plant-based foods, often responsible for various characteristics such as the pigmentation and aroma of plants.(Reference Howes and Simmonds22) Although these compounds are not considered nutrients, their intake through diet exhibits antioxidant, anti-inflammatory, anti-oestrogenic, and immunomodulatory properties.(Reference Howes and Simmonds22,Reference Meriga, Ganjayi and Parim23) Given that inflammation and oxidative stress are involved in the pathophysiology of PD, phytochemical-rich foods may have the potential to alleviate menstrual pain through their biological effects.(Reference Howes and Simmonds22–Reference Adeyemi, Oyebanji, Afonja and Shobowale24) In vitro studies have shown that functional compounds found in olive oil, resveratrol, and various plants may play a significant role in alleviating dysmenorrhoea.(Reference Adeyemi, Oyebanji, Afonja and Shobowale24–Reference Wong, Chiang and Shih27) Therefore, assessing overall dietary phytochemical intake may provide valuable insights into the potential role of phytochemical-rich dietary patterns in the management of PD.
The dietary phytochemical index (DPI) is an alternative and practical indicator of dietary phytochemical intake.(Reference McCarty28) It expresses the share of total dietary energy intake originating from foods that are naturally abundant in phytochemicals, including grains, fruit varieties, vegetables, legumes, tree nuts, seeds, and olive oil. These plant-based foods contain bioactive compounds such as flavonoids, carotenoids, phenolic acids, and phytooestrogens, which contribute to antioxidant and anti-inflammatory processes in the body. A higher DPI score indicates a diet with greater phytochemical density and has been associated with reduced risk of chronic diseases and improved reproductive health outcomes.(Reference Hsia, Wang and Wang25–Reference McCarty28)
Although previous studies have investigated the associations between individual nutrients, food groups, and dysmenorrhoea,(Reference Bajalan, Alimoradi and Moafi1,Reference Abdul-Razzak, Ayoub, Abu-Taleb and Obeidat13,Reference Nagata, Hirokawa, Shimizu and Shimizu17–Reference Fjerbæk and Knudsen20) the relationship between overall dietary phytochemical intake and PD remains unclear. To the best of our knowledge, no previous study has evaluated dietary phytochemical intake using the DPI in women with PD. To address this gap in the literature, this study aimed to examine the association between the DPI and PD among female university students living in Niğde, Türkiye and to provide novel evidence regarding the potential role of phytochemical-rich dietary patterns in the management of menstrual pain.
Methods
Study plan and participants
The sample of this cross-sectional study consisted of women university students living in Niğde, Türkiye. Students were recruited using convenience sampling, and data were collected between May and September 2024. A priori sample size estimation was conducted using G*Power software based on relevant literatüre.(Reference Büyükkayacı Duman, Yıldırım and Vural2,Reference Onieva-Zafra, Fernández-Martínez and Abreu-Sánchez19,Reference Monday, Anthony and Olunu29) Assuming a two-tailed alpha level of 0.05, a statistical power of 0.90, and an effect size derived from previous studies, the minimum required sample size was calculated to be 170 students. Women aged 19–35 years with regular menstrual cycles were included in the study. Women younger than 19 or older than 35 years; those diagnosed with polycystic ovary syndrome; pregnant or breastfeeding; those using dietary supplements, following a special diet, or taking medications that may affect body weight; those who did not provide informed consent; women with a known thyroid disorder; and those with a history of oral contraceptive or hormone replacement therapy use were excluded from the study. Within the scope of the study, 402 students were reached, but some of them (those with missing data, pregnant students, and oral contraceptive users) were excluded for various reasons. The sample consisted of 362 students who fulfilled the inclusion criteria.
The presence of PD was evaluated based on the following criteria.(Reference Jolin, Rapkin, Berek and Novak30,Reference Atasü and Şahmay31)
-
• Pain occurring with every menstrual period.
-
• Pain experienced in the lower back, pelvic area, or abdomen.
-
• Pain starting on the day before menstruation or on the first day of menstruation.
-
• Pain subsiding within 48–72 hours after the start of menstruation.
Study data were collected through face-to-face interviews using a questionnaire form (Supplementary File 1). The questionnaire included general information about the students, a Food Consumption Record, the International Physical Activity Questionnaire Short Form, and the Visual Analog Scale (VAS).
General information
The general information section of the questionnaire included questions regarding the students’ age, smoking status, alcohol consumption, menstrual pain, menstrual regularity, menstrual cycle length, duration of menstrual bleeding (days), amount of menstrual bleeding (light/moderate/heavy), and the presence and characteristics of PD.
Dietary intake
To determine the dietary energy and nutrient intakes of the students, a 3-day dietary record was used. At the first visit, participants completed a 24-hour dietary recall, which constituted the first day of the 3-day dietary assessment. At the end of the visit, students were asked to keep food consumption records for two additional days beginning on the first day of menstruation. Students were given a one-page printed version of the food consumption record form to record the foods they consumed. Detailed information about the portion sizes, cooking methods, and additional ingredients used (e.g., butter, cream, sauces) for all foods and beverages consumed at each meal was requested to be recorded. If eating out, the name of the restaurant and the food eaten should be recorded. The portion sizes of the consumed foods were determined using the ‘Food and Nutrition Photo Catalogue: Measures and Quantities’ catalogue.(Reference Rakıcıoğlu, Acar-Tek, Ayaz and Pekcan32) For the purpose of identifying the content of ready-made or out-of-home meals, the ‘Standard Recipes for Institutional Catering’ book was utilised.(Reference Merdol33) The averages of the three-day food consumption records were analysed by the BEBIS dietary analysis program (Version 8.1) based on the national food composition database.(34)
Dietary phytochemical index
The DPI proposed by McCarty was used to assess the phytochemical intake of students through their diet. This index is calculated by dividing the dietary energy from phytochemical-rich foods (kcal) by the total dietary energy intake (kcal) and multiplying by 100. The foods included in the calculation of the phytochemical content of the diet, due to their high phytochemical content, are fruits/fruit juices, vegetables (excluding potatoes but including other tubers)/vegetable juices, legumes, nuts, seeds, whole grains and foods combined with these, as well as wine, beer, cider, soy, and olive oil.(Reference McCarty28)
International Physical Activity Questionnaire Short Form
The extent of students’ engagement in physical activity was quantified via the Short Form of the International Physical Activity Questionnaire (IPAQ), devised by Craig et al.(Reference Craig35) and linguistically and culturally validated for Turkish respondents by Öztürk et al.(Reference Öztürk36) The instrument assesses activities that participants engaged in for no less than 10 minutes over the last seven days. It also records the number of days and the duration of vigorous physical activity (VPA), moderate physical activity (MPA), or walking (W) performed during the same period. Additionally, it records the time spent being sedentary (sitting, lying down, etc.). Students’ physical activity levels were evaluated according to the Metabolic Equivalent (MET), with HPA, MPA, and walking assigned 8.0, 4.0, and 3.3 MET, respectively. Weekly MET totals were computed by summing the duration and number of days each activity was performed. According to these totals, physical activity was categorised into low (<600 MET-min/week), moderate (600–3000 MET-min/week), and high (>3000 MET-min/week) levels.
Visual analog scale
To determine the intensity of pain, the Visual Analog Scale (VAS) developed by Fredy(Reference Freyd37) and validated in Turkish by Yaray et al.(Reference Yaray, Akesen, Ocaklioğlu and Aydınlı38) was used. A 0–10 cm line was used on this scale, and students were asked to indicate the intensity of their pain on the scale. The intensity of pain was classified into mild (1–3 points), moderate (4–6 points), or severe (7–10 points), following the criteria established by Onieva-Zafra et al.(Reference Onieva-Zafra, Fernández-Martínez and Abreu-Sánchez19) The VAS scores were subsequently used to classify pain severity and to examine the association between DPI and menstrual pain intensity.
Anthropometric measurements
Height (cm Students’ height was measured using a non-stretchable tape measure while their head, hips, and heels were against the wall and their eyes were aligned with their earlobes (in the Frankfort plane), with values recorded to the nearest 0.1 cm.(Reference Lee and Nieman39)
Body Weight (kg): Body weight was measured with students fasting and wearing light clothing using a Tanita (BC 401) scale, with values recorded to the nearest 0.1 kg. BMI was calculated using the measurements of body weight and height [body weight (kg)/height (m)2]. According to WHO criteria, BMI values were classified as underweight (<18.5 kg/m2), normal weight (18.5–24.9 kg/m2), overweight (25.0–29.9 kg/m2), and obesity (≥30.0 kg/m2).(40)
Waist Circumference (cm): Waist circumference was measured with students’ arms at their sides and feet together, with the measurer standing in front of them. The assessment was conducted at the midpoint between the lower rib margin and the iliac crest with a rigid tape measure.(Reference Gibson41)
Ethical considerations
The study protocol was approved by the Ankara University Ethics Committee before data collection (Approval Number: 1381084). All students provided voluntary informed consent to participate in the study, which was conducted in accordance with the Declaration of Helsinki. This cross-sectional study was designed and reported in accordance with the STROBE (Strengthening the Reporting of Observational Studies in Epidemiology) guidelines.
Statistical analysis
Statistical analyses were performed using IBM SPSS Statistics for Windows, version 26.0 (IBM Corp., Armonk, NY, USA). The normality of data distribution was assessed using visual and analytical methods. Descriptive data are presented as frequencies and percentages or as mean ± SD, as appropriate. Pearson’s chi-square test or Fisher’s exact test was used for comparisons of categorical variables. Student’s t-test and one-way ANOVA were used to compare continuous variables. Logistic regression analysis was performed to examine the associations of the DPI with PD and pain severity. Statistical significance was set at p < 0.05.(Reference Hayran and Özdemir42)
Results
General information and menstrual characteristics of the students according to the presence of PD are shown in Table 1. The prevalence of PD was 83.9% among the study participants. No statistically significant differences were observed between students with and without PD in terms of age, smoking status, alcohol consumption, physical activity levels, amount of menstrual flow, duration of the menstrual cycle, or duration of menses (p > 0.05).
General information and menstrual characteristics according to the presence of primary dysmenorrhoea (n = 362)

Table 1. Long description
A table comparing general information and menstrual characteristics based on the presence of primary dysmenorrhoea. The table has 10 rows and 5 columns. Column headers are Age (year), Age classification, Smoking status, Alcohol consumption, Physical activity, Amount of flow, Duration of cycle, and Duration of menses. Row labels are No (n = 58) and Yes (n = 304). Each row contains values for different categories. For example, Row 1: Age (year) values are 21.7 ± 2.4 for No and 21.0 ± 1.3 for Yes. Row 2: Age classification values are <21 with 17 (29.3) for No and 130 (42.8) for Yes, and ≥21 with 41 (70.7) for No and 174 (57.2) for Yes. The table also includes p-Values for each category.
Age (years) was classified according to the median value.
* Pearson chi-square test.
** Student T test.
Anthropometric measurements, dietary intakes, and DPI values according to the presence of PD are presented in Table 2. No significant differences were observed between students with and without PD in terms of body weight, BMI, BMI classification, protein intake, carbohydrate intake, fat intake, total fibre intake, or calcium intake (p > 0.05). However, students with PD had significantly higher waist circumference and dietary energy intake and significantly lower magnesium, potassium, and DPI scores compared with those without PD (p < 0.05).
Anthropometric measurements, dietary intake and DPI according to the presence of primary dysmenorrhoea (n = 362)

Table 2. Long description
The table presents a comparison of anthropometric measurements and dietary intakes between individuals with and without primary dysmenorrhoea. It includes data for 58 individuals without primary dysmenorrhoea and 304 individuals with primary dysmenorrhoea. The table is divided into two main sections: Anthropometric measurements and Dietary intake. Anthropometric measurements include body weight, waist circumference, BMI, and BMI classification. Dietary intake includes energy, protein, carbohydrate, fat, total fibre, calcium, magnesium, potassium, and DPI score. Each row provides specific values for these measurements and intakes, along with p-values indicating the significance of differences between the two groups. Notable trends include significantly higher waist circumference and dietary energy intake, and significantly lower magnesium, potassium, and DPI scores in individuals with primary dysmenorrhoea compared to those without.
DPI, dietary phytochemical index.
* Pearson chi-square test.
** Student T test.
Table 3 presents anthropometric measurements, dietary intakes, and DPI scores according to pain severity classification in students with PD. No significant differences were observed among the pain severity groups regarding anthropometric measurements, energy and nutrient intakes, or mineral intakes (p > 0.05). However, students with severe pain had significantly lower DPI scores than those with mild or moderate pain (p < 0.05).
Anthropometric measurements, dietary intake, and DPI according to pain intensity classification in patients with primary dysmenorrhoea (n = 304)

Table 3. Long description
The table presents data on anthropometric measurements, dietary intake, and DPI scores categorized by pain intensity (mild, moderate, severe) in patients with primary dysmenorrhoea. It includes three main sections: Anthropometric measurements, Dietary intake, and DPI score. Anthropometric measurements include BMI and waist circumference. Dietary intake covers energy, protein, carbohydrate, fat, total fibre, calcium, magnesium, and potassium. The table has 12 rows and 5 columns. Column headers are Pain intensity (VAS), Mild, Moderate, Severe, and p-Value. Row 1: BMI (kg per square meter), 21.5 plus or minus 2.9, 22.0 plus or minus 3.1, 22.7 plus or minus 3.4, 0.053. Row 2: Waist circumference (centimeters), 84.8 plus or minus 16.2, 88.2 plus or minus 19.3, 90.9 plus or minus 20.0, 0.135. Row 3: Energy (kilocalories per day), 1906.7 plus or minus 635.2, 1969.1 plus or minus 565.0, 1973.3 plus or minus 529.5, 0.753. Row 4: Protein (grams per day), 71.9 plus or minus 29.2, 76.3 plus or minus 25.8, 77.4 plus or minus 26.0, 0.422. Row 5: Protein (percent of energy), 15.7 plus or minus 3.9, 16.0 plus or minus 4.0, 16.3 plus or minus 4.3, 0.642. Row 6: Carbohydrate (grams per day), 229.6 plus or minus 88.7, 230.0 plus or minus 84.0, 241.1 plus or minus 89.8, 0.541. Row 7: Carbohydrate (percent of energy), 49.3 plus or minus 7.2, 47.7 plus or minus 9.1, 49.4 plus or minus 8.7, 0.264. Row 8: Fat (grams per day), 74.8 plus or minus 27.3, 80.7 plus or minus 31.3, 75.1 plus or minus 23.7, 0.205. Row 9: Fat (percent of energy), 35.1 plus or minus 5.8, 36.3 plus or minus 7.8, 34.3 plus or minus 7.6, 0.106. Row 10: Total fibre (grams per day), 19.6 plus or minus 9.9, 19.2 plus or minus 9.1, 19.2 plus or minus 9.2, 0.954. Row 11: Calcium (milligrams per day), 594.8 plus or minus 206.0, 649.8 plus or minus 227.5, 654.7 plus or minus 250.7, 0.276. Row 12: Magnesium (milligrams per day), 266.5 plus or minus 78.9, 291.1 plus or minus 102.2, 280.8 plus or minus 91.8, 0.288. Row 13: Potassium (milligrams per day), 2325.1 plus or minus 833.9, 2358.0 plus or minus 786.7, 2446.8 plus or minus 873.9, 0.575. Row 14: DPI score, 21.8 plus or minus 9.8, 21.2 plus or minus 10.8, 17.8 plus or minus 9.5, 0.009.
DPI, dietary phytochemical index.
One-Way ANOVA.
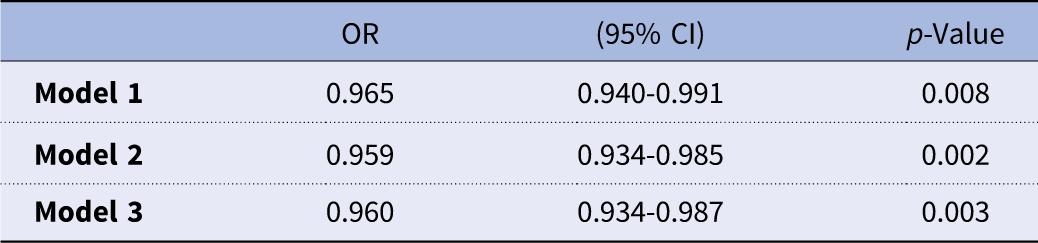
Table 4 shows the association between DPI and PD. Higher DPI scores were significantly associated with lower odds of PD in both the crude and adjusted models. In the fully adjusted model, each one-unit increase in DPI score was associated with 4.0% lower odds of having PD (OR = 0.960, 95% CI: 0.934–0.987, p < 0.05).
Association of DPI with primary dysmenorrhoea (n = 362)

Table 4. Long description
A table with three rows and four columns. The columns are labeled OR, 95% CI, and p-Value. The rows are labeled Model 1, Model 2, and Model 3. Row 1: OR, 0.965; 95% CI, 0.940-0.991; p-Value, 0.008. Row 2: OR, 0.959; 95% CI, 0.934-0.985; p-Value, 0.002. Row 3: OR, 0.960; 95% CI, 0.934-0.987; p-Value, 0.003.
DPI, dietary phytochemical index.
Logistic regression analysis.
Model 1: crude model.
Model 2: Adjusted for age and BMI.
Model 3: Adjusted for Model 2+ smoking status, alcohol consumption, and physical activity.
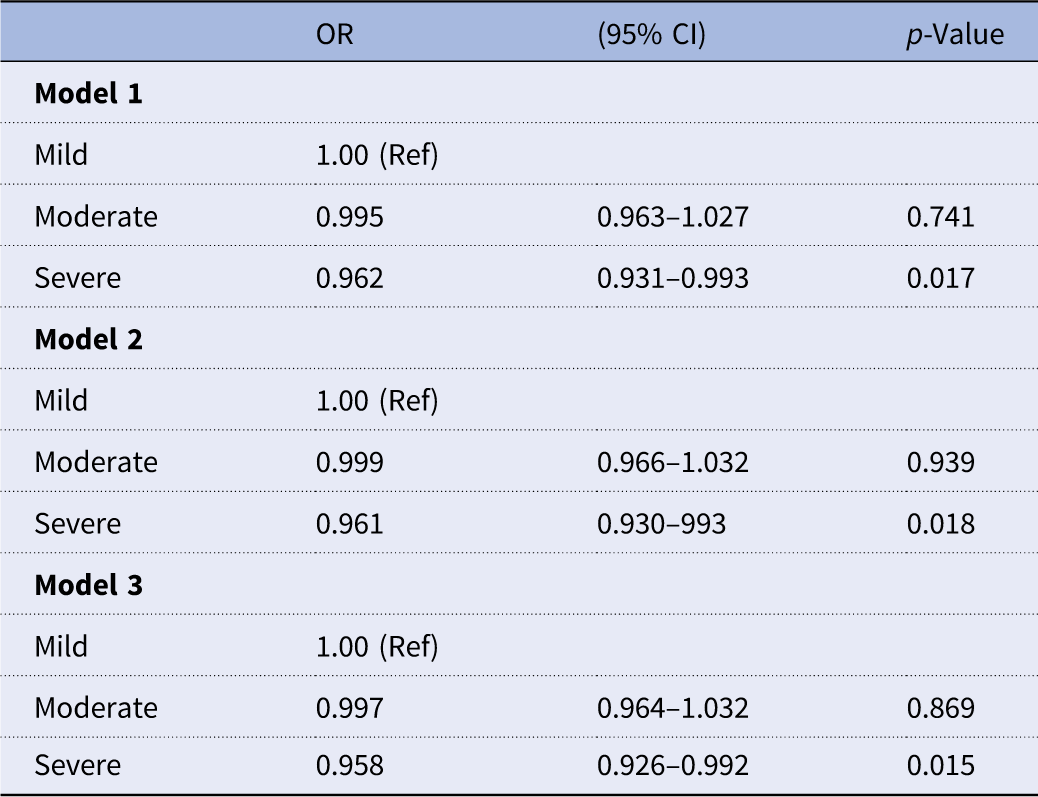
Table 5 presents the association between DPI and pain severity among students with PD. Compared with mild pain, DPI scores were not significantly associated with moderate pain severity in any model (p > 0.05). However, higher DPI scores were significantly associated with lower odds of severe pain in both crude and adjusted models. In the fully adjusted model, each one-unit increase in DPI score was associated with 4.2% lower odds of severe pain (OR = 0.958, 95% CI: 0.926–0.992, p < 0.05).
Association of DPI with pain intensity in primary dysmenorrhoea (n = 304)

Table 5. Long description
The table presents the association between DPI and pain severity among students with PD. It has three models, each with rows for mild, moderate, and severe pain. Each model includes columns for OR, 95% CI, and p-Value. Model 1 shows OR values of 1.00 for mild, 0.995 for moderate, and 0.962 for severe pain, with p-values of reference, 0.741, and 0.017 respectively. Model 2 shows OR values of 1.00 for mild, 0.999 for moderate, and 0.961 for severe pain, with p-values of reference, 0.939, and 0.018 respectively. Model 3 shows OR values of 1.00 for mild, 0.997 for moderate, and 0.958 for severe pain, with p-values of reference, 0.869, and 0.015 respectively.
DPI, dietary phytochemical index.
Logistic regression analysis.
Model 1: crude model.
Model 2: Adjusted for age and BMI.
Model 3: Adjusted for Model 2+ smoking status, alcohol consumption, and physical activity.
Discussion
The present study demonstrated that lower DPI scores were associated with both the presence and severity of PD. Additionally, students with PD had higher waist circumference and dietary energy intake and lower potassium and magnesium intake. To our knowledge, this is the first study to investigate the association between DPI and PD.
As the primary finding of the present study, lower DPI scores were associated with both the presence and greater severity of PD. Studies have shown that the consumption of fruits, vegetables, and legumes rich in phytochemicals reduces the risk of PD.(Reference Tavallaee, Joffres, Corber, Bayanzadeh and Rad18,Reference Onieva-Zafra, Fernández-Martínez and Abreu-Sánchez19) This study found a higher likelihood of having a lower DPI score among students with PD and severe pain. According to current literature, the relationship between DPI and PD has not yet been explored.
The relationship between DPI and PD may be explained through various potential mechanisms. Alterations in gut microbiota, or dysbiosis, can modulate beta-glucuronidase activity – the primary pathway for oestrogen deconjugation – impacting overall oestrogen metabolism. Oestrogen metabolism is regulated by the gut microbiota through the oestrogen-gut axis and estrobolome pathway, and impairments in these mechanisms can result in gynecological conditions such as dysmenorrhoea.(Reference Zakaria, Mohammed Zain and Teik43) Dietary phytochemicals entering the gut ecosystem act as prebiotic and antimicrobial agents against harmful gut microbiota, beneficially altering the microbial ecology.(Reference Santhiravel, Bekhit and Mendis44) This change may be effective in alleviating dysmenorrhoea severity. Additionally, the anti-inflammatory effects of phytochemicals(Reference Nisar, Jagtap and Vyavahare45) may reduce pain severity by decreasing inflammation in the pelvic region. Lastly, some phytochemicals have direct analgesic effects.(Reference Singh, Kumar and Vinayak46)
Inadequate intake of certain nutrients can influence the frequency and severity of PD. This study found that students with PD had lower dietary intakes of potassium and magnesium. Adequate potassium intake may help reduce muscle cramps and spasms(Reference Abe47), which could be effective in alleviating the severity of dysmenorrhoea. Magnesium-rich foods may reduce dysmenorrhoea severity by decreasing prostaglandin synthesis and muscle and vessel spasms.(Reference Bavil, Dolatian, Mahmoodi and Baghban48) Several studies have reported beneficial effects of magnesium in alleviating the severity of PD.(Reference Hudson49,Reference Charandabi, Mirghafourvand, Nezamivand-Chegini and Javadzadeh50) However, evidence from a systematic review and meta-analysis indicated that magnesium consumption is not associated with dysmenorrhoea.(Reference Bajalan, Alimoradi and Moafi1) Taken together, the available evidence regarding the role of magnesium in PD remains inconclusive. The Turkey Nutrition Guide (2022) recommends a daily intake of 300 mg of magnesium and 3500 mg of potassium for adult women.(51) In the present study, magnesium intake among students with PD was below these recommendations, and potassium intake was also below the recommended level in both groups, although it was lower among students with PD. These findings may indicate suboptimal intake of these minerals among students with PD. However, given the inconsistent evidence regarding magnesium, its role in PD should be interpreted with caution. Additional research is required to elucidate the relationship between dietary factors and PD.
The fundamental pathogenesis accepted for the development of PD is the excessive production of prostaglandins. Abdominal adiposity disrupts the homeostasis of steroid hormones, including androgens, oestrogen, and sex hormone-binding globulin (SHBG). Variations in SHBG concentrations can modulate the release of oestrogen and androgens within target tissues.(Reference Agarwal and Venkat52) Additionally, increased fat tissue can directly enhance oestrogen production. The rate of prostaglandin production increases following endometrial stimulation by oestrogen and progesterone. Therefore, an increase in fat tissue may contribute to dysmenorrohea by elevating prostaglandin production.(Reference Agarwal and Venkat52,Reference Ortiz, Rangel-Flores, Carrillo-Alarcón and Veras-Godoy53) In this study, students with PD had a higher waist circumference compared to those without it. In contrast, a study conducted with high school girls found a lower waist circumference in those with dysmenorrhoea.(Reference Rad, Sabzevari, Rastaghi and Dehnavi54) Metin and Süt(Reference Metin and Süt55) reported that there was no significant difference in waist circumference based on the presence of PD. The discrepancies in study results may be related to factors such as sample size, regional differences, and cultural differences.
In the present study, students with PD had a significantly higher dietary energy intake than those without PD. Higher dietary energy intake has been proposed as a potential factor contributing to dysmenorrhoea severity.(Reference Ju, Jones and Mishra56) However, no significant differences were observed in BMI or physical activity levels between the groups in our study. Therefore, the higher energy intake observed in students with PD should be interpreted with caution, and further studies are needed to clarify its relationship with PD.
This study has several limitations. Primarily, the study’s cross-sectional nature limits conclusions regarding causality among the examined variables. While DPI reflects phytochemical intake, different diets with the same DPI score may contain varying phytochemical components, which could result in different findings regarding the relationship between PD and DPI. Cooking techniques and interactions of phytochemicals with other foods/nutrients may alter the phytochemical content in foods.
Conclusions
In conclusion, the prevalence of PD was high among female university students. Students with PD had higher waist circumference and dietary energy intake and lower potassium, magnesium, and DPI scores. Lower DPI scores were associated with both the presence and greater severity of PD. To our knowledge, this is the first study to demonstrate an association between dietary phytochemical intake and PD. These findings suggest that phytochemical-rich dietary patterns may play a potential role in the management of PD; however, prospective studies are needed to confirm these associations and clarify the underlying mechanisms.
Supplementary material
The supplementary material for this article can be found at https://doi.org/10.1017/jns.2026.10144.
Data availability statement
The datasets generated during the current study are available from the corresponding author on reasonable request.
Acknowledgements
The authors are grateful to all participants.
Author contributions
All authors contributed to the preparation of the manuscript and agreed with the final version. The author contributions are as follows: lead author (CMI), joint Chief-Investigators (SY, MÇ), senior academic support (NYA), concept (CMI), grant application (CMI, SY, MÇ), design of protocol and survey (CMI, SY), research ethics and governance (CMI, NYA), data collection (SY, MÇ) data analysis (CMI), data management (CMI, SY), project management (CMI, NYA), drafting paper (CMI), reviewing paper (CMI, SY, MÇ, NYA).
Funding statement
This research was funded by the Scientific and Technological Research Council of Turkey (TUBITAK), project number 1919B012307486.
Competing interests
The authors declare that they have no competing interests.
Ethical standard
The study protocol was approved by the ethics committee of Ankara University (Approval Number: 1381084). Written informed consent was obtained from all students. All procedures adhered to the principles of the Declaration of Helsinki.
Consent for publication
Not applicable.
Artificial intelligence use declaration
The authors used ChatGPT (GPT-5, OpenAI) to improve the language clarity and readability of the manuscript.




 Open access

